|
|
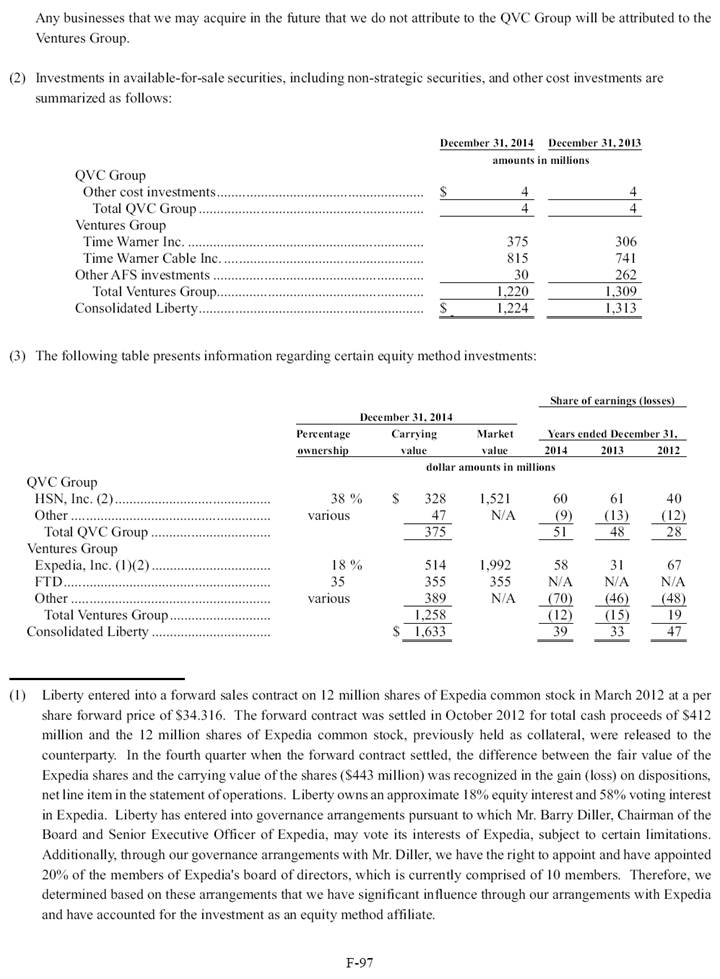
a n n u a l r e p o r t 2014 |
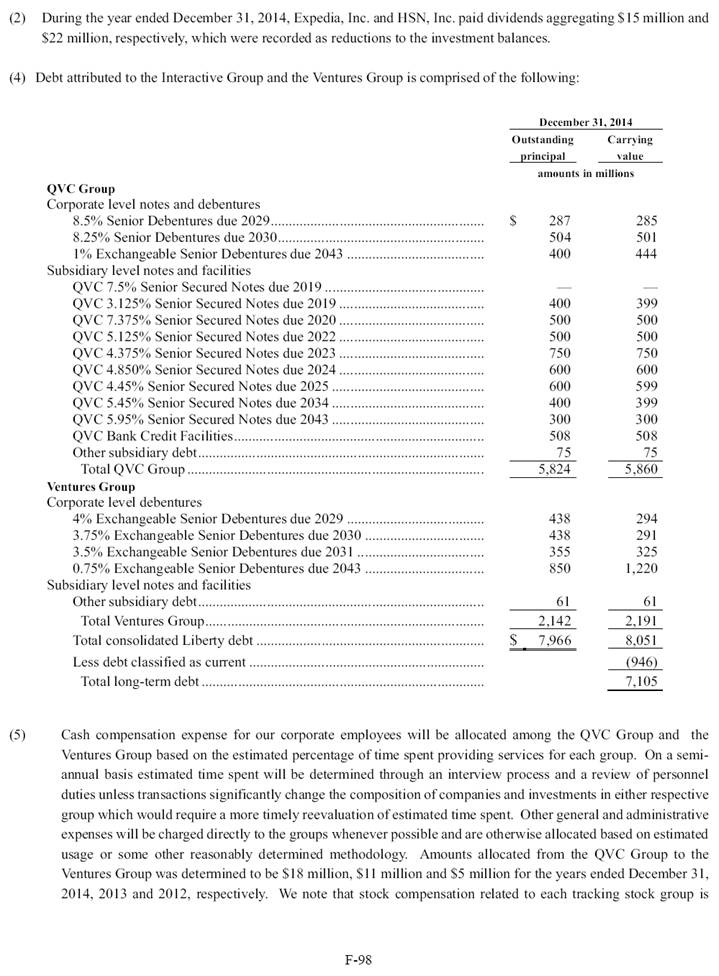
|
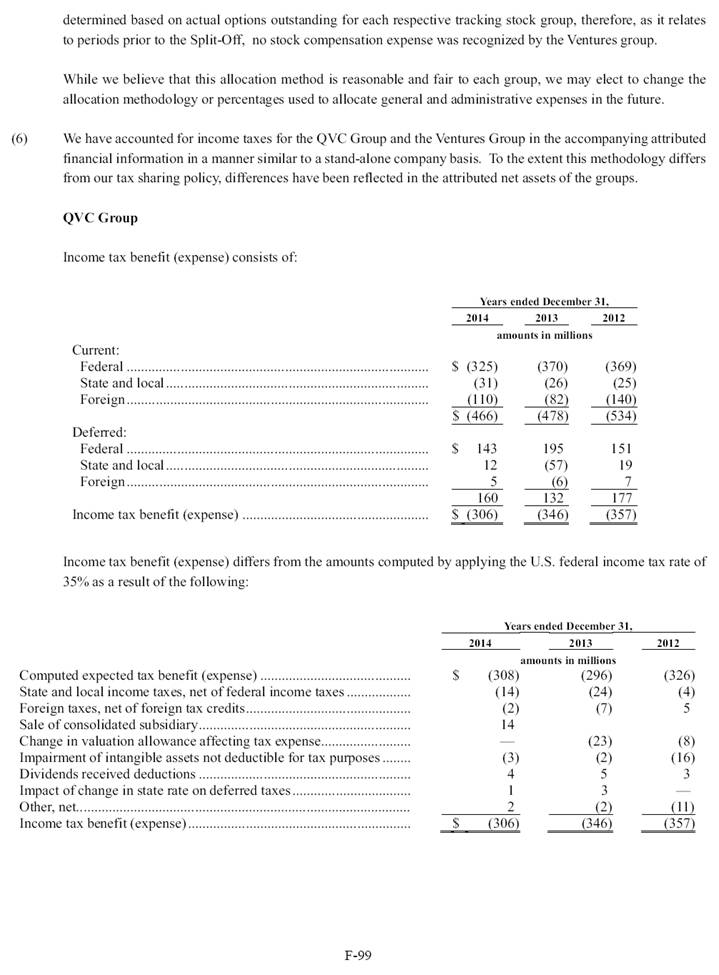
|
a n n u a l r e p o r t 2014 |
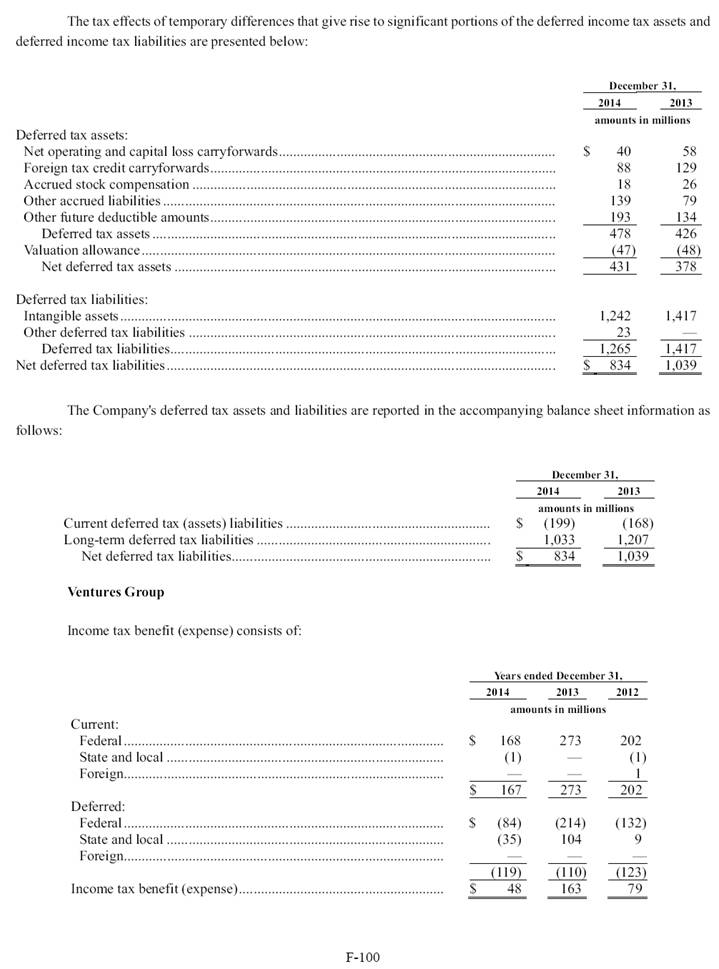
|
|
[LOGO] |
|
|
Annual Report 2014 Certain statements in this Annual Report constitute forward-looking statements within the meaning of the Private Securities Litigation Reform Act of 1995, including statements regarding our business, product and marketing strategies; new service offerings; future investment opportunities; the performance of our current investments; revenue growth at QVC, Inc.; the recoverability of our goodwill and other long-lived assets; our projected sources and uses of cash; and the anticipated impact of certain contingent liabilities related to legal and tax proceedings and other matters arising in the ordinary course of business. In particular, statements in our “Letter to Shareholders” and under “Management’s Discussion and Analysis of Financial Condition and Results of Operations” and “Quantitative and Qualitative Disclosures About Market Risk” contain forward-looking statements. Where, in any forward-looking statement, we express an expectation or belief as to future results or events, such expectation or belief is expressed in good faith and believed to have a reasonable basis, but there can be no assurance that the expectation or belief will result or be achieved or accomplished. The following include some but not all of the factors that could cause actual results or events to differ materially from those anticipated: • customer demand for our products and services and our ability to adapt to changes in demand; • competitor responses to our products and services; • increased digital TV penetration and the impact on channel positioning of our programs; • the levels of online traffic to our businesses’ websites and our ability to convert visitors into consumers or contributors; • uncertainties inherent in the development and integration of new business lines and business strategies; • our future financial performance, including availability, terms and deployment of capital; • the launch of QVC France and the expected expenditures in connection therewith; • our ability to successfully integrate and recognize anticipated efficiencies and benefits from the businesses we acquire; • the ability of suppliers and vendors to deliver products, equipment, software and services; • the outcome of any pending or threatened litigation; • availability of qualified personnel; • changes in, or failure or inability to comply with, government regulations, including, without limitation, regulations of the Federal Communications Commission, and adverse outcomes from regulatory proceedings; • changes in the nature of key strategic relationships with partners, distributors, suppliers and vendors; • domestic and international economic and business conditions and industry trends; • consumer spending levels, including the availability and amount of individual consumer debt; • changes in distribution and viewing of television programming, including the expanded deployment of personal video recorders, video on demand and IP television and their impact on home shopping programming; • rapid technological changes; • the regulatory and competitive environment of the industries in which we operate; • failure to protect the security of personal information about our customers, subjecting us to potentially costly government enforcement actions or private litigation and reputational damage; • threatened terrorist attacks, political unrest in international markets and ongoing military action around the world; and • fluctuations in foreign currency exchange rates. These forward-looking statements and such risks, uncertainties and other factors speak only as of the date of this Annual Report, and we expressly disclaim any obligation or undertaking to disseminate any updates or revisions to any forward-looking statement contained herein, to reflect any change in our expectations with regard thereto, or any other change in events, conditions or circumstances on which any such statement is based. When considering such forward-looking statements, you should keep in mind any risk factors identified and other cautionary statements contained in this Annual Report. Such risk factors and statements describe circumstances which could cause actual results to differ materially from those contained in any forward-looking statement. This Annual Report includes information concerning public companies in which we have non-controlling interests that file reports and other information with the SEC in accordance with the Securities Exchange Act of 1934, as amended. Information contained in this Annual Report concerning those companies has been derived from the reports and other information filed by them with the SEC. If you would like further information about these companies, the reports and other information they file with the SEC can be accessed on the Internet website maintained by the SEC at www.sec.gov. Those reports and other information are not incorporated by reference in this Annual Report. Letter to Shareholders 1 Stock Performance 5 Investment Summary 8 Financial Information F-1 Corporate Data Inside Back Cover Contents |
|
|
[LOGO] |
|
|
Annual Report 2014 1 Dear Fellow Shareholders, We often start by writing “it’s been a busy year” and this one would be no exception. If you held both of the Liberty Interactive tracking stocks a year ago, some of your shares have a new ticker (LINTA => QVCA), you received a distribution of shares of Liberty Ventures Group and you hold shares of a whole new publicly traded company – Liberty TripAdvisor Holdings. These activities were consistent with our strategy – create long-term shareholder value tax efficiently – and, we believe, successful. In August 2014, Liberty Ventures Group spun-off Liberty TripAdvisor, which holds our former stakes in TripAdvisor and BuySeasons. We created Liberty TripAdvisor to tax efficiently highlight the value of our TripAdvisor investment and provide investor choice, while retaining control and setting up an efficient structure. Liberty TripAdvisor raised a $400 million margin loan, with $350 million of this being distributed to Liberty Ventures Group, which will be used for repurchases of our shares within twelve months of the spin-off. Following the Liberty TripAdvisor spin-off, we re-evaluated our structure and best opportunities for investment, which subsequently led to the reattribution announced on October 4th. In this reattribution, the digital commerce companies and $1 billion of cash were reattributed from Liberty Interactive Group to Liberty Ventures Group with Liberty Interactive Group shareholders receiving a tax-free dividend of Liberty Ventures Group shares. In connection with the reattribution we began referring to Liberty Interactive Group as QVC Group, and the tickers were changed to QVCA and QVCB. Our rationale for the reattribution was: • Create a pure-play equity focused on multi-channel commerce, the QVC Group; • Achieve our target leverage at QVC; • Place capital where it had the most opportunities for investment; and • Receive value for the digital commerce companies by aligning them with a more growth-oriented investor base. Although the initial reaction of some was hesitant, we are happy to say that as of April 6th both QVCA and LVNTA now trade above their respective pre-reattribution levels. In that time, QVCA (inclusive of the LVNTA dividend received) has appreciated approximately 25%, while LVNTA is up approximately 16% over the same period. Some also ask us “why maintain the tracking stock structure?” and our answer is simple: because it works. It allows us to maintain the benefits of a “conglomerate” with a tax-efficient and reduced cost structure, and provides the ability to reattribute assets and liabilities between businesses to better address opportunities if needed, while also providing investor choice. We still believe trackers are poised for an increase in popularity. Letter to Shareholders |
|
|
Liberty Interactive Corporation QVC group It was an exciting year for QVC with continued progress in delivering a compelling shopping experience based on its four pillars of discovery, storytelling, social engagement and outstanding service. Mike George and his team continue to excel. QVC’s investment in eCommerce enhancements is paying off and enabled the company to generate $3.5 billion in eCommerce revenues and $1.7 billion in mobile orders, once again making it one of the world’s largest and most profitable eCommerce and mobile retailers. QVC entered 2015 with its largest ever customer count. US results were outstanding across the board. QVC Plus, our second channel in the US, now reaches 54 million homes, and we are using it more for original and counter programming. In February 2015, QVC introduced a new shipping and handling policy. We recognize that customers are increasingly sensitive to shipping and handling rates and given our momentum from 2014, we felt it was the right time to adjust our rates with a large majority of items now shipping for either $3 or $5. There are some gives and takes in the policy, and we expect it will be largely neutral to revenue growth with the net adjusted OIBDA margin impact to be in the range of a decrease of 20-30 basis points. Turning to our international markets, the trends from 2013 largely continued in 2014, with strength in the UK, China and Italy and lingering challenges in Japan and Germany. In 2015, we are cautiously optimistic that Japan will not face the same major macroeconomic headwinds from 2014. Germany has worked through many of its vendor transitions and the team is invigorated by its new CEO. We were thrilled for QVC Italy to achieve OIBDA positive results in the fourth quarter of 2014, and we look forward to the launch of QVC France this summer. Taking lessons learned from Italy, the capital and operational expense outlay in France will be lower, and it will be our first true multi-channel launch. Exchange rate movements are expected to be a challenge in 2015, but they are mainly translational with little impact to our margins. We often point analysts and investors to the strength of QVC Group’s financial results, but due to the tracking stock structure and the quirks of purchase accounting, comparisons on an earnings per share basis can be a bit obfuscated. As such, we recently introduced a new metric: adjusted net income.* We hope this will make it easier to compare and highlight QVC’s financial and operational dominance. Our other large holding at the QVC Group is HSN. We were very pleased with their one-time dividend, and announced additional share repurchase program and accompanying leverage increase in 2015. The company has performed well, and we believe it will continue to excel, with the added benefit of a more efficient balance sheet. 2 *Defined as attributed net income with add-backs for (i) non-cash, non-tax deductible purchase accounting amortization, net of book deferred tax benefit and (ii) the net income/loss from the digital commerce companies through the date of the reattribution. |
|
|
Annual Report 2014 In 2014, we returned $3.26 billion in value to QVC Group shareholders through the reattribution and share repurchases, and ended the year near our target leverage ratio of 2.5x. Going forward we expect the main use of capital at QVC Group to be share repurchases that will more closely track free cash flow generation. Additionally, we will continue to refine the cost of capital and maturity profile of QVC, taking advantage of attractive capital markets. Liberty VentureS group We were pleased to end the year with almost $2.8 billion of cash at Liberty Ventures Group. We have publicly stated we would love to find a big transformational investment. Having more cash not only increases the universe of potential deals, but also differentiates us by our ability to write a big check. Our track record as long-term equity partners should increase our appeal. Additionally, we don’t shy away from complicated situations; complexity plays to our strengths. We expect to be patient, rational allocators of capital and welcome your thoughts on potential investments. Activity with our digital commerce companies was high over the past year. Provide Commerce was acquired by FTD, and we are now the happy owners of 35% of FTD. We felt the floral and gifting market would benefit from consolidation, and the combination of FTD and ProFlowers would be very complementary. CommerceHub, our only B-to-B business, purchased Mercent, expanding its product portfolio. Given the attractiveness of this space and the high margin profile, we hope to complete additional, well-priced, synergistic acquisitions. Backcountry.com and Bodybuilding.com both grew nicely with expanding margins and continue to be leaders in their respective fields. Over time, we will evaluate how to best drive value for our shareholders with these businesses. The other large asset at Liberty Ventures Group is our stake in Expedia which is valued at around $2 billion. We continue to assess the various options regarding this investment. Thus far, our patience has paid off, as Expedia has proven to be an attractive investment. 3 |
|
|
Liberty Interactive Corporation 4 Looking AheAd We are excited for the year ahead. QVC Group is a focused pure-play in the multi-channel retail space which we think will help it get the attention it well deserves from the financial community. We expect the prevalent and growing trend of video consumption on any device to drive growth in existing and new markets. At Liberty Ventures the potential for activity is high and could be spread across our operating assets, our investments, and of course, looking for that high-return investment for our cash. The Board of Directors is also pleased to report that Liberty has extended Greg’s employment contract to serve as CEO for five more years. Greg and his team have successfully overseen the evolution and growth of the Liberty family of companies and increased shareholder value. We look forward to a continuation of this success for years to come. We look forward to seeing many of you at this year’s annual investor meeting, which will take place on November 12th at the TimesCenter at 242 West 41st Street in New York City. We appreciate your ongoing support. Very truly yours, Gregory B. Maffei John C. Malone President and Chief Executive Officer Chairman of the Board April 2015 |
|
|
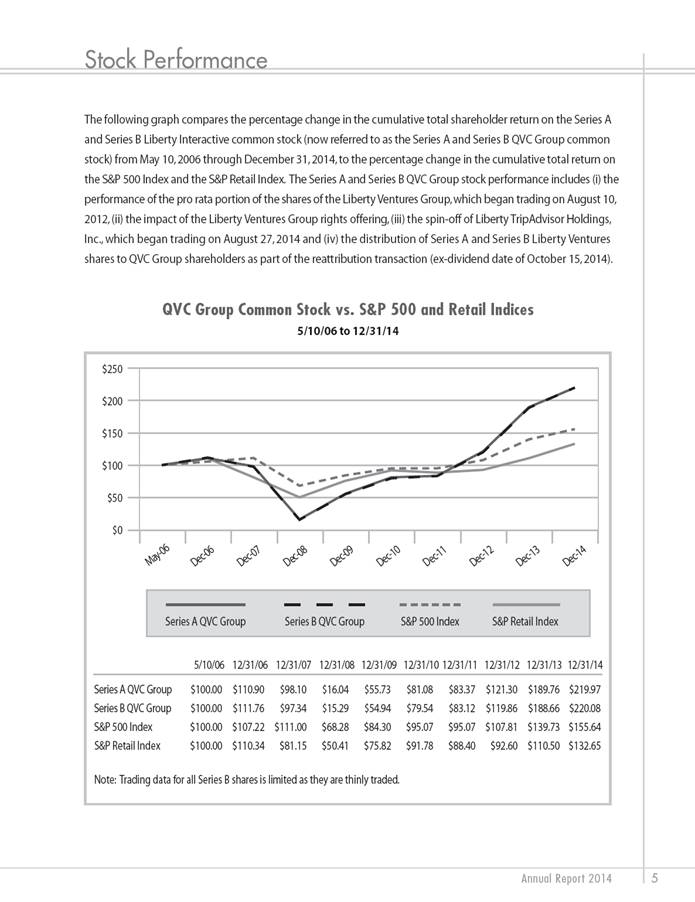
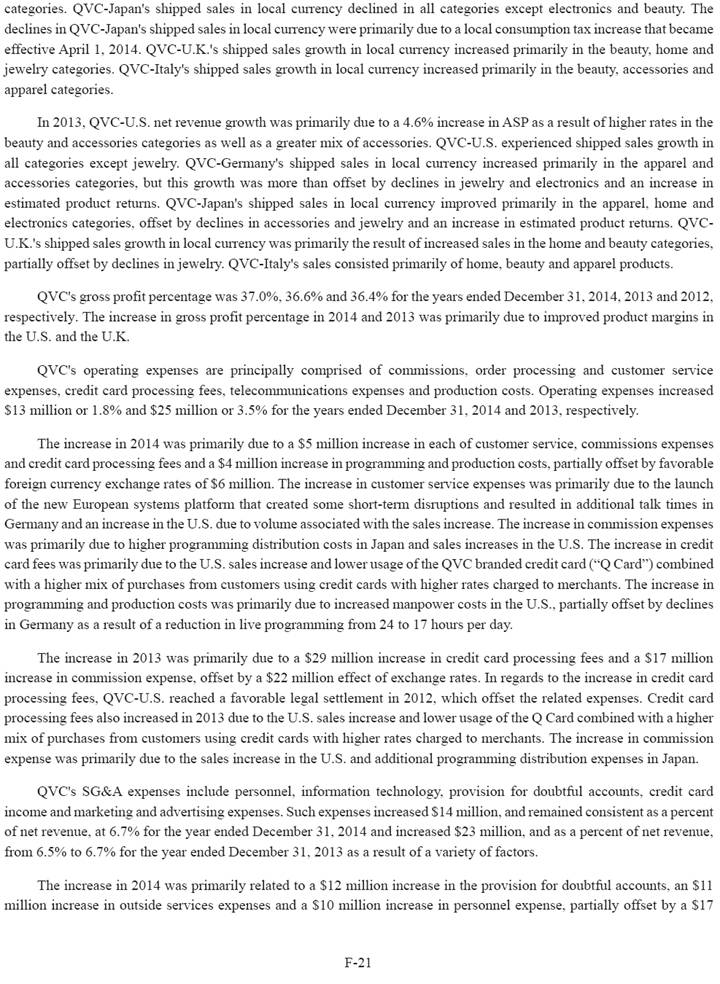
Annual Report 2014 The following graph compares the percentage change in the cumulative total shareholder return on the Series A and Series B Liberty Interactive common stock (now referred to as the Series A and Series B QVC Group common stock) from May 10, 2006 through December 31, 2014, to the percentage change in the cumulative total return on the S&P 500 Index and the S&P Retail Index. The Series A and Series B QVC Group stock performance includes (i) the performance of the pro rata portion of the shares of the Liberty Ventures Group, which began trading on August 10, 2012, (ii) the impact of the Liberty Ventures Group rights offering, (iii) the spin-off of Liberty TripAdvisor Holdings, Inc., which began trading on August 27, 2014 and (iv) the distribution of Series A and Series B Liberty Ventures shares to QVC Group shareholders as part of the reattribution transaction (ex-dividend date of October 15, 2014). Stock performance QVC Group Common Stock vs. S&P 500 and Retail Indices 5/10/06 to 12/31/14 5 5/10/06 12/31/06 12/31/07 12/31/08 12/31/09 12/31/10 12/31/11 12/31/12 12/31/13 12/31/14 Series A QVC Group $100.00 $110.90 $98.10 $16.04 $55.73 $81.08 $83.37 $121.30 $189.76 $219.97 Series B QVC Group $100.00 $111.76 $97.34 $15.29 $54.94 $79.54 $83.12 $119.86 $188.66 $220.08 S&P 500 Index $100.00 $107.22 $111.00 $68.28 $84.30 $95.07 $95.07 $107.81 $139.73 $155.64 S&P Retail Index $100.00 $110.34 $81.15 $50.41 $75.82 $91.78 $88.40 $92.60 $110.50 $132.65 Note: Trading data for all Series B shares is limited as they are thinly traded. $250 $200 $150 $100 $50 $0 May-06 Dec-14 Dec-13 Dec-12 Dec-11 Dec-10 Dec-09 Dec-08 Dec-07 Dec-06 Series A QVC Group Series B QVC Group S&P 500 Index S&P Retail Index |
|
|
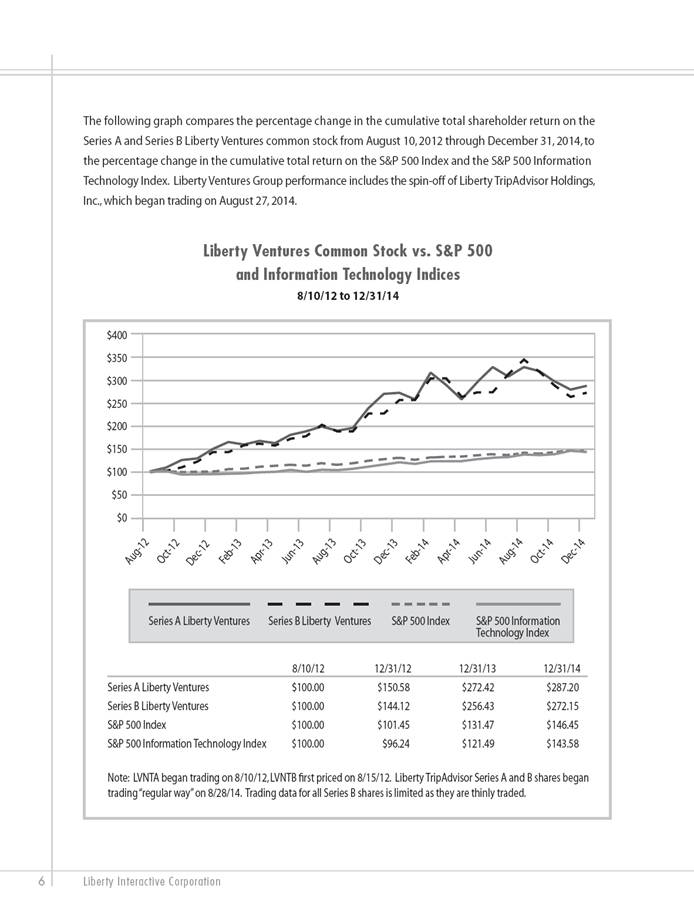
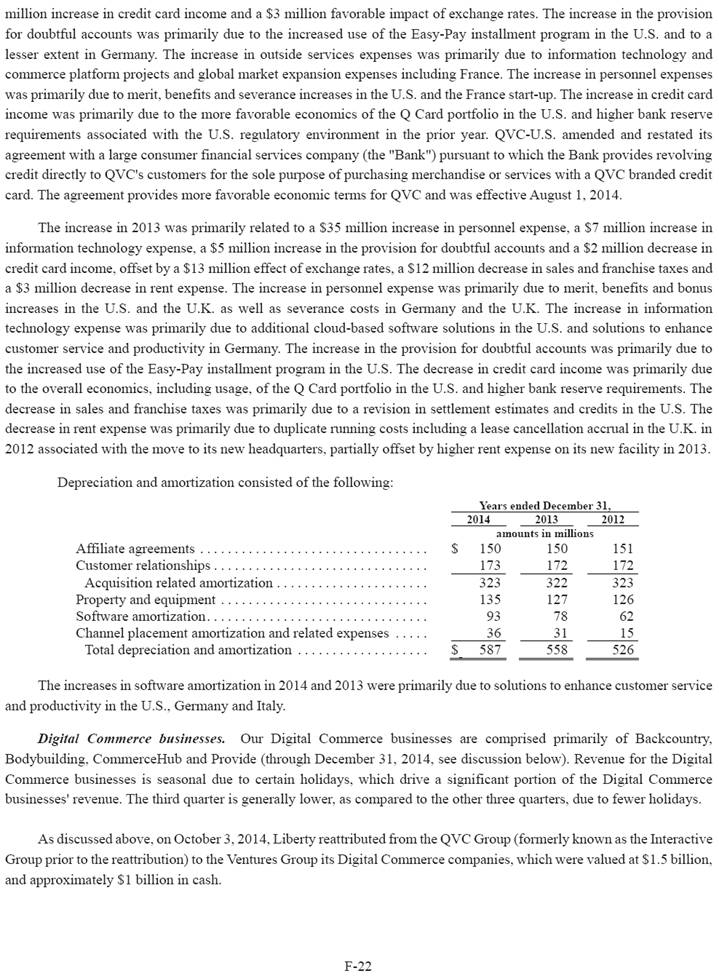
Liberty Interactive Corporation 6 The following graph compares the percentage change in the cumulative total shareholder return on the Series A and Series B Liberty Ventures common stock from August 10, 2012 through December 31, 2014, to the percentage change in the cumulative total return on the S&P 500 Index and the S&P 500 Information Technology Index. Liberty Ventures Group performance includes the spin-off of Liberty TripAdvisor Holdings, Inc., which began trading on August 27, 2014. Liberty Ventures Common Stock vs. S&P 500 and Information Technology Indices 8/10/12 to 12/31/14 Series A Liberty Ventures Series B Liberty Ventures S&P 500 Index S&P 500 Information Technology Index 8/10/12 12/31/12 12/31/13 12/31/14 Series A Liberty Ventures $100.00 $150.58 $272.42 $287.20 Series B Liberty Ventures $100.00 $144.12 $256.43 $272.15 S&P 500 Index $100.00 $101.45 $131.47 $146.45 S&P 500 Information Technology Index $100.00 $96.24 $121.49 $143.58 Note: LVNTA began trading on 8/10/12, LVNTB first priced on 8/15/12. Liberty TripAdvisor Series A and B shares began trading “regular way” on 8/28/14. Trading data for all Series B shares is limited as they are thinly traded. $400 $350 $300 $250 $200 $150 $100 $50 $0 Aug-12 Dec-14 Oct-14 Aug-14 Jun-14 Apr-14 Feb-14 Dec-13 Oct-13 Aug-13 Jun-13 Apr-13 Feb-13 Dec-12 Oct-12 |
|
|
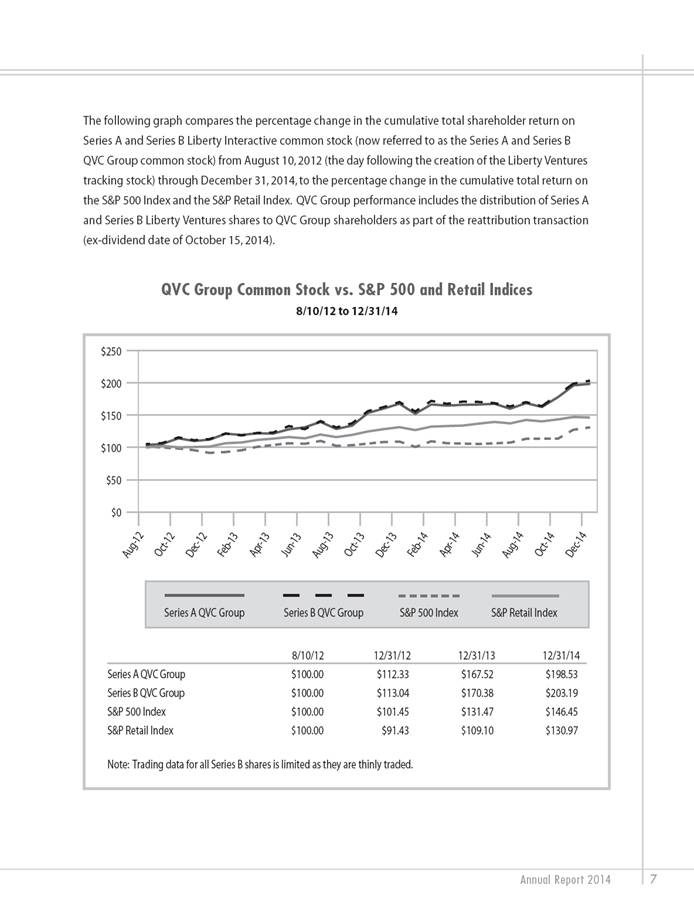
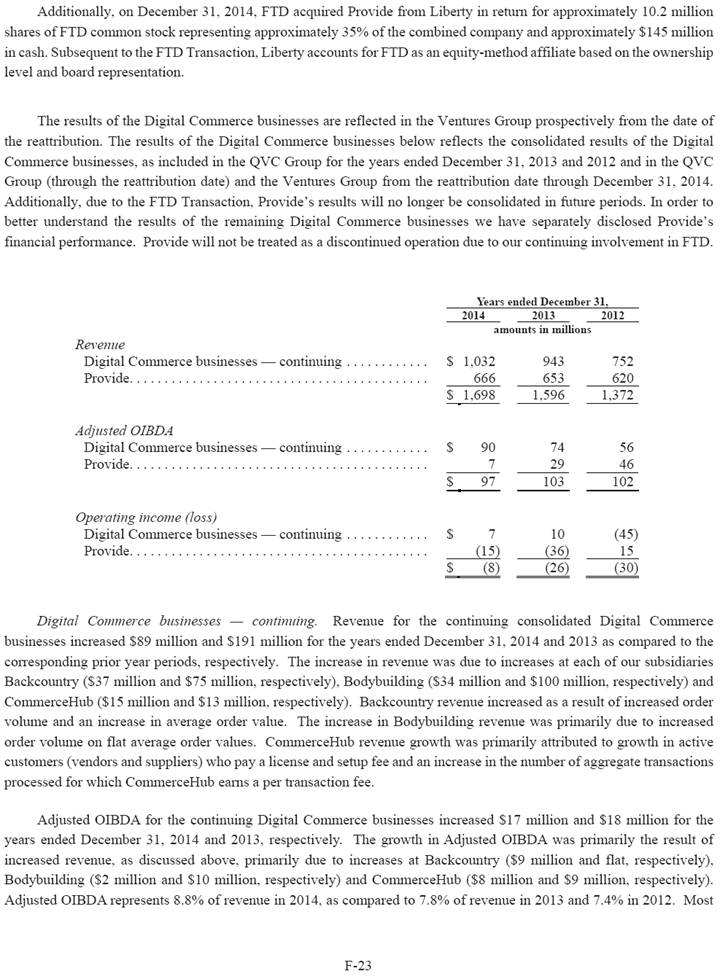
Annual Report 2014 7 The following graph compares the percentage change in the cumulative total shareholder return on Series A and Series B Liberty Interactive common stock (now referred to as the Series A and Series B QVC Group common stock) from August 10, 2012 (the day following the creation of the Liberty Ventures tracking stock) through December 31, 2014, to the percentage change in the cumulative total return on the S&P 500 Index and the S&P Retail Index. QVC Group performance includes the distribution of Series A and Series B Liberty Ventures shares to QVC Group shareholders as part of the reattribution transaction (ex-dividend date of October 15, 2014). QVC Group Common Stock vs. S&P 500 and Retail Indices 8/10/12 to 12/31/14 Series A QVC Group Series B QVC Group S&P 500 Index S&P Retail Index 8/10/12 12/31/12 12/31/13 12/31/14 Series A QVC Group $100.00 $112.33 $167.52 $198.53 Series B QVC Group $100.00 $113.04 $170.38 $203.19 S&P 500 Index $100.00 $101.45 $131.47 $146.45 S&P Retail Index $100.00 $91.43 $109.10 $130.97 Note: Trading data for all Series B shares is limited as they are thinly traded. $250 $200 $150 $100 $50 $0 Aug-12 Oct-12 Dec-12 Feb-13 Apr-13 Jun-13 Aug-13 Oct-13 Dec-13 Feb-14 Apr-14 Jun-14 Aug-14 Oct-14 Dec-14 |
|
|
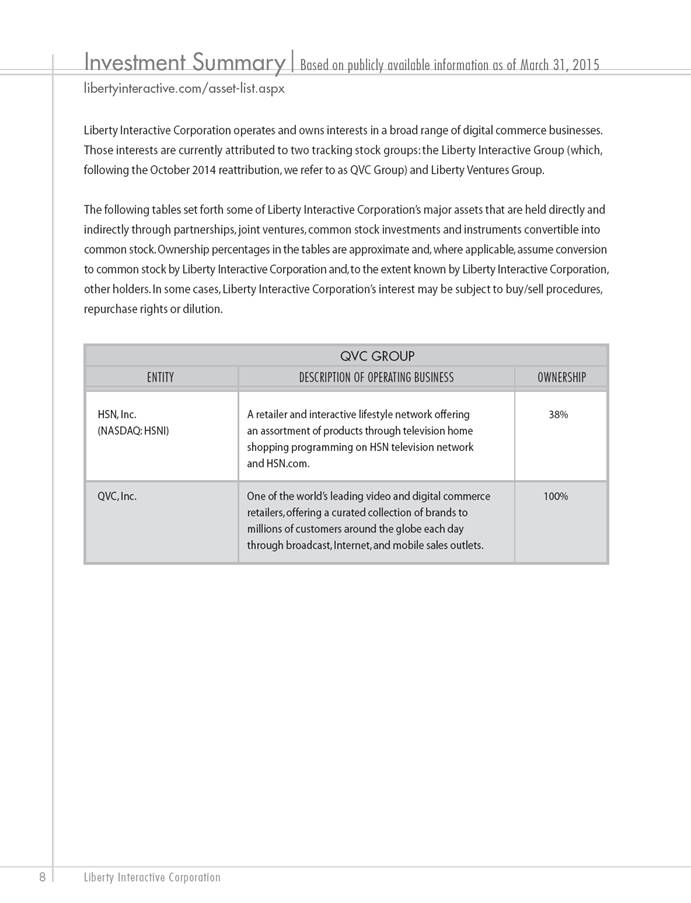
Liberty Interactive Corporation 8 Liberty Interactive Corporation operates and owns interests in a broad range of digital commerce businesses. Those interests are currently attributed to two tracking stock groups: the Liberty Interactive Group (which, following the October 2014 reattribution, we refer to as QVC Group) and Liberty Ventures Group. The following tables set forth some of Liberty Interactive Corporation’s major assets that are held directly and indirectly through partnerships, joint ventures, common stock investments and instruments convertible into common stock. Ownership percentages in the tables are approximate and, where applicable, assume conversion to common stock by Liberty Interactive Corporation and, to the extent known by Liberty Interactive Corporation, other holders. In some cases, Liberty Interactive Corporation’s interest may be subject to buy/sell procedures, repurchase rights or dilution. investment Summary | Based on publicly available information as of March 31, 2015 libertyinteractive.com/asset-list.aspx ENTITY DESCRIPTION OF OPERATING BUSINESS OWNERSHIP HSN, Inc. A retailer and interactive lifestyle network offering 38% (NASDAQ: HSNI) an assortment of products through television home shopping programming on HSN television network and HSN.com. QVC, Inc. One of the world’s leading video and digital commerce 100% retailers, offering a curated collection of brands to millions of customers around the globe each day through broadcast, Internet, and mobile sales outlets. QVC group |
|
|
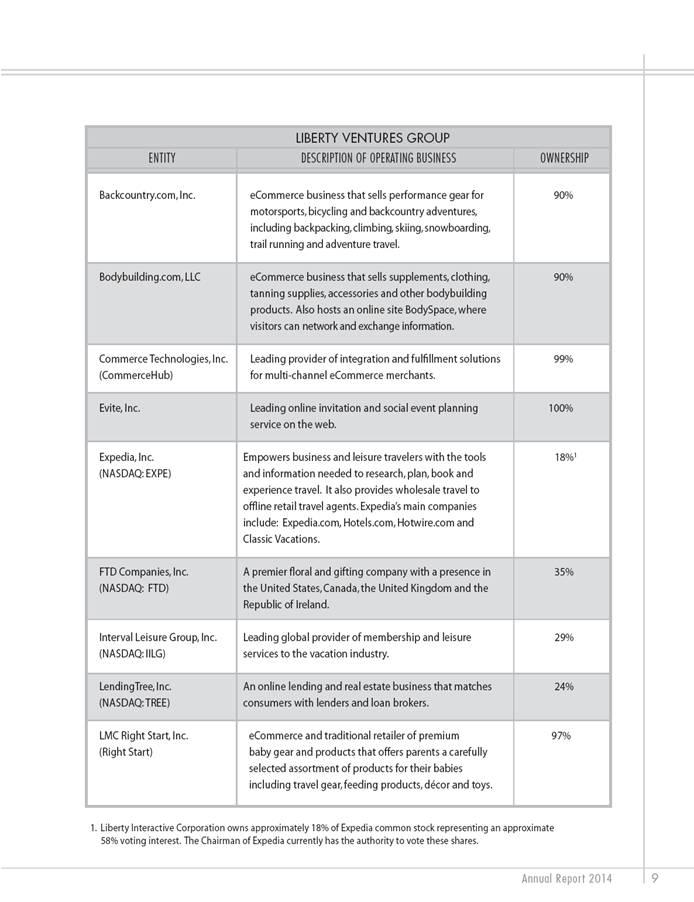
Annual Report 2014 ENTITY DESCRIPTION OF OPERATING BUSINESS OWNERSHIP Backcountry.com, Inc. eCommerce business that sells performance gear for 90% motorsports, bicycling and backcountry adventures, including backpacking, climbing, skiing, snowboarding, trail running and adventure travel. Bodybuilding.com, LLC eCommerce business that sells supplements, clothing, 90% tanning supplies, accessories and other bodybuilding products. Also hosts an online site BodySpace, where visitors can network and exchange information. Commerce Technologies, Inc. Leading provider of integration and fulfillment solutions 99% (CommerceHub) for multi-channel eCommerce merchants. Evite, Inc. Leading online invitation and social event planning 100% service on the web. Expedia, Inc. Empowers business and leisure travelers with the tools 18%1 (NASDAQ: EXPE) and information needed to research, plan, book and experience travel. It also provides wholesale travel to offline retail travel agents. Expedia’s main companies include: Expedia.com, Hotels.com, Hotwire.com and Classic Vacations. FTD Companies, Inc. A premier floral and gifting company with a presence in 35% (NASDAQ: FTD) the United States, Canada, the United Kingdom and the Republic of Ireland. Interval Leisure Group, Inc. Leading global provider of membership and leisure 29% (NASDAQ: IILG) services to the vacation industry. LendingTree, Inc. An online lending and real estate business that matches 24% (NASDAQ: TREE) consumers with lenders and loan brokers. LMC Right Start, Inc. eCommerce and traditional retailer of premium 97% (Right Start) baby gear and products that offers parents a carefully selected assortment of products for their babies including travel gear, feeding products, décor and toys. Liberty VentureS group 9 1. Liberty Interactive Corporation owns approximately 18% of Expedia common stock representing an approximate 58% voting interest. The Chairman of Expedia currently has the authority to vote these shares. |
|
|
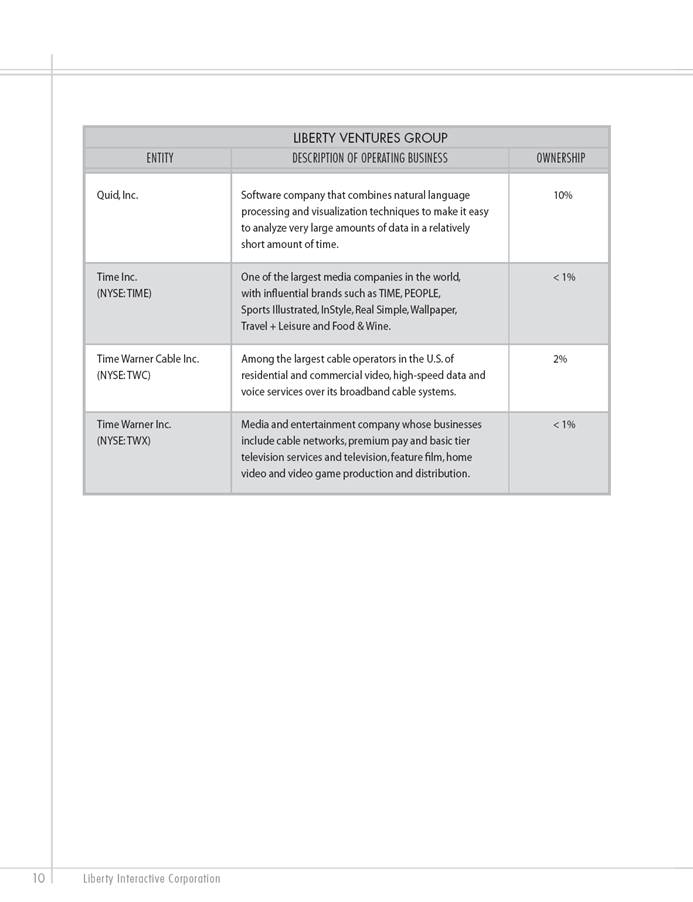
Liberty Interactive Corporation ENTITY DESCRIPTION OF OPERATING BUSINESS OWNERSHIP Quid, Inc. Software company that combines natural language 10% processing and visualization techniques to make it easy to analyze very large amounts of data in a relatively short amount of time. Time Inc. One of the largest media companies in the world, < 1% (NYSE: TIME) with influential brands such as TIME, PEOPLE, Sports Illustrated, InStyle, Real Simple, Wallpaper, Travel + Leisure and Food & Wine. Time Warner Cable Inc. Among the largest cable operators in the U.S. of 2% (NYSE: TWC) residential and commercial video, high-speed data and voice services over its broadband cable systems. Time Warner Inc. Media and entertainment company whose businesses < 1% (NYSE: TWX) include cable networks, premium pay and basic tier television services and television, feature film, home video and video game production and distribution. Liberty VentureS group 10 |
|
|
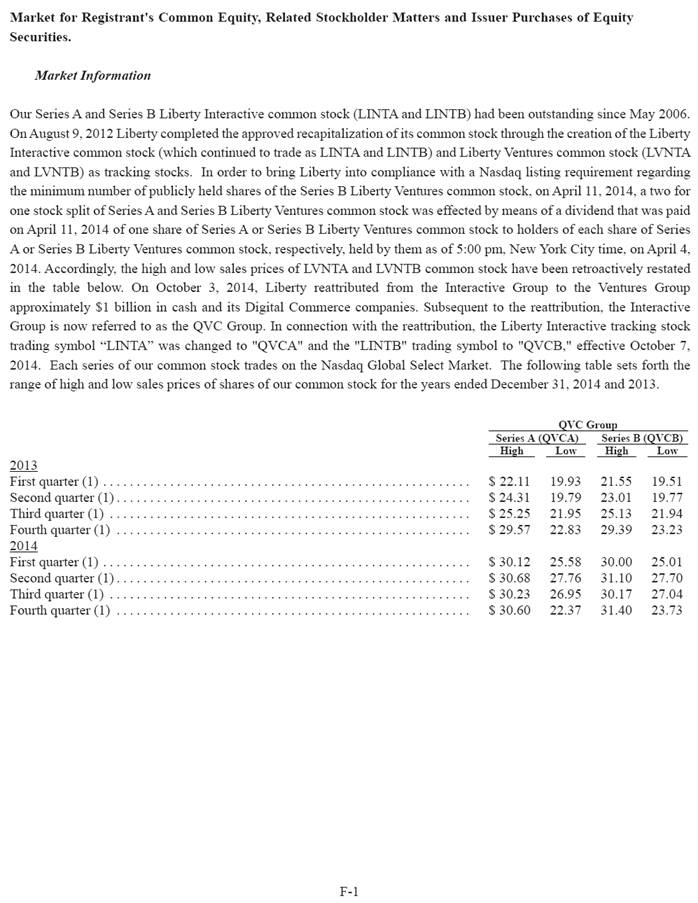
Market for Registrant's Common Equity, Related Stockholder Matters and Issuer Purchases of Equity Securities. Market Information Our Series A and Series B Liberty Interactive common stock (LINTA and LINTB) had been outstanding since May 2006. On August 9, 2012 Liberty completed the approved recapitalization of its common stock through the creation of the Liberty Interactive common stock (which continued to trade as LINTA and LINTB) and Liberty Ventures common stock (LVNTA and LVNTB) as tracking stocks. In order to bring Liberty into compliance with a Nasdaq listing requirement regarding the minimum number of publicly held shares of the Series B Liberty Ventures common stock, on April 11, 2014, a two for one stock split of Series A and Series B Liberty Ventures common stock was effected by means of a dividend that was paid on April 11, 2014 of one share of Series A or Series B Liberty Ventures common stock to holders of each share of Series A or Series B Liberty Ventures common stock, respectively, held by them as of 5:00 pm, New York City time, on April 4, 2014. Accordingly, the high and low sales prices of LVNTA and LVNTB common stock have been retroactively restated in the table below. On October 3, 2014, Liberty reattributed from the Interactive Group to the Ventures Group approximately $1 billion in cash and its Digital Commerce companies. Subsequent to the reattribution, the Interactive Group is now referred to as the QVC Group. In connection with the reattribution, the Liberty Interactive tracking stock trading symbol “LINTA” was changed to "QVCA" and the "LINTB" trading symbol to "QVCB," effective October 7, 2014. Each series of our common stock trades on the Nasdaq Global Select Market. The following table sets forth the range of high and low sales prices of shares of our common stock for the years ended December 31, 2014 and 2013. QVC Group Series A (QVCA) Series B (QVCB) High Low High Low 2013 First quarter (1) . . . . . . . . . . . . . . . . . . . . . . . . . . . . . . . . . . . . . . . . . . . . . . . . . . . . . . . $ 22.11 19.93 21.55 19.51 Second quarter (1) . . . . . . . . . . . . . . . . . . . . . . . . . . . . . . . . . . . . . . . . . . . . . . . . . . . . . $ 24.31 19.79 23.01 19.77 Third quarter (1) . . . . . . . . . . . . . . . . . . . . . . . . . . . . . . . . . . . . . . . . . . . . . . . . . . . . . . $ 25.25 21.95 25.13 21.94 Fourth quarter (1) . . . . . . . . . . . . . . . . . . . . . . . . . . . . . . . . . . . . . . . . . . . . . . . . . . . . . $ 29.57 22.83 29.39 23.23 2014 First quarter (1) . . . . . . . . . . . . . . . . . . . . . . . . . . . . . . . . . . . . . . . . . . . . . . . . . . . . . . . $ 30.12 25.58 30.00 25.01 Second quarter (1) . . . . . . . . . . . . . . . . . . . . . . . . . . . . . . . . . . . . . . . . . . . . . . . . . . . . . $ 30.68 27.76 31.10 27.70 Third quarter (1) . . . . . . . . . . . . . . . . . . . . . . . . . . . . . . . . . . . . . . . . . . . . . . . . . . . . . . $ 30.23 26.95 30.17 27.04 Fourth quarter (1) . . . . . . . . . . . . . . . . . . . . . . . . . . . . . . . . . . . . . . . . . . . . . . . . . . . . . $ 30.60 22.37 31.40 23.73 F-1 |
|
|
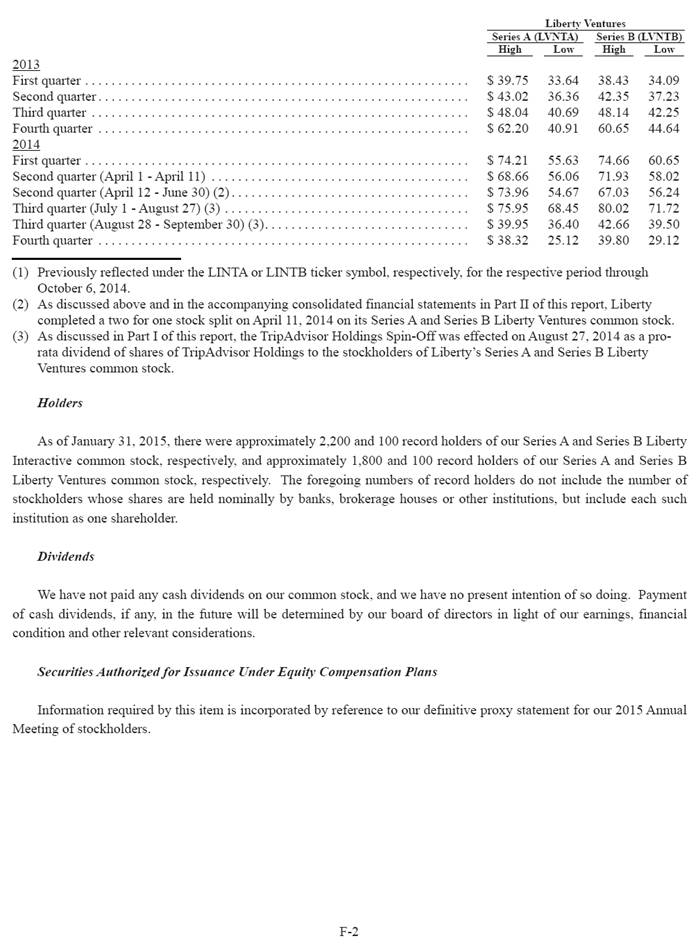
Liberty Ventures Series A (LVNTA) Series B (LVNTB) High Low High Low 2013 First quarter . . . . . . . . . . . . . . . . . . . . . . . . . . . . . . . . . . . . . . . . . . . . . . . . . . . . . . . . . . $ 39.75 33.64 38.43 34.09 Second quarter . . . . . . . . . . . . . . . . . . . . . . . . . . . . . . . . . . . . . . . . . . . . . . . . . . . . . . . . $ 43.02 36.36 42.35 37.23 Third quarter . . . . . . . . . . . . . . . . . . . . . . . . . . . . . . . . . . . . . . . . . . . . . . . . . . . . . . . . . $ 48.04 40.69 48.14 42.25 Fourth quarter . . . . . . . . . . . . . . . . . . . . . . . . . . . . . . . . . . . . . . . . . . . . . . . . . . . . . . . . $ 62.20 40.91 60.65 44.64 2014 First quarter . . . . . . . . . . . . . . . . . . . . . . . . . . . . . . . . . . . . . . . . . . . . . . . . . . . . . . . . . . $ 74.21 55.63 74.66 60.65 Second quarter (April 1 - April 11) . . . . . . . . . . . . . . . . . . . . . . . . . . . . . . . . . . . . . . . $ 68.66 56.06 71.93 58.02 Second quarter (April 12 - June 30) (2) . . . . . . . . . . . . . . . . . . . . . . . . . . . . . . . . . . . . $ 73.96 54.67 67.03 56.24 Third quarter (July 1 - August 27) (3) . . . . . . . . . . . . . . . . . . . . . . . . . . . . . . . . . . . . . $ 75.95 68.45 80.02 71.72 Third quarter (August 28 - September 30) (3) . . . . . . . . . . . . . . . . . . . . . . . . . . . . . . . $ 39.95 36.40 42.66 39.50 Fourth quarter . . . . . . . . . . . . . . . . . . . . . . . . . . . . . . . . . . . . . . . . . . . . . . . . . . . . . . . . $ 38.32 25.12 39.80 29.12 (1) Previously reflected under the LINTA or LINTB ticker symbol, respectively, for the respective period through October 6, 2014. (2) As discussed above and in the accompanying consolidated financial statements in Part II of this report, Liberty completed a two for one stock split on April 11, 2014 on its Series A and Series B Liberty Ventures common stock. (3) As discussed in Part I of this report, the TripAdvisor Holdings Spin-Off was effected on August 27, 2014 as a prorata dividend of shares of TripAdvisor Holdings to the stockholders of Liberty’s Series A and Series B Liberty Ventures common stock. Holders As of January 31, 2015, there were approximately 2,200 and 100 record holders of our Series A and Series B Liberty Interactive common stock, respectively, and approximately 1,800 and 100 record holders of our Series A and Series B Liberty Ventures common stock, respectively. The foregoing numbers of record holders do not include the number of stockholders whose shares are held nominally by banks, brokerage houses or other institutions, but include each such institution as one shareholder. Dividends We have not paid any cash dividends on our common stock, and we have no present intention of so doing. Payment of cash dividends, if any, in the future will be determined by our board of directors in light of our earnings, financial condition and other relevant considerations. Securities Authorized for Issuance Under Equity Compensation Plans Information required by this item is incorporated by reference to our definitive proxy statement for our 2015 Annual Meeting of stockholders. F-2 |
|
|
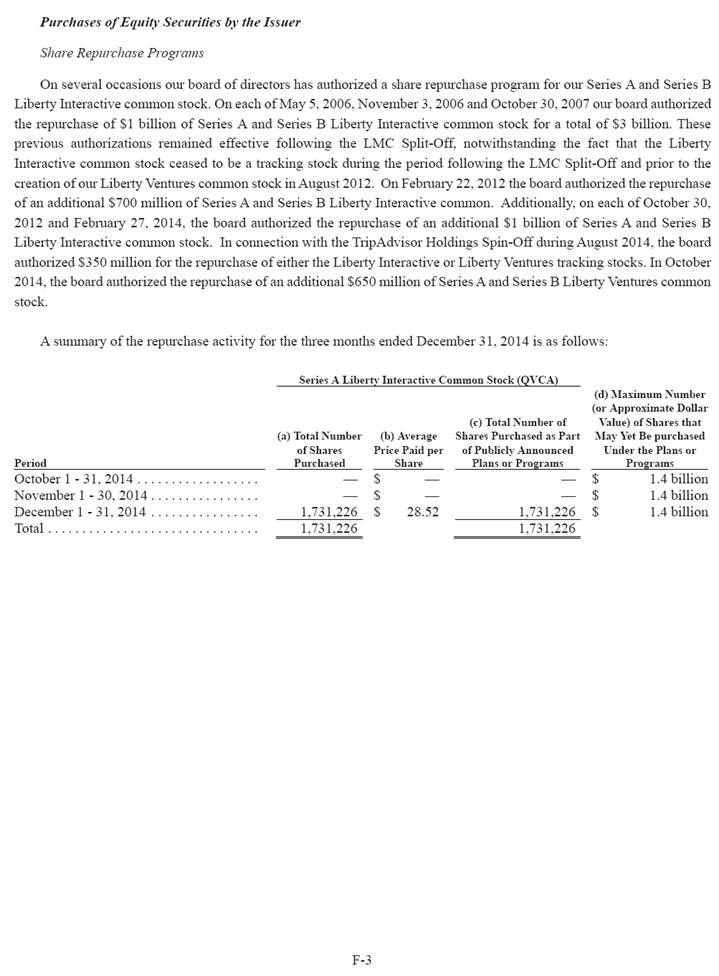
Purchases of Equity Securities by the Issuer Share Repurchase Programs On several occasions our board of directors has authorized a share repurchase program for our Series A and Series B Liberty Interactive common stock. On each of May 5, 2006, November 3, 2006 and October 30, 2007 our board authorized the repurchase of $1 billion of Series A and Series B Liberty Interactive common stock for a total of $3 billion. These previous authorizations remained effective following the LMC Split-Off, notwithstanding the fact that the Liberty Interactive common stock ceased to be a tracking stock during the period following the LMC Split-Off and prior to the creation of our Liberty Ventures common stock in August 2012. On February 22, 2012 the board authorized the repurchase of an additional $700 million of Series A and Series B Liberty Interactive common. Additionally, on each of October 30, 2012 and February 27, 2014, the board authorized the repurchase of an additional $1 billion of Series A and Series B Liberty Interactive common stock. In connection with the TripAdvisor Holdings Spin-Off during August 2014, the board authorized $350 million for the repurchase of either the Liberty Interactive or Liberty Ventures tracking stocks. In October 2014, the board authorized the repurchase of an additional $650 million of Series A and Series B Liberty Ventures common stock. A summary of the repurchase activity for the three months ended December 31, 2014 is as follows: Series A Liberty Interactive Common Stock (QVCA) (d) Maximum Number (or Approximate Dollar (c) Total Number of Value) of Shares that (a) Total Number (b) Average Shares Purchased as Part May Yet Be purchased of Shares Price Paid per of Publicly Announced Under the Plans or Period Purchased Share Plans or Programs Programs October 1 - 31, 2014 . . . . . . . . . . . . . . . . . . — $ — — $ 1.4 billion November 1 - 30, 2014 . . . . . . . . . . . . . . . . — $ — — $ 1.4 billion December 1 - 31, 2014 . . . . . . . . . . . . . . . . 1,731,226 $ 28.52 1,731,226 $ 1.4 billion Total . . . . . . . . . . . . . . . . . . . . . . . . . . . . . . . 1,731,226 1,731,226 F-3 |
|
|
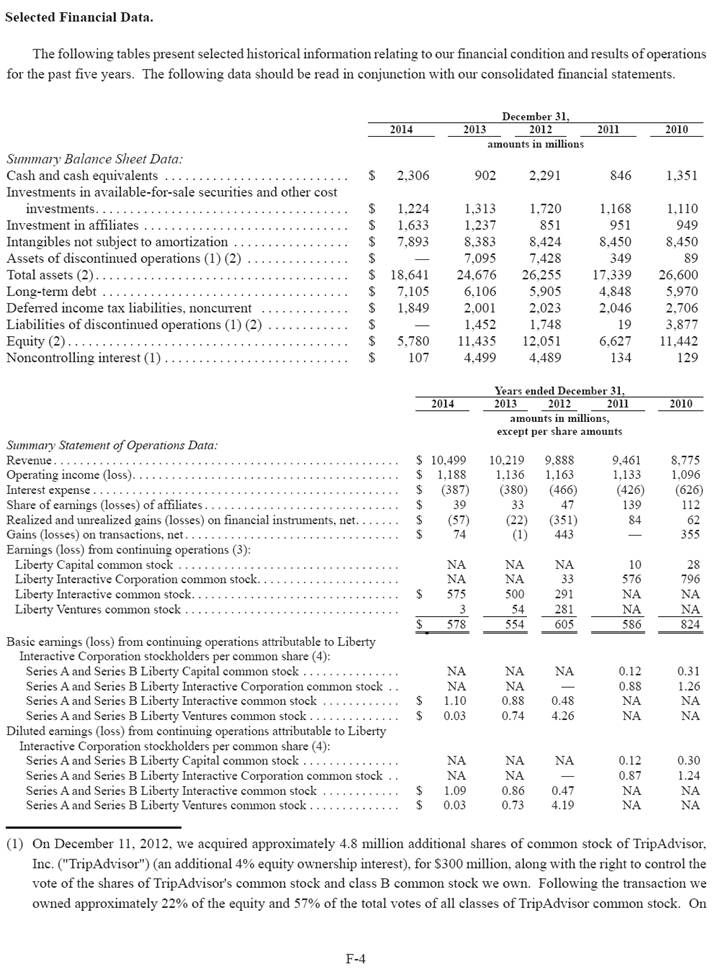
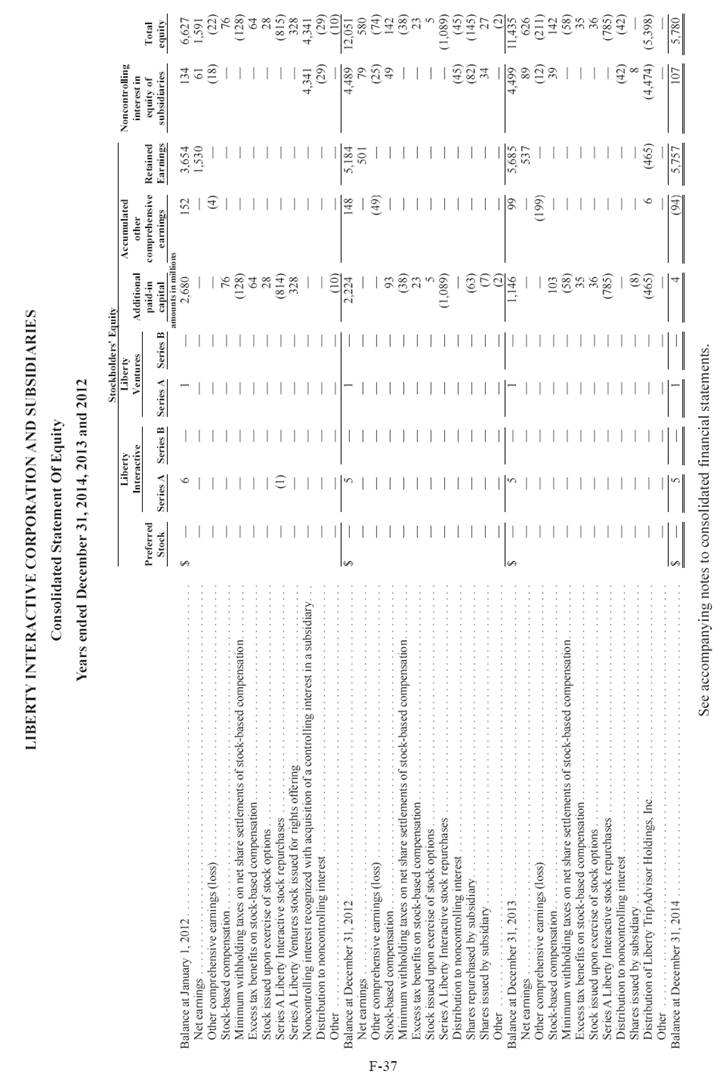
Selected Financial Data. The following tables present selected historical information relating to our financial condition and results of operations for the past five years. The following data should be read in conjunction with our consolidated financial statements. December 31, 2014 2013 2012 2011 2010 amounts in millions Summary Balance Sheet Data: Cash and cash equivalents . . . . . . . . . . . . . . . . . . . . . . . . . . . $ 2,306 902 2,291 846 1,351 Investments in available-for-sale securities and other cost investments . . . . . . . . . . . . . . . . . . . . . . . . . . . . . . . . . . . . . $ 1,224 1,313 1,720 1,168 1,110 Investment in affiliates . . . . . . . . . . . . . . . . . . . . . . . . . . . . . . $ 1,633 1,237 851 951 949 Intangibles not subject to amortization . . . . . . . . . . . . . . . . . $ 7,893 8,383 8,424 8,450 8,450 Assets of discontinued operations (1) (2) . . . . . . . . . . . . . . . $ — 7,095 7,428 349 89 Total assets (2) . . . . . . . . . . . . . . . . . . . . . . . . . . . . . . . . . . . . . $ 18,641 24,676 26,255 17,339 26,600 Long-term debt . . . . . . . . . . . . . . . . . . . . . . . . . . . . . . . . . . . . $ 7,105 6,106 5,905 4,848 5,970 Deferred income tax liabilities, noncurrent . . . . . . . . . . . . . $ 1,849 2,001 2,023 2,046 2,706 Liabilities of discontinued operations (1) (2) . . . . . . . . . . . . $ — 1,452 1,748 19 3,877 Equity (2) . . . . . . . . . . . . . . . . . . . . . . . . . . . . . . . . . . . . . . . . . $ 5,780 11,435 12,051 6,627 11,442 Noncontrolling interest (1) . . . . . . . . . . . . . . . . . . . . . . . . . . . $ 107 4,499 4,489 134 129 Years ended December 31, 2014 2013 2012 2011 2010 amounts in millions, except per share amounts Summary Statement of Operations Data: Revenue . . . . . . . . . . . . . . . . . . . . . . . . . . . . . . . . . . . . . . . . . . . . . . . . . . . . . $ 10,499 10,219 9,888 9,461 8,775 Operating income (loss) . . . . . . . . . . . . . . . . . . . . . . . . . . . . . . . . . . . . . . . . . $ 1,188 1,136 1,163 1,133 1,096 Interest expense . . . . . . . . . . . . . . . . . . . . . . . . . . . . . . . . . . . . . . . . . . . . . . . $ (387) (380) (466) (426) (626) Share of earnings (losses) of affiliates . . . . . . . . . . . . . . . . . . . . . . . . . . . . . . $ 39 33 47 139 112 Realized and unrealized gains (losses) on financial instruments, net . . . . . . . $ (57) (22) (351) 84 62 Gains (losses) on transactions, net . . . . . . . . . . . . . . . . . . . . . . . . . . . . . . . . . $ 74 (1) 443 — 355 Earnings (loss) from continuing operations (3): Liberty Capital common stock . . . . . . . . . . . . . . . . . . . . . . . . . . . . . . . . . . NA NA NA 10 28 Liberty Interactive Corporation common stock . . . . . . . . . . . . . . . . . . . . . . NA NA 33 576 796 Liberty Interactive common stock . . . . . . . . . . . . . . . . . . . . . . . . . . . . . . . . $ 575 500 291 NA NA Liberty Ventures common stock . . . . . . . . . . . . . . . . . . . . . . . . . . . . . . . . . 3 54 281 NA NA $ 578 554 605 586 824 Basic earnings (loss) from continuing operations attributable to Liberty Interactive Corporation stockholders per common share (4): Series A and Series B Liberty Capital common stock . . . . . . . . . . . . . . . NA NA NA 0.12 0.31 Series A and Series B Liberty Interactive Corporation common stock . . NA NA — 0.88 1.26 Series A and Series B Liberty Interactive common stock . . . . . . . . . . . . $ 1.10 0.88 0.48 NA NA Series A and Series B Liberty Ventures common stock . . . . . . . . . . . . . . $ 0.03 0.74 4.26 NA NA Diluted earnings (loss) from continuing operations attributable to Liberty Interactive Corporation stockholders per common share (4): Series A and Series B Liberty Capital common stock . . . . . . . . . . . . . . . NA NA NA 0.12 0.30 Series A and Series B Liberty Interactive Corporation common stock . . NA NA — 0.87 1.24 Series A and Series B Liberty Interactive common stock . . . . . . . . . . . . $ 1.09 0.86 0.47 NA NA Series A and Series B Liberty Ventures common stock . . . . . . . . . . . . . . $ 0.03 0.73 4.19 NA NA (1) On December 11, 2012, we acquired approximately 4.8 million additional shares of common stock of TripAdvisor, Inc. ("TripAdvisor") (an additional 4% equity ownership interest), for $300 million, along with the right to control the vote of the shares of TripAdvisor's common stock and class B common stock we own. Following the transaction we owned approximately 22% of the equity and 57% of the total votes of all classes of TripAdvisor common stock. On F-4 |
|
|
August 27, 2014, we completed the TripAdvisor Holdings Spin-Off. TripAdvisor Holdings is comprised of Liberty’s former interest in TripAdvisor as well as BuySeasons, Inc., Liberty’s former wholly-owned subsidiary, and corporate level debt. Following the completion of the TripAdvisor Holdings Spin-Off, Liberty and TripAdvisor Holdings operate as separate, publicly traded companies, and neither has any stock ownership, beneficial or otherwise, in the other. The consolidated financial statements of Liberty have been prepared to reflect TripAdvisor Holdings as discontinued operations. However, noncontrolling interest attributable to our former ownership interest in TripAdvisor is included in the noncontrolling interest line item in the consolidated balance sheet from the date of acquisition until the date of completion of the TripAdvisor Holdings Spin-Off. See note 5 of the accompanying consolidated financial statements for further details on the TripAdvisor Holdings Spin-Off. (2) On September 23, 2011, Liberty completed the LMC Split-Off. At the time of the LMC Split-Off, LMC owned all the assets, businesses and liabilities previously attributed to the Capital and Starz tracking stock groups. The LMC Split-Off was effected by means of a redemption of all of the Liberty Capital common stock and Liberty Starz common stock of Liberty in exchange for the common stock of LMC. (3) Includes earnings (losses) from continuing operations attributable to the noncontrolling interests of $40 million, $45 million, $63 million, $53 million and $45 million for the years ended December 31, 2014, 2013, 2012, 2011 and 2010, respectively. (4) Basic and diluted earnings per share have been calculated for Liberty Capital and Liberty Starz common stock for the period subsequent to March 3, 2008 through September 23, 2011. Basic and diluted EPS have been calculated for Liberty Interactive Corporation common stock for the periods from May 9, 2006 to August 9, 2012. Basic and diluted EPS have been calculated for Liberty Interactive common stock and Liberty Ventures common stock subsequent to August 9, 2012. F-5 |
|
|
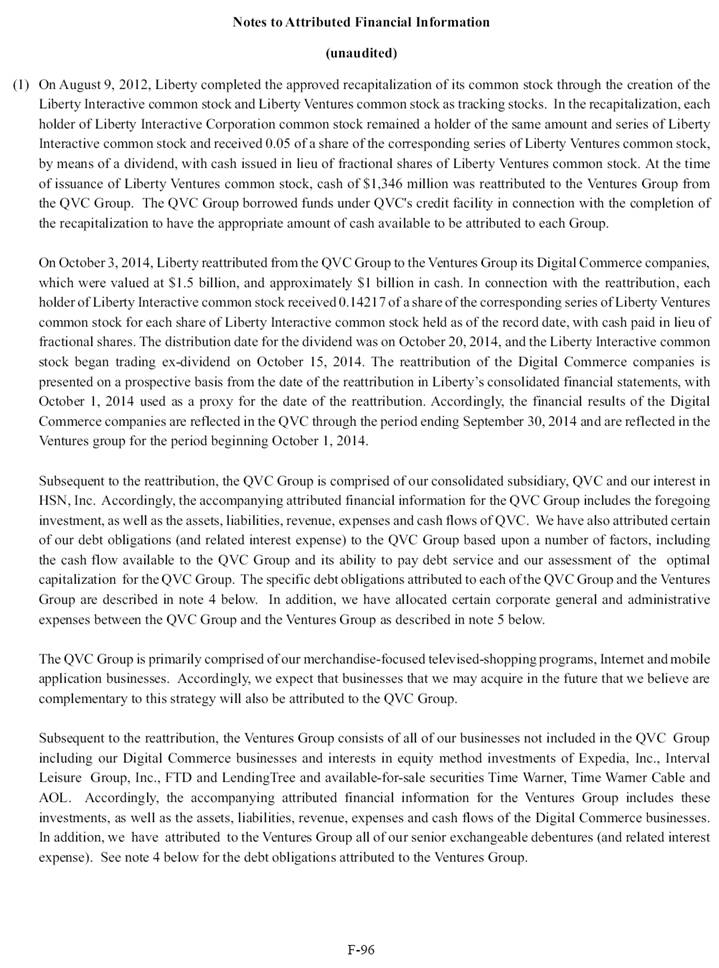
Management's Discussion and Analysis of Financial Condition and Results of Operations The following discussion and analysis provides information concerning our results of operations and financial condition. This discussion should be read in conjunction with our accompanying consolidated financial statements and the notes thereto. Overview We own controlling and non-controlling interests in a broad range of video and on-line commerce companies. Our largest business, which is also our principal reportable segment, is QVC, Inc. (“QVC”). QVC markets and sells a wide variety of consumer products in the United States and several foreign countries, primarily by means of its televised shopping programs and via the Internet through its domestic and international websites and mobile applications. Additionally, we own entire or majority interests in consolidated subsidiaries which operate on-line commerce businesses in a broad range of retail categories. These include Backcountry.com, Inc. ("Backcountry"), Bodybuilding.com, LLC ("Bodybuilding"), CommerceHub, Provide Commerce, Inc. ("Provide") (see discussion below), Evite, Inc. (“Evite”) and LMC Right Start, Inc. (“Right Start”) (collectively, the “Digital Commerce” businesses). Backcountry operates websites offering sports gear and clothing for outdoor and active individuals in a variety of categories. Bodybuilding manages websites related to sports nutrition, body building and fitness. CommerceHub provides a Software-as-a-Service platform for online retailers and their suppliers (manufacturers, and distributors) to sell products to consumers without physically owning inventory, or managing the fulfillment of those products. Provide operates an e-commerce marketplace of websites for perishable goods, including flowers, fruits and desserts, as well as upscale personalized gifts. On December 31, 2014, FTD Companies, Inc. ("FTD") acquired Provide from Liberty in return for approximately 10.2 million shares of FTD common stock representing approximately 35% of the combined company and approximately $145 million in cash (the “FTD Transaction”). Subsequent to the FTD Transaction, Liberty accounts for FTD as an equity-method affiliate based on the ownership level and board representation. Evite is an online invitation and social event planning service on the Web. Right Start is a retailer of products for infants through toddlers such as quality strollers, car seats, nursery and feeding accessories, plus care and other products. Our "Corporate and Other" category includes our corporate ownership interests in unconsolidated businesses and corporate expenses. We hold ownership interests in Expedia, Inc., HSN, Inc., Interval Leisure Group, Inc. and LendingTree, which we account for as equity method investments; and we continue to maintain investments and related financial instruments in public companies such as Time Warner Inc. and Time Warner Cable Inc., which are accounted for at their respective fair market values and are included in "Corporate and Other." On August 9, 2012, Liberty completed the approved recapitalization of its common stock through the creation of the Liberty Interactive common stock and Liberty Ventures common stock as tracking stocks. In the recapitalization, each holder of Liberty Interactive Corporation common stock remained a holder of the same amount and series of Liberty Interactive common stock and received 0.05 of a share of the corresponding series of Liberty Ventures common stock, by means of a dividend, with cash issued in lieu of fractional shares of Liberty Ventures common stock. On October 3, 2014, Liberty reattributed from the QVC Group to the Ventures Group its Digital Commerce companies, which were valued at $1.5 billion, and approximately $1 billion in cash. In connection with the reattribution, each holder of Liberty Interactive common stock received 0.14217 of a share of the corresponding series of Liberty Ventures common stock for each share of Liberty Interactive common stock held as of the record date, with cash paid in lieu of fractional shares. The distribution date for the dividend was on October 20, 2014, and the Liberty Interactive common stock began trading ex-dividend on October 15, 2014 which resulted in an aggregate of 67.7 million shares of Series A and Series B Liberty Ventures common stock being issued. F-6 |
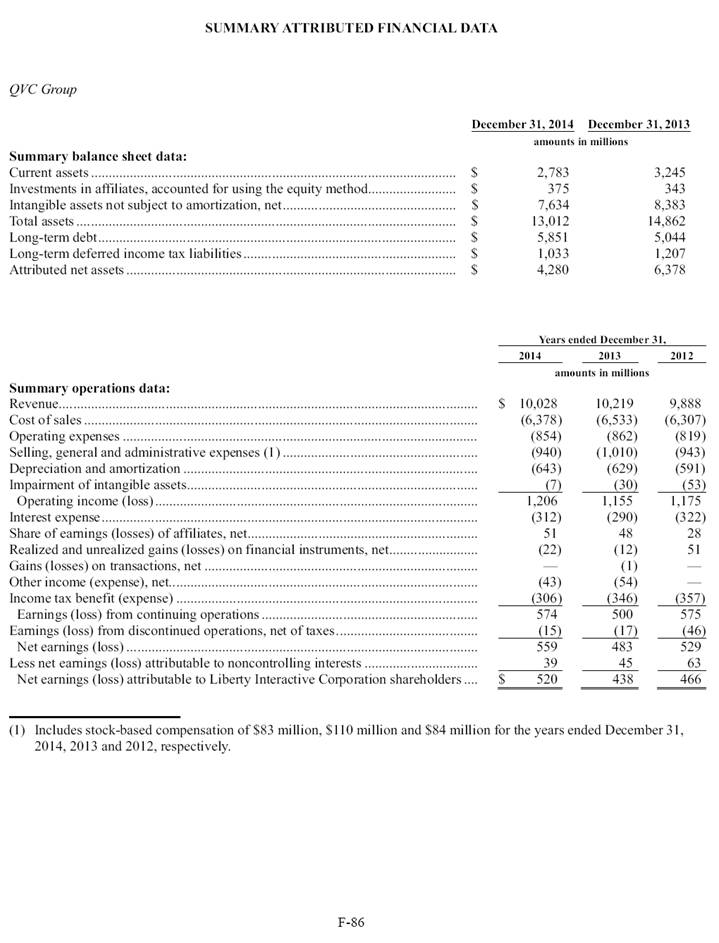
|
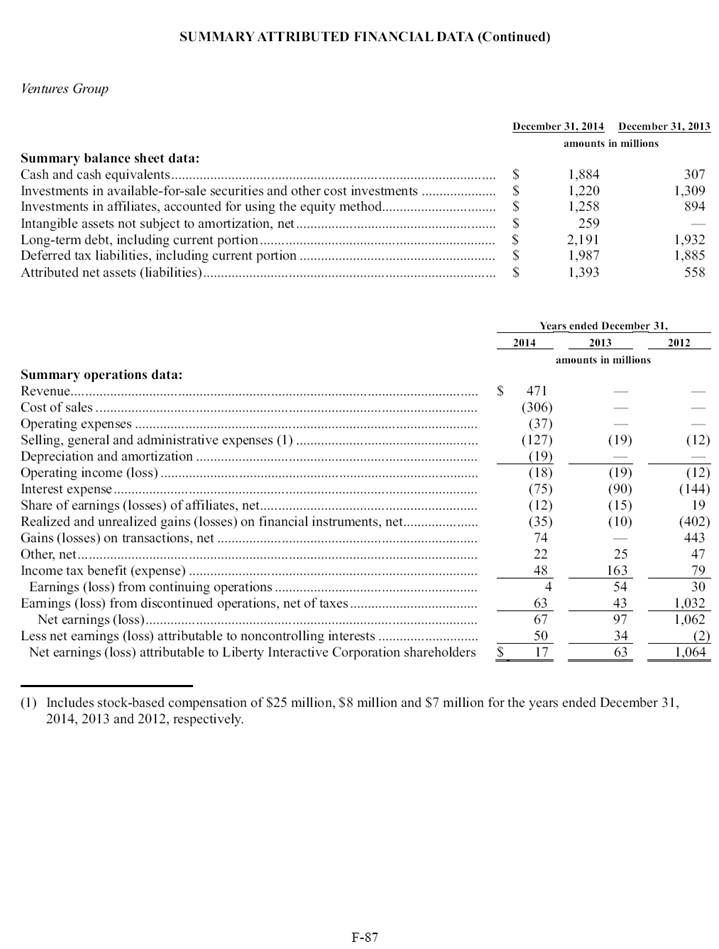
|
The term "Ventures Group" does not represent a separate legal entity, rather it represents those businesses, assets and liabilities that have been attributed to that group. Following the reattribution, the Ventures Group is comprised primarily of our interests in Expedia, Inc., Interval Leisure Group, Inc., LendingTree, our Digital Commerce companies, investments in Time Warner Inc. and Time Warner Cable Inc., as well as cash in the amount of approximately $1,884 million (at December 31, 2014), including subsidiary cash. The Ventures Group also has attributed to it certain liabilities related to our Exchangeable Debentures and certain deferred tax liabilities. The Ventures Group is primarily focused on the maximization of the value of these investments and investing in new business opportunities. The term "QVC Group" does not represent a separate legal entity, rather it represents those businesses, assets and liabilities that have been attributed to that group. The QVC Group is primarily focused on our video operating businesses. Following the reattribution, the QVC Group has attributed to it the remainder of our businesses and assets, including our wholly-owned subsidiary QVC and our 38% interest in HSN, Inc. as well as cash in the amount of approximately $422 million (at December 31, 2014), including subsidiary cash. Discontinued Operations On August 27, 2014, Liberty completed the TripAdvisor Holdings Spin-Off. TripAdvisor Holdings is comprised of Liberty’s former 22% economic and 57% voting interest in TripAdvisor as well as BuySeasons, Liberty’s former whollyowned subsidiary, and a corporate level net debt balance of $350 million. In connection with the TripAdvisor Holdings Spin-Off during August 2014, TripAdvisor Holdings drew down $400 million in margin loans and distributed approximately $350 million to Liberty. This transaction has been recorded at historical cost due to the pro rata nature of the distribution. Following the completion of the TripAdvisor Holdings Spin-Off, Liberty and TripAdvisor Holdings operate as separate, publicly traded companies, and neither has any stock ownership, beneficial or otherwise, in the other. The consolidated financial statements of Liberty have been prepared to reflect TripAdvisor Holdings as discontinued operations. Accordingly, the assets and liabilities, revenue, costs and expenses, and cash flows of the businesses, assets and liabilities owned by TripAdvisor Holdings at the time of the TripAdvisor Holdings Spin-Off have been excluded from the respective captions in the accompanying consolidated balance sheets, statements of operations, comprehensive earnings and cash flows in such consolidated financial statements. Strategies and Challenges QVC. QVC's goal is to become the preeminent global multimedia shopping community for people who love to shop, and to offer a shopping experience that is as much about entertainment and enrichment as it is about buying. QVC's objective is to provide an integrated shopping experience that utilizes all forms of media including television, the internet and mobile devices. In 2015, QVC intends to employ several strategies to achieve these goals and objectives. Among these strategies are to (i) extend the breadth, relevance and exposure of the QVC brand; (ii) source products that represent unique quality and value; (iii) create engaging presentation content in televised programming, mobile and online; (iv) leverage customer loyalty and continue multi-platform expansion; and (v) create a compelling and differentiated customer experience. In addition, QVC expects to expand globally by leveraging its existing systems, infrastructure and skills in other countries around the world. Internationally, beyond the main QVC channels, QVC-Germany and QVC-U.K also broadcast pre-recorded shows on additional channels that offer viewers access to a broader range of QVC programming options. These channels include QVC Beauty & Style and QVC Plus in Germany and QVC Beauty, QVC Extra and QVC Style in the U.K. QVC's future net revenue growth will primarily depend on international expansion, sales growth from e-commerce and mobile platforms, additions of new customers from households already receiving QVC's television programming and increased spending from existing customers. QVC's future net revenue may also be affected by (i) the willingness of cable F-7 |
|
|
television and direct-to-home satellite system operators to continue carrying QVC's programming service; (ii) QVC's ability to maintain favorable channel positioning, which may become more difficult due to governmental action or from distributors converting analog customers to digital; (iii) changes in television viewing habits because of personal video recorders, video-on-demand and internet video services; and (iv) general economic conditions. The prolonged economic uncertainty in various regions of the world in which our subsidiaries and affiliates operate could adversely affect demand for QVC’s products and services since a substantial portion of QVC’s revenue is derived from discretionary spending by individuals, which typically falls during times of economic instability. Global financial markets continue to experience disruptions, including increased volatility and diminished liquidity and credit availability. If economic and financial market conditions in the U.S. or other key markets, including Europe and Japan, remain uncertain, persist, or deteriorate further, QVC’s customers may respond by suspending, delaying, or reducing their discretionary spending. A suspension, delay or reduction in discretionary spending could adversely affect revenue. Accordingly, QVC’s ability to increase or maintain revenue and earnings could be adversely affected to the extent that relevant economic environments remain weak or decline. Such weak economic conditions may also inhibit QVC’s expansion into new European and other markets. QVC is currently unable to predict the extent of any of these potential adverse effects. F-8 |
|
|
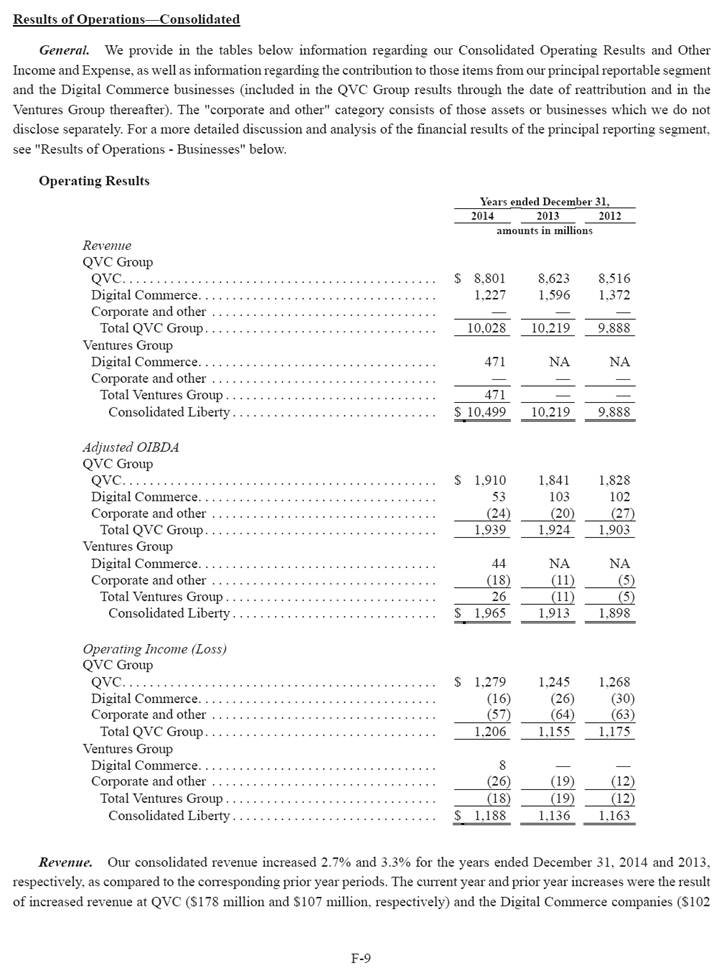
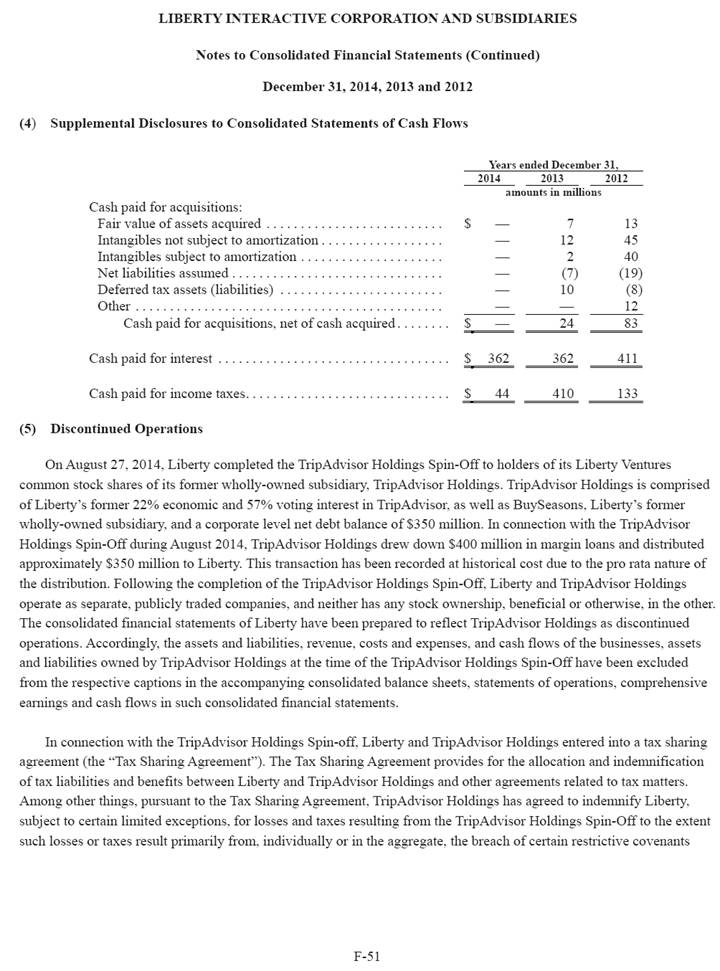
Results of Operations—Consolidated General. We provide in the tables below information regarding our Consolidated Operating Results and Other Income and Expense, as well as information regarding the contribution to those items from our principal reportable segment and the Digital Commerce businesses (included in the QVC Group results through the date of reattribution and in the Ventures Group thereafter). The "corporate and other" category consists of those assets or businesses which we do not disclose separately. For a more detailed discussion and analysis of the financial results of the principal reporting segment, see "Results of Operations - Businesses" below. Operating Results Years ended December 31, 2014 2013 2012 amounts in millions Revenue QVC Group QVC . . . . . . . . . . . . . . . . . . . . . . . . . . . . . . . . . . . . . . . . . . . . . . $ 8,801 8,623 8,516 Digital Commerce . . . . . . . . . . . . . . . . . . . . . . . . . . . . . . . . . . . 1,227 1,596 1,372 Corporate and other . . . . . . . . . . . . . . . . . . . . . . . . . . . . . . . . . — — — Total QVC Group . . . . . . . . . . . . . . . . . . . . . . . . . . . . . . . . . . 10,028 10,219 9,888 Ventures Group Digital Commerce . . . . . . . . . . . . . . . . . . . . . . . . . . . . . . . . . . . 471 NA NA Corporate and other . . . . . . . . . . . . . . . . . . . . . . . . . . . . . . . . . — — — Total Ventures Group . . . . . . . . . . . . . . . . . . . . . . . . . . . . . . . 471 — — Consolidated Liberty . . . . . . . . . . . . . . . . . . . . . . . . . . . . . . $ 10,499 10,219 9,888 Adjusted OIBDA QVC Group QVC . . . . . . . . . . . . . . . . . . . . . . . . . . . . . . . . . . . . . . . . . . . . . . $ 1,910 1,841 1,828 Digital Commerce . . . . . . . . . . . . . . . . . . . . . . . . . . . . . . . . . . . 53 103 102 Corporate and other . . . . . . . . . . . . . . . . . . . . . . . . . . . . . . . . . (24) (20) (27) Total QVC Group . . . . . . . . . . . . . . . . . . . . . . . . . . . . . . . . . . 1,939 1,924 1,903 Ventures Group Digital Commerce . . . . . . . . . . . . . . . . . . . . . . . . . . . . . . . . . . . 44 NA NA Corporate and other . . . . . . . . . . . . . . . . . . . . . . . . . . . . . . . . . (18) (11) (5) Total Ventures Group . . . . . . . . . . . . . . . . . . . . . . . . . . . . . . . 26 (11) (5) Consolidated Liberty . . . . . . . . . . . . . . . . . . . . . . . . . . . . . . $ 1,965 1,913 1,898 Operating Income (Loss) QVC Group QVC . . . . . . . . . . . . . . . . . . . . . . . . . . . . . . . . . . . . . . . . . . . . . . $ 1,279 1,245 1,268 Digital Commerce . . . . . . . . . . . . . . . . . . . . . . . . . . . . . . . . . . . (16) (26) (30) Corporate and other . . . . . . . . . . . . . . . . . . . . . . . . . . . . . . . . . (57) (64) (63) Total QVC Group . . . . . . . . . . . . . . . . . . . . . . . . . . . . . . . . . . 1,206 1,155 1,175 Ventures Group Digital Commerce . . . . . . . . . . . . . . . . . . . . . . . . . . . . . . . . . . . 8 — — Corporate and other . . . . . . . . . . . . . . . . . . . . . . . . . . . . . . . . . (26) (19) (12) Total Ventures Group . . . . . . . . . . . . . . . . . . . . . . . . . . . . . . . (18) (19) (12) Consolidated Liberty . . . . . . . . . . . . . . . . . . . . . . . . . . . . . . $ 1,188 1,136 1,163 Revenue. Our consolidated revenue increased 2.7% and 3.3% for the years ended December 31, 2014 and 2013, respectively, as compared to the corresponding prior year periods. The current year and prior year increases were the result of increased revenue at QVC ($178 million and $107 million, respectively) and the Digital Commerce companies ($102 F-9 |
|
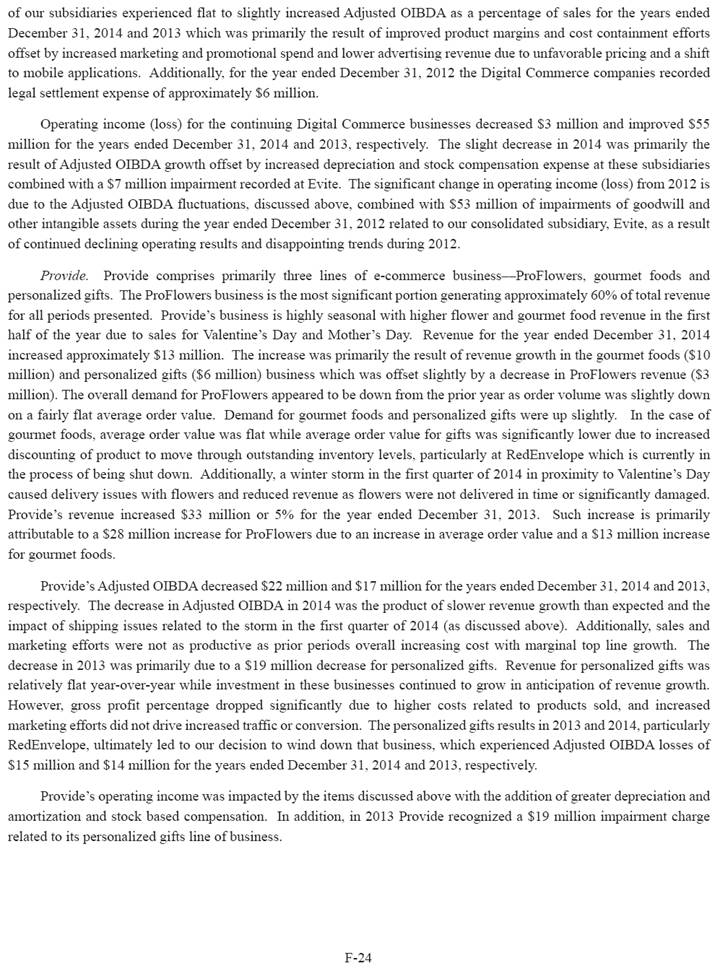
|
million and $224 million, respectively). See "Results of Operations – Businesses" below for a more complete discussion of the results of operations of certain of our subsidiaries. Adjusted OIBDA. We define Adjusted OIBDA as revenue less cost of sales, operating expenses and selling, general and administrative ("SG&A") expenses (excluding stock compensation). Our chief operating decision maker and management team use this measure of performance in conjunction with other measures to evaluate our businesses and make decisions about allocating resources among our businesses. We believe this is an important indicator of the operational strength and performance of our businesses, including each business's ability to service debt and fund capital expenditures. In addition, this measure allows us to view operating results, perform analytical comparisons and benchmarking between businesses and identify strategies to improve performance. This measure of performance excludes such costs as depreciation and amortization, stock-based compensation and restructuring and impairment charges that are included in the measurement of operating income pursuant to GAAP. Accordingly, Adjusted OIBDA should be considered in addition to, but not as a substitute for, operating income, net income, cash flow provided by operating activities and other measures of financial performance prepared in accordance with GAAP. See note 18 to the accompanying consolidated financial statements for a reconciliation of Adjusted OIBDA to earnings (loss) from continuing operations before income taxes. Consolidated Adjusted OIBDA increased $52 million and $15 million for the years ended December 31, 2014 and 2013, respectively, as compared to the corresponding prior year periods. See "Results of Operations – Businesses" below for a more complete discussion of the results of operations of certain of our subsidiaries. Stock-based compensation. Stock-based compensation includes compensation related to (1) options and stock appreciation rights ("SARs") for shares of our common stock that are granted to certain of our officers and employees, (2) phantom stock appreciation rights ("PSARs") granted to officers and employees of certain of our subsidiaries pursuant to private equity plans and (3) amortization of restricted stock grants. We recorded $108 million, $118 million and $91 million of stock compensation expense for the years ended December 31, 2014, 2013 and 2012, respectively. The decrease of $10 million in stock-based compensation during 2014 was primarily attributable to slightly fewer options being granted in recent years which resulted in less stock-based compensation expense being recognized. The increase of $27 million in stock-based compensation during 2013 was primarily attributable to the additional recognition of stock-based compensation related to the one-time exchange offer in 2012 ("2012 Option Exchange"), as more fully described in note 14, in the accompanying consolidated financial statements. As of December 31, 2014, the total unrecognized compensation cost related to unvested Liberty equity awards was approximately $80 million. Such amount will be recognized in our consolidated statements of operations over a weighted average period of approximately 2.0 years. Operating income. Our consolidated operating income increased $52 million and decreased $27 million for the years ended December 31, 2014 and 2013, respectively, as compared to the corresponding prior year periods. See "Results of Operations – Businesses" below for a more complete discussion of the results of operations of certain of our subsidiaries. F-10 |
|
|
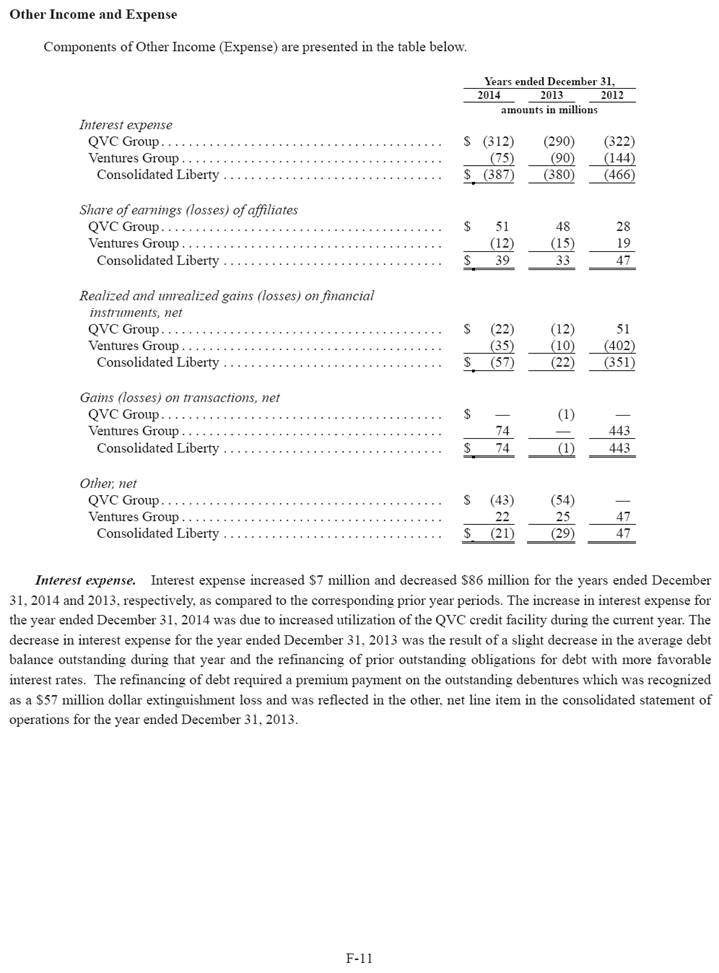
Other Income and Expense Components of Other Income (Expense) are presented in the table below. Years ended December 31, 2014 2013 2012 amounts in millions Interest expense QVC Group . . . . . . . . . . . . . . . . . . . . . . . . . . . . . . . . . . . . . . . . . $ (312) (290) (322) Ventures Group . . . . . . . . . . . . . . . . . . . . . . . . . . . . . . . . . . . . . . (75) (90) (144) Consolidated Liberty . . . . . . . . . . . . . . . . . . . . . . . . . . . . . . . . $ (387) (380) (466) Share of earnings (losses) of affiliates QVC Group . . . . . . . . . . . . . . . . . . . . . . . . . . . . . . . . . . . . . . . . . $ 51 48 28 Ventures Group . . . . . . . . . . . . . . . . . . . . . . . . . . . . . . . . . . . . . . (12) (15) 19 Consolidated Liberty . . . . . . . . . . . . . . . . . . . . . . . . . . . . . . . . $ 39 33 47 Realized and unrealized gains (losses) on financial instruments, net QVC Group . . . . . . . . . . . . . . . . . . . . . . . . . . . . . . . . . . . . . . . . . $ (22) (12) 51 Ventures Group . . . . . . . . . . . . . . . . . . . . . . . . . . . . . . . . . . . . . . (35) (10) (402) Consolidated Liberty . . . . . . . . . . . . . . . . . . . . . . . . . . . . . . . . $ (57) (22) (351) Gains (losses) on transactions, net QVC Group . . . . . . . . . . . . . . . . . . . . . . . . . . . . . . . . . . . . . . . . . $ — (1) — Ventures Group . . . . . . . . . . . . . . . . . . . . . . . . . . . . . . . . . . . . . . 74 — 443 Consolidated Liberty . . . . . . . . . . . . . . . . . . . . . . . . . . . . . . . . $ 74 (1) 443 Other, net QVC Group . . . . . . . . . . . . . . . . . . . . . . . . . . . . . . . . . . . . . . . . . $ (43) (54) — Ventures Group . . . . . . . . . . . . . . . . . . . . . . . . . . . . . . . . . . . . . . 22 25 47 Consolidated Liberty . . . . . . . . . . . . . . . . . . . . . . . . . . . . . . . . $ (21) (29) 47 Interest expense. Interest expense increased $7 million and decreased $86 million for the years ended December 31, 2014 and 2013, respectively, as compared to the corresponding prior year periods. The increase in interest expense for the year ended December 31, 2014 was due to increased utilization of the QVC credit facility during the current year. The decrease in interest expense for the year ended December 31, 2013 was the result of a slight decrease in the average debt balance outstanding during that year and the refinancing of prior outstanding obligations for debt with more favorable interest rates. The refinancing of debt required a premium payment on the outstanding debentures which was recognized as a $57 million dollar extinguishment loss and was reflected in the other, net line item in the consolidated statement of operations for the year ended December 31, 2013. F-11 |
|
|
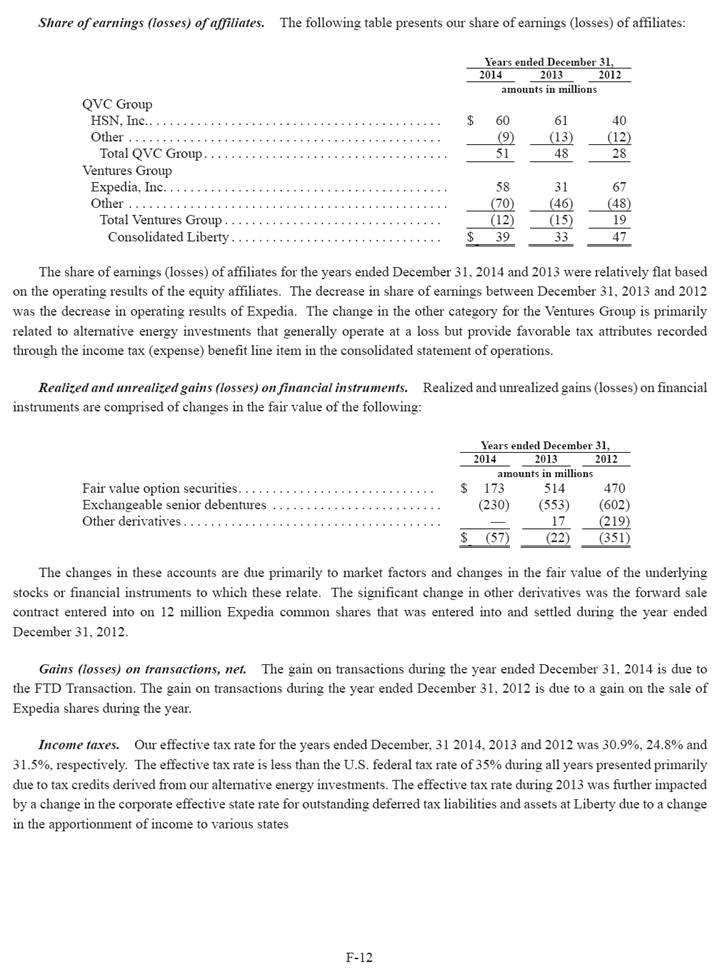
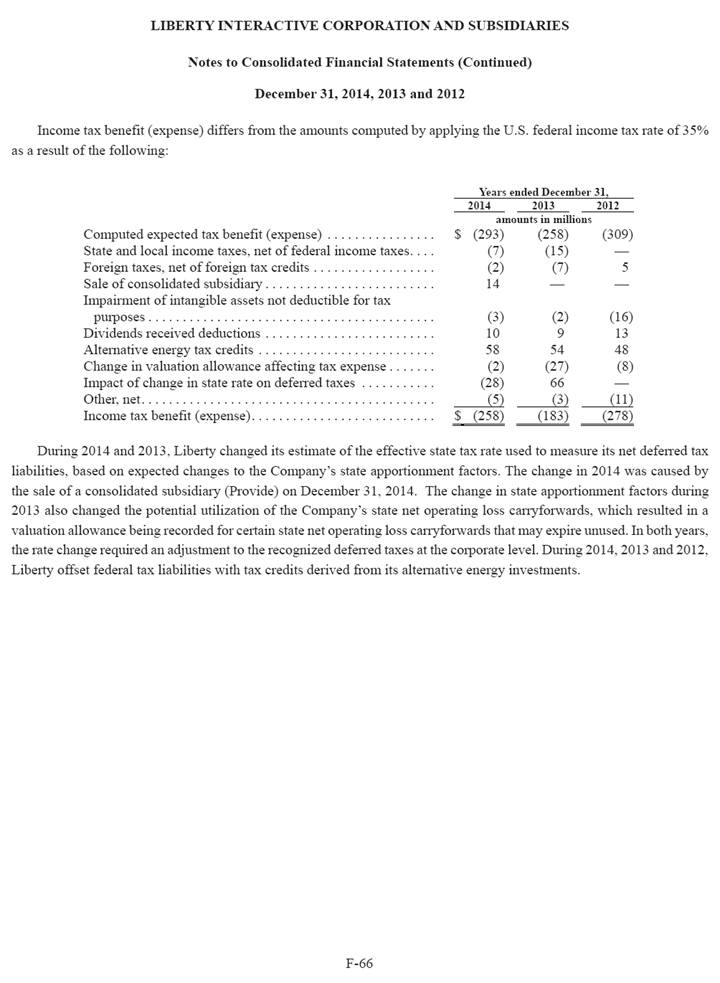
Share of earnings (losses) of affiliates. The following table presents our share of earnings (losses) of affiliates: Years ended December 31, 2014 2013 2012 amounts in millions QVC Group HSN, Inc. . . . . . . . . . . . . . . . . . . . . . . . . . . . . . . . . . . . . . . . . . . . $ 60 61 40 Other . . . . . . . . . . . . . . . . . . . . . . . . . . . . . . . . . . . . . . . . . . . . . . (9) (13) (12) Total QVC Group . . . . . . . . . . . . . . . . . . . . . . . . . . . . . . . . . . . . 51 48 28 Ventures Group Expedia, Inc. . . . . . . . . . . . . . . . . . . . . . . . . . . . . . . . . . . . . . . . . . 58 31 67 Other . . . . . . . . . . . . . . . . . . . . . . . . . . . . . . . . . . . . . . . . . . . . . . . (70) (46) (48) Total Ventures Group . . . . . . . . . . . . . . . . . . . . . . . . . . . . . . . . (12) (15) 19 Consolidated Liberty . . . . . . . . . . . . . . . . . . . . . . . . . . . . . . . $ 39 33 47 The share of earnings (losses) of affiliates for the years ended December 31, 2014 and 2013 were relatively flat based on the operating results of the equity affiliates. The decrease in share of earnings between December 31, 2013 and 2012 was the decrease in operating results of Expedia. The change in the other category for the Ventures Group is primarily related to alternative energy investments that generally operate at a loss but provide favorable tax attributes recorded through the income tax (expense) benefit line item in the consolidated statement of operations. Realized and unrealized gains (losses) on financial instruments. Realized and unrealized gains (losses) on financial instruments are comprised of changes in the fair value of the following: Years ended December 31, 2014 2013 2012 amounts in millions Fair value option securities . . . . . . . . . . . . . . . . . . . . . . . . . . . . . $ 173 514 470 Exchangeable senior debentures . . . . . . . . . . . . . . . . . . . . . . . . . (230) (553) (602) Other derivatives . . . . . . . . . . . . . . . . . . . . . . . . . . . . . . . . . . . . . . — 17 (219) $ (57) (22) (351) The changes in these accounts are due primarily to market factors and changes in the fair value of the underlying stocks or financial instruments to which these relate. The significant change in other derivatives was the forward sale contract entered into on 12 million Expedia common shares that was entered into and settled during the year ended December 31, 2012. Gains (losses) on transactions, net. The gain on transactions during the year ended December 31, 2014 is due to the FTD Transaction. The gain on transactions during the year ended December 31, 2012 is due to a gain on the sale of Expedia shares during the year. Income taxes. Our effective tax rate for the years ended December, 31 2014, 2013 and 2012 was 30.9%, 24.8% and 31.5%, respectively. The effective tax rate is less than the U.S. federal tax rate of 35% during all years presented primarily due to tax credits derived from our alternative energy investments. The effective tax rate during 2013 was further impacted by a change in the corporate effective state rate for outstanding deferred tax liabilities and assets at Liberty due to a change in the apportionment of income to various states F-12 |
|
|
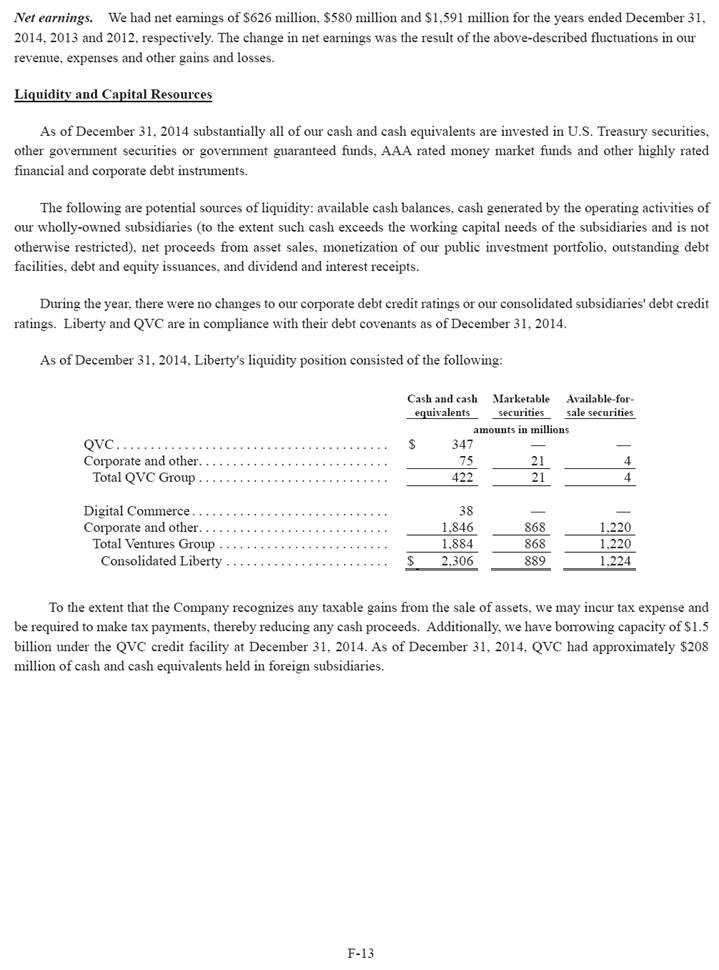
Net earnings. We had net earnings of $626 million, $580 million and $1,591 million for the years ended December 31, 2014, 2013 and 2012, respectively. The change in net earnings was the result of the above-described fluctuations in our revenue, expenses and other gains and losses. Liquidity and Capital Resources As of December 31, 2014 substantially all of our cash and cash equivalents are invested in U.S. Treasury securities, other government securities or government guaranteed funds, AAA rated money market funds and other highly rated financial and corporate debt instruments. The following are potential sources of liquidity: available cash balances, cash generated by the operating activities of our wholly-owned subsidiaries (to the extent such cash exceeds the working capital needs of the subsidiaries and is not otherwise restricted), net proceeds from asset sales, monetization of our public investment portfolio, outstanding debt facilities, debt and equity issuances, and dividend and interest receipts. During the year, there were no changes to our corporate debt credit ratings or our consolidated subsidiaries' debt credit ratings. Liberty and QVC are in compliance with their debt covenants as of December 31, 2014. As of December 31, 2014, Liberty's liquidity position consisted of the following: Cash and cash Marketable Available-forequivalents securities sale securities amounts in millions QVC . . . . . . . . . . . . . . . . . . . . . . . . . . . . . . . . . . . . . . . . $ 347 — — Corporate and other . . . . . . . . . . . . . . . . . . . . . . . . . . . . 75 21 4 Total QVC Group . . . . . . . . . . . . . . . . . . . . . . . . . . . . 422 21 4 Digital Commerce . . . . . . . . . . . . . . . . . . . . . . . . . . . . . 38 — — Corporate and other . . . . . . . . . . . . . . . . . . . . . . . . . . . . 1,846 868 1,220 Total Ventures Group . . . . . . . . . . . . . . . . . . . . . . . . . 1,884 868 1,220 Consolidated Liberty . . . . . . . . . . . . . . . . . . . . . . . . $ 2,306 889 1,224 To the extent that the Company recognizes any taxable gains from the sale of assets, we may incur tax expense and be required to make tax payments, thereby reducing any cash proceeds. Additionally, we have borrowing capacity of $1.5 billion under the QVC credit facility at December 31, 2014. As of December 31, 2014, QVC had approximately $208 million of cash and cash equivalents held in foreign subsidiaries. F-13 |
|
|
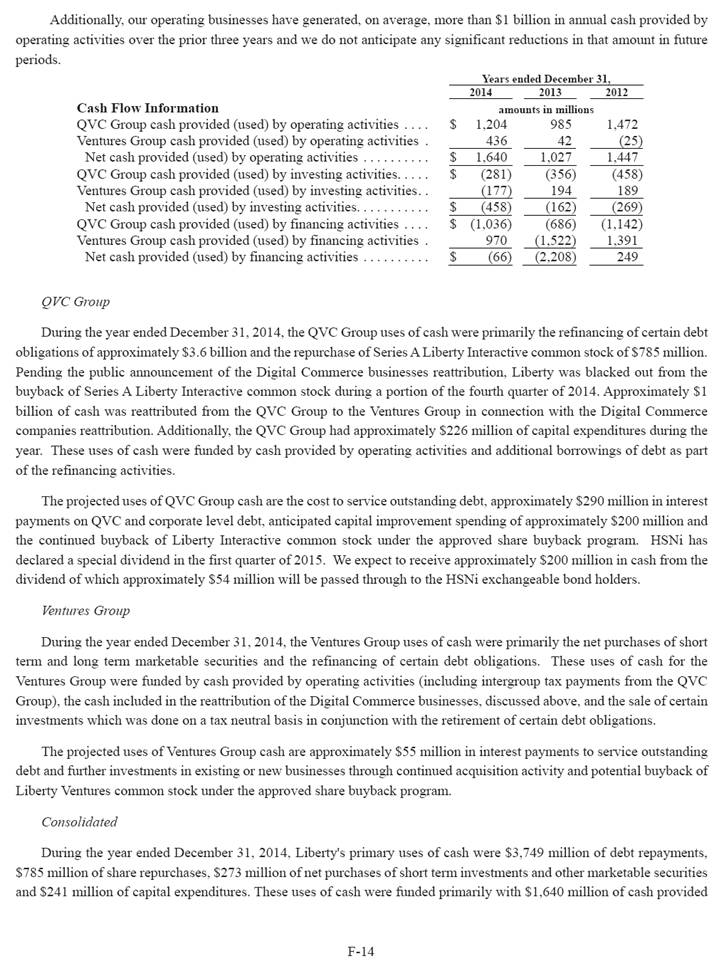
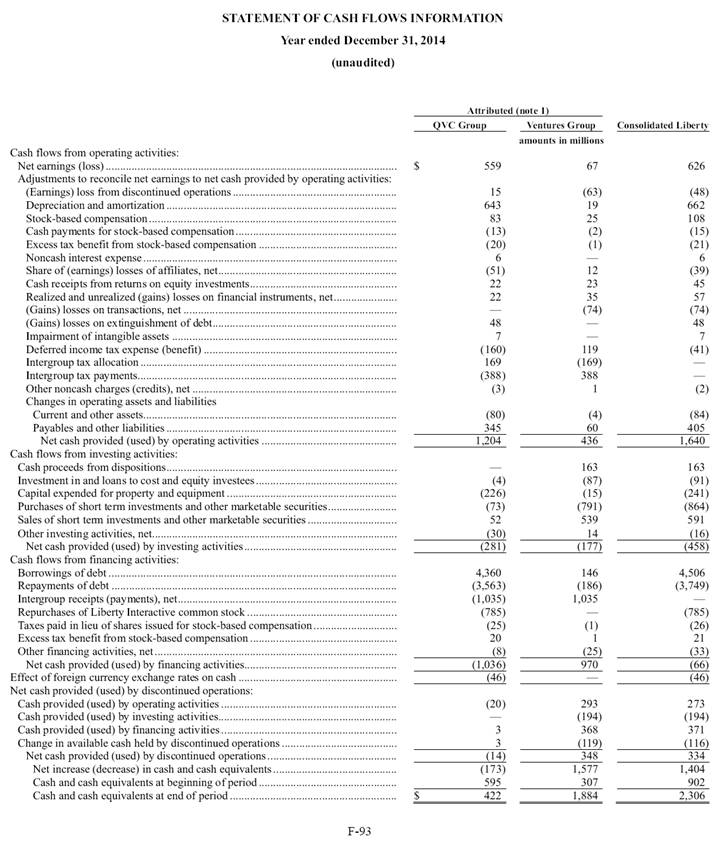
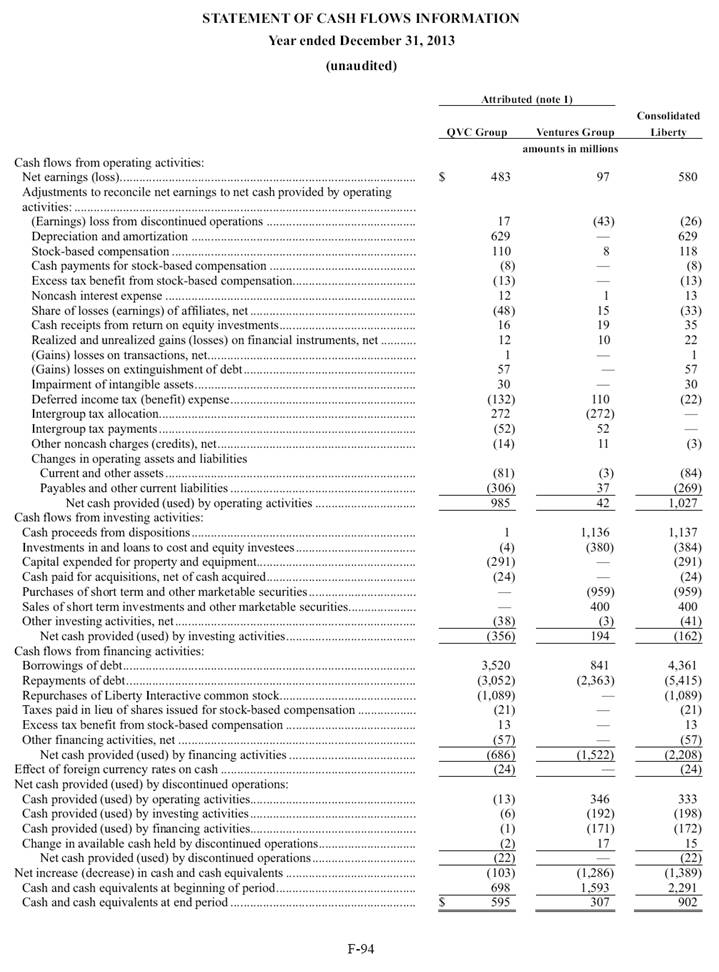
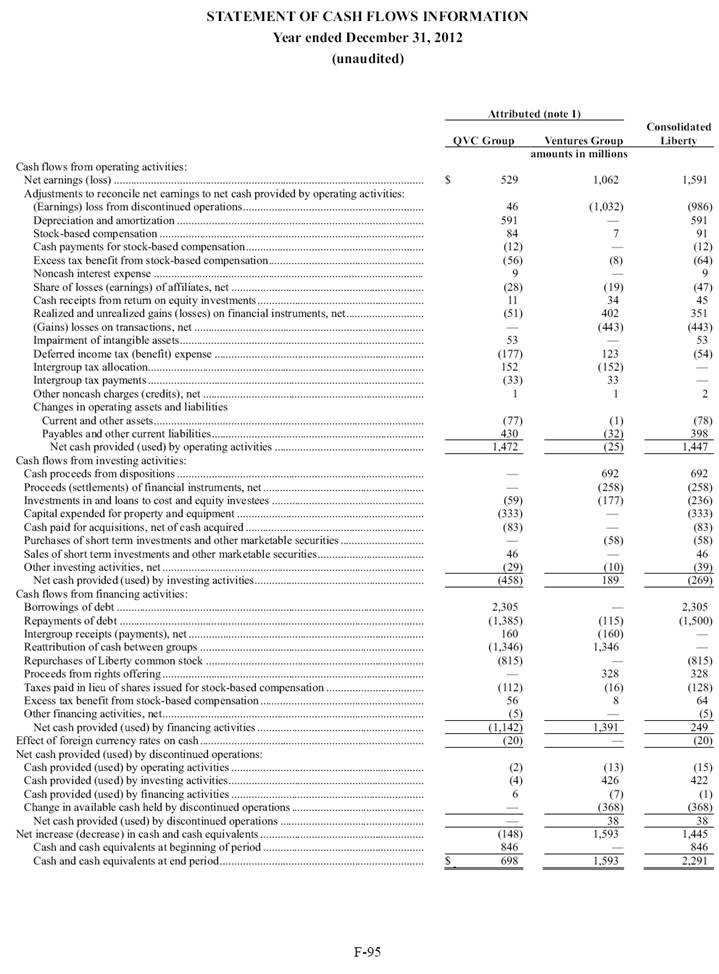
Additionally, our operating businesses have generated, on average, more than $1 billion in annual cash provided by operating activities over the prior three years and we do not anticipate any significant reductions in that amount in future periods. Years ended December 31, 2014 2013 2012 Cash Flow Information amounts in millions QVC Group cash provided (used) by operating activities . . . . $ 1,204 985 1,472 Ventures Group cash provided (used) by operating activities . 436 42 (25) Net cash provided (used) by operating activities . . . . . . . . . . $ 1,640 1,027 1,447 QVC Group cash provided (used) by investing activities . . . . . $ (281) (356) (458) Ventures Group cash provided (used) by investing activities . . (177) 194 189 Net cash provided (used) by investing activities. . . . . . . . . . . $ (458) (162) (269) QVC Group cash provided (used) by financing activities . . . . $ (1,036) (686) (1,142) Ventures Group cash provided (used) by financing activities . 970 (1,522) 1,391 Net cash provided (used) by financing activities . . . . . . . . . . $ (66) (2,208) 249 QVC Group During the year ended December 31, 2014, the QVC Group uses of cash were primarily the refinancing of certain debt obligations of approximately $3.6 billion and the repurchase of Series A Liberty Interactive common stock of $785 million. Pending the public announcement of the Digital Commerce businesses reattribution, Liberty was blacked out from the buyback of Series A Liberty Interactive common stock during a portion of the fourth quarter of 2014. Approximately $1 billion of cash was reattributed from the QVC Group to the Ventures Group in connection with the Digital Commerce companies reattribution. Additionally, the QVC Group had approximately $226 million of capital expenditures during the year. These uses of cash were funded by cash provided by operating activities and additional borrowings of debt as part of the refinancing activities. The projected uses of QVC Group cash are the cost to service outstanding debt, approximately $290 million in interest payments on QVC and corporate level debt, anticipated capital improvement spending of approximately $200 million and the continued buyback of Liberty Interactive common stock under the approved share buyback program. HSNi has declared a special dividend in the first quarter of 2015. We expect to receive approximately $200 million in cash from the dividend of which approximately $54 million will be passed through to the HSNi exchangeable bond holders. Ventures Group During the year ended December 31, 2014, the Ventures Group uses of cash were primarily the net purchases of short term and long term marketable securities and the refinancing of certain debt obligations. These uses of cash for the Ventures Group were funded by cash provided by operating activities (including intergroup tax payments from the QVC Group), the cash included in the reattribution of the Digital Commerce businesses, discussed above, and the sale of certain investments which was done on a tax neutral basis in conjunction with the retirement of certain debt obligations. The projected uses of Ventures Group cash are approximately $55 million in interest payments to service outstanding debt and further investments in existing or new businesses through continued acquisition activity and potential buyback of Liberty Ventures common stock under the approved share buyback program. Consolidated During the year ended December 31, 2014, Liberty's primary uses of cash were $3,749 million of debt repayments, $785 million of share repurchases, $273 million of net purchases of short term investments and other marketable securities and $241 million of capital expenditures. These uses of cash were funded primarily with $1,640 million of cash provided F-14 |
|
|
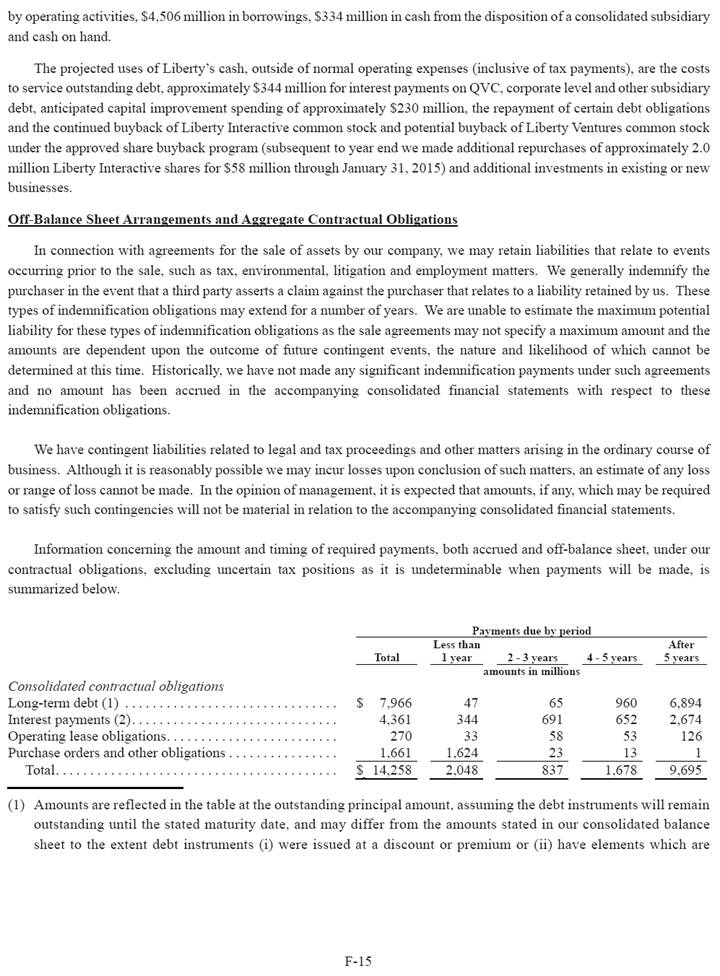
by operating activities, $4,506 million in borrowings, $334 million in cash from the disposition of a consolidated subsidiary and cash on hand. The projected uses of Liberty’s cash, outside of normal operating expenses (inclusive of tax payments), are the costs to service outstanding debt, approximately $344 million for interest payments on QVC, corporate level and other subsidiary debt, anticipated capital improvement spending of approximately $230 million, the repayment of certain debt obligations and the continued buyback of Liberty Interactive common stock and potential buyback of Liberty Ventures common stock under the approved share buyback program (subsequent to year end we made additional repurchases of approximately 2.0 million Liberty Interactive shares for $58 million through January 31, 2015) and additional investments in existing or new businesses. Off-Balance Sheet Arrangements and Aggregate Contractual Obligations In connection with agreements for the sale of assets by our company, we may retain liabilities that relate to events occurring prior to the sale, such as tax, environmental, litigation and employment matters. We generally indemnify the purchaser in the event that a third party asserts a claim against the purchaser that relates to a liability retained by us. These types of indemnification obligations may extend for a number of years. We are unable to estimate the maximum potential liability for these types of indemnification obligations as the sale agreements may not specify a maximum amount and the amounts are dependent upon the outcome of future contingent events, the nature and likelihood of which cannot be determined at this time. Historically, we have not made any significant indemnification payments under such agreements and no amount has been accrued in the accompanying consolidated financial statements with respect to these indemnification obligations. We have contingent liabilities related to legal and tax proceedings and other matters arising in the ordinary course of business. Although it is reasonably possible we may incur losses upon conclusion of such matters, an estimate of any loss or range of loss cannot be made. In the opinion of management, it is expected that amounts, if any, which may be required to satisfy such contingencies will not be material in relation to the accompanying consolidated financial statements. Information concerning the amount and timing of required payments, both accrued and off-balance sheet, under our contractual obligations, excluding uncertain tax positions as it is undeterminable when payments will be made, is summarized below. Payments due by period Less than After Total 1 year 2 - 3 years 4 - 5 years 5 years amounts in millions Consolidated contractual obligations Long-term debt (1) . . . . . . . . . . . . . . . . . . . . . . . . . . . . . . . $ 7,966 47 65 960 6,894 Interest payments (2) . . . . . . . . . . . . . . . . . . . . . . . . . . . . . . 4,361 344 691 652 2,674 Operating lease obligations . . . . . . . . . . . . . . . . . . . . . . . . . 270 33 58 53 126 Purchase orders and other obligations . . . . . . . . . . . . . . . . 1,661 1,624 23 13 1 Total . . . . . . . . . . . . . . . . . . . . . . . . . . . . . . . . . . . . . . . . . $ 14,258 2,048 837 1,678 9,695 (1) Amounts are reflected in the table at the outstanding principal amount, assuming the debt instruments will remain outstanding until the stated maturity date, and may differ from the amounts stated in our consolidated balance sheet to the extent debt instruments (i) were issued at a discount or premium or (ii) have elements which are F-15 |
|
|
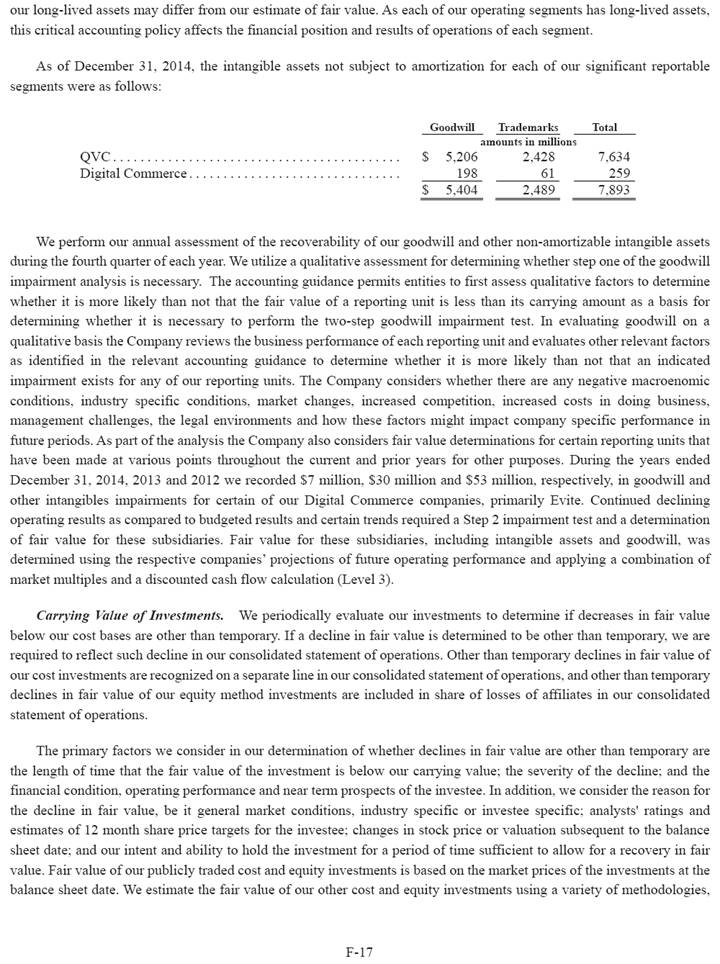
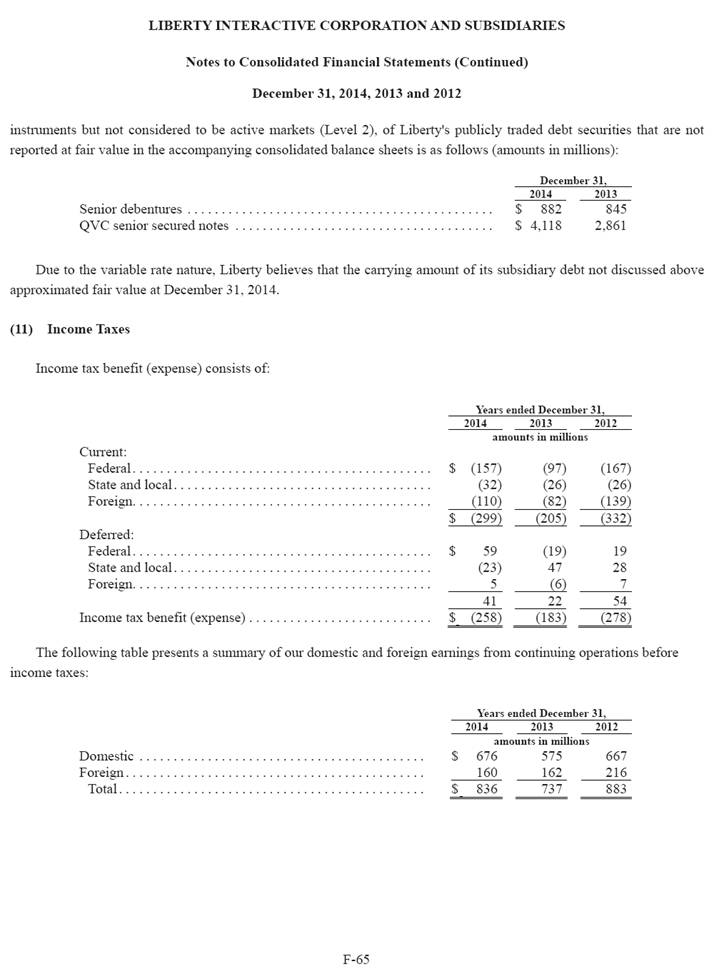
reported at fair value in our consolidated balance sheet. Amounts also include capital lease obligations. Amounts do not assume additional borrowings or refinancings of existing debt. (2) Amounts (i) are based on our outstanding debt at December 31, 2014, (ii) assume the interest rates on our variable rate debt remain constant at the December 31, 2014 rates and (iii) assume that our existing debt is repaid at maturity. Critical Accounting Estimates The preparation of our financial statements in conformity with GAAP requires us to make estimates and assumptions that affect the reported amounts of assets and liabilities at the date of the financial statements and the reported amounts of revenue and expenses during the reporting period. Listed below are the accounting estimates that we believe are critical to our financial statements due to the degree of uncertainty regarding the estimates or assumptions involved and the magnitude of the asset, liability, revenue or expense being reported. All of these accounting estimates and assumptions, as well as the resulting impact to our financial statements, have been discussed with the audit committee of our board of directors. Fair Value Measurements Financial Instruments. We record a number of assets and liabilities in our consolidated balance sheet at fair value on a recurring basis, including available-for-sale ("AFS") securities, financial instruments and our exchangeable senior debentures. GAAP provides a hierarchy that prioritizes inputs to valuation techniques used to measure fair value into three broad levels. Level 1 inputs are quoted market prices in active markets for identical assets or liabilities that the reporting entity has the ability to access at the measurement date. We use quoted market prices, or Level 1 inputs, to value all our Fair Value Option Securities. As of December 31, 2014 and 2013, the carrying value of our Fair Value Option securities was $1,220 million and $1,309 million, respectively. Level 2 inputs, other than quoted market prices included within Level 1, are observable for the asset or liability, either directly or indirectly. We use quoted market prices to determine the fair value of our exchangeable senior debentures. However, these debentures are not traded on active markets as defined in GAAP, so these liabilities fall in Level 2. As of December 31, 2014, the principal amount and carrying value of our exchangeable debentures were $2,481 million and $2,574 million, respectively. Level 3 inputs are unobservable inputs for an asset or liability. We currently have no Level 3 financial instrument assets or liabilities. Non-Financial Instruments. Our non-financial instrument valuations are primarily comprised of our annual assessment of the recoverability of our goodwill and other nonamortizable intangibles, such as trademarks and our evaluation of the recoverability of our other long-lived assets upon certain triggering events. If the carrying value of our long-lived assets exceeds their undiscounted cash flows, we are required to write the carrying value down to fair value. Any such writedown is included in impairment of long-lived assets in our consolidated statement of operations. A high degree of judgment is required to estimate the fair value of our long-lived assets. We may use quoted market prices, prices for similar assets, present value techniques and other valuation techniques to prepare these estimates. We may need to make estimates of future cash flows and discount rates as well as other assumptions in order to implement these valuation techniques. Due to the high degree of judgment involved in our estimation techniques, any value ultimately derived from F-16 |
|
|
our long-lived assets may differ from our estimate of fair value. As each of our operating segments has long-lived assets, this critical accounting policy affects the financial position and results of operations of each segment. As of December 31, 2014, the intangible assets not subject to amortization for each of our significant reportable segments were as follows: Goodwill Trademarks Total amounts in millions QVC . . . . . . . . . . . . . . . . . . . . . . . . . . . . . . . . . . . . . . . . . . $ 5,206 2,428 7,634 Digital Commerce . . . . . . . . . . . . . . . . . . . . . . . . . . . . . . . 198 61 259 $ 5,404 2,489 7,893 We perform our annual assessment of the recoverability of our goodwill and other non-amortizable intangible assets during the fourth quarter of each year. We utilize a qualitative assessment for determining whether step one of the goodwill impairment analysis is necessary. The accounting guidance permits entities to first assess qualitative factors to determine whether it is more likely than not that the fair value of a reporting unit is less than its carrying amount as a basis for determining whether it is necessary to perform the two-step goodwill impairment test. In evaluating goodwill on a qualitative basis the Company reviews the business performance of each reporting unit and evaluates other relevant factors as identified in the relevant accounting guidance to determine whether it is more likely than not that an indicated impairment exists for any of our reporting units. The Company considers whether there are any negative macroenomic conditions, industry specific conditions, market changes, increased competition, increased costs in doing business, management challenges, the legal environments and how these factors might impact company specific performance in future periods. As part of the analysis the Company also considers fair value determinations for certain reporting units that have been made at various points throughout the current and prior years for other purposes. During the years ended December 31, 2014, 2013 and 2012 we recorded $7 million, $30 million and $53 million, respectively, in goodwill and other intangibles impairments for certain of our Digital Commerce companies, primarily Evite. Continued declining operating results as compared to budgeted results and certain trends required a Step 2 impairment test and a determination of fair value for these subsidiaries. Fair value for these subsidiaries, including intangible assets and goodwill, was determined using the respective companies’ projections of future operating performance and applying a combination of market multiples and a discounted cash flow calculation (Level 3). Carrying Value of Investments. We periodically evaluate our investments to determine if decreases in fair value below our cost bases are other than temporary. If a decline in fair value is determined to be other than temporary, we are required to reflect such decline in our consolidated statement of operations. Other than temporary declines in fair value of our cost investments are recognized on a separate line in our consolidated statement of operations, and other than temporary declines in fair value of our equity method investments are included in share of losses of affiliates in our consolidated statement of operations. The primary factors we consider in our determination of whether declines in fair value are other than temporary are the length of time that the fair value of the investment is below our carrying value; the severity of the decline; and the financial condition, operating performance and near term prospects of the investee. In addition, we consider the reason for the decline in fair value, be it general market conditions, industry specific or investee specific; analysts' ratings and estimates of 12 month share price targets for the investee; changes in stock price or valuation subsequent to the balance sheet date; and our intent and ability to hold the investment for a period of time sufficient to allow for a recovery in fair value. Fair value of our publicly traded cost and equity investments is based on the market prices of the investments at the balance sheet date. We estimate the fair value of our other cost and equity investments using a variety of methodologies, F-17 |
|
|
including cash flow multiples, discounted cash flow, per subscriber values, or values of comparable public or private businesses. Impairments are calculated as the difference between our carrying value and our estimate of fair value. As our assessment of the fair value of our investments and any resulting impairment losses and the timing of when to recognize such charges requires a high degree of judgment and includes significant estimates and assumptions, actual results could differ materially from our estimates and assumptions. Our evaluation of the fair value of our investments and any resulting impairment charges are made as of the most recent balance sheet date. Changes in fair value subsequent to the balance sheet date due to the factors described above are possible. Subsequent decreases in fair value will be recognized in our consolidated statement of operations in the period in which they occur to the extent such decreases are deemed to be other than temporary. Subsequent increases in fair value will be recognized in our consolidated statement of operations only upon our ultimate disposition of the investment. Retail Related Adjustments and Allowances. QVC records adjustments and allowances for sales returns, inventory obsolescence and uncollectible receivables. Each of these adjustments is estimated based on historical experience. Sales returns are calculated as a percent of sales and are netted against revenue in our consolidated statement of operations. For the years ended December 31, 2014, 2013 and 2012, sales returns represented 19.4%, 19.8% and 19.4% of QVC's gross product revenue, respectively. The inventory obsolescence reserve is calculated as a percent of QVC's inventory at the end of a reporting period based on, among other factors, the average inventory balance for the preceding 12 months and historical experience with liquidated inventory. The change in the reserve is included in cost of goods sold in our consolidated statements of operations. At December 31, 2014, QVC's inventory was $882 million, which was net of the obsolescence adjustment of $76 million. QVC's allowance for doubtful accounts is calculated as a percent of accounts receivable at the end of a reporting period, and the change in such allowance is recorded as bad debt expense in our consolidated statements of operations. At December 31, 2014, QVC's trade accounts receivable were $1,196 million, net of the allowance for doubtful accounts of $91 million. Each of these estimates requires management judgment and may not reflect actual results. Income Taxes. We are required to estimate the amount of tax payable or refundable for the current year and the deferred income tax liabilities and assets for the future tax consequences of events that have been reflected in our financial statements or tax returns for each taxing jurisdiction in which we operate. This process requires our management to make judgments regarding the timing and probability of the ultimate tax impact of the various agreements and transactions that we enter into. Based on these judgments we may record tax reserves or adjustments to valuation allowances on deferred tax assets to reflect the expected realizability of future tax benefits. Actual income taxes could vary from these estimates due to future changes in income tax law, significant changes in the jurisdictions in which we operate, our inability to generate sufficient future taxable income or unpredicted results from the final determination of each year's liability by taxing authorities. These changes could have a significant impact on our financial position. F-18 |
|
|
Results of Operations—Businesses QVC. QVC is a retailer of a wide range of consumer products, which are marketed and sold primarily by merchandise-focused televised shopping programs, the Internet and mobile applications. In the United States, QVC's live programming is distributed via its nationally televised shopping program 24 hours per day, 364 days per year ("QVCU. S."). Internationally, QVC's program services are based in Germany ("QVC-Germany"), Japan ("QVC-Japan"), the United Kingdom ("QVC-U.K.") and Italy ("QVC-Italy"). QVC-Germany distributes its program 24 hours per day with 17 hours of live programming, QVC-Japan distributes live programming 24 hours per day and QVC-U.K. distributes its program 24 hours per day with 17 hours of live programming. QVC-Italy distributes programming live for 17 hours per day on satellite and digital terrestrial television and an additional seven hours per day of recorded programming on satellite and seven hours a day of general interest programming on digital terrestrial television. QVC’s Japanese operations are conducted through a joint venture with Mitsui & Co. LTD ("Mitsui") for a television and multimedia retailing service in Japan. QVC-Japan is owned 60% by QVC and 40% by Mitsui. QVC and Mitsui share in all profits and losses based on their respective ownership interests. During the years ended December 31, 2014, 2013 and 2012, QVC-Japan paid dividends to Mitsui of $42 million, $45 million and $29 million, respectively. Additionally, during 2012 QVC entered into a joint venture with CNR Media Group, formerly known as China Broadcasting Corporation, a limited liability company, owned by China National Radio (''CNR'') for a 49% interest in a CNR subsidiary, CNR Home Shopping Co., Ltd. (''CNRS''). CNRS distributes live programming for 17 hours per day and recorded programming for 7 hours per day. The CNRS joint venture is accounted for as an equity method investment. On April 16, 2014, QVC announced plans to expand its global presence into France. Similar to its other markets, QVC plans to offer a highly immersive digital shopping experience, with strong integration across e-commerce, TV, mobile and social platforms, with the launch expected in the summer of 2015. QVC's operating results were as follows: Years ended December 31, 2014 2013 2012 amounts in millions Net revenue . . . . . . . . . . . . . . . . . . . . . . . . . . . . . . . . . . . . . $ 8,801 8,623 8,516 Cost of sales . . . . . . . . . . . . . . . . . . . . . . . . . . . . . . . . . . . . . (5,547) (5,465) (5,419) Gross profit . . . . . . . . . . . . . . . . . . . . . . . . . . . . . . . . . . . . . 3,254 3,158 3,097 Operating expenses . . . . . . . . . . . . . . . . . . . . . . . . . . . . . . . (753) (740) (715) SG&A expenses (excluding stock-based compensation) . (591) (577) (554) Adjusted OIBDA . . . . . . . . . . . . . . . . . . . . . . . . . . . . . . . . . 1,910 1,841 1,828 Stock-based compensation . . . . . . . . . . . . . . . . . . . . . . . . . (44) (38) (34) Depreciation and amortization . . . . . . . . . . . . . . . . . . . . . . (587) (558) (526) Operating income . . . . . . . . . . . . . . . . . . . . . . . . . . . . . . . . $ 1,279 1,245 1,268 F-19 |
|
|
Net revenue was generated from the following geographical areas: Years ended December 31, 2014 2013 2012 amounts in millions QVC-U.S. . . . . . . . . . . . . . . . . . . . . . . . . . . . . . . . . . . . . . . $ 6,055 5,844 5,585 QVC-Germany . . . . . . . . . . . . . . . . . . . . . . . . . . . . . . . . . . 970 971 956 QVC-Japan . . . . . . . . . . . . . . . . . . . . . . . . . . . . . . . . . . . . . 908 1,024 1,247 QVC-U.K. . . . . . . . . . . . . . . . . . . . . . . . . . . . . . . . . . . . . . . 730 657 641 QVC-Italy . . . . . . . . . . . . . . . . . . . . . . . . . . . . . . . . . . . . . . 138 127 87 $ 8,801 8,623 8,516 QVC's consolidated net revenue increased 2.1% and 1.3% for the years ended December 31, 2014 and 2013, respectively, as compared to the corresponding prior years. The 2014 increase of $178 million in net revenue was primarily comprised of $225 million due to a 2.3% increase in units sold, partially offset by $49 million of unfavorable foreign currency rate adjustments primarily in Japan. Additionally, net revenue was positively impacted by a decrease in the return rate from 19.8% in 2013 to 19.4% in 2014. This was driven by international improvements primarily in Germany and Japan. The return rate improved in Germany primarily due lower return rates in all categories and to a lesser extent positive mix shift from apparel and jewelry to home. The return rate improved in Japan primarily due to lower return rates in jewelry, apparel and accessories and a greater mix in beauty. The 2013 increase in net revenue of $107 million was primarily comprised of $257 million due to a 2.7% increase in the average selling price per unit ("ASP") and $155 million due to a 1.6% increase in units sold. These amounts were partially offset by $200 million of unfavorable foreign currency rate adjustments primarily in Japan. Additionally, net revenue was negatively impacted by $102 million due to an increase in estimated product returns, primarily in the U.S., Japan and Germany as a result of the sales increases. The increase in returns in the U.S. was primarily due to sales volume and the increases in Japan and Germany were primarily due to higher returns in the apparel and jewelry categories and a greater mix of apparel products that return at higher rates than other categories. Overall returns as a percent of gross product revenue increased to 19.8% in 2013 from 19.4% in 2012. During the years ended December 31, 2014 and 2013, the changes in revenue and expenses were affected by changes in the exchange rates for the Japanese Yen, the Euro and the U.K. Pound Sterling. In the event the U.S. Dollar strengthens against these foreign currencies in the future, QVC's revenue and operating cash flow will be negatively affected. The percentage increase (decrease) in net revenue for each of QVC's geographic areas in U.S. Dollars and in local currency was as follows: Year ended December 31, 2014 Year ended December 31, 2013 U.S. dollars Local currency U.S. dollars Local currency QVC-US. . . . . . . . . . . . . . . . . . . . . . . . 3.6 % 3.6 % 4.6 % 4.6 % QVC-Germany . . . . . . . . . . . . . . . . . . (0.1)% 0.4 % 1.6 % (1.7) % QVC-Japan . . . . . . . . . . . . . . . . . . . . . (11.3)% (3.8)% (17.9)% 0.3 % QVC-UK . . . . . . . . . . . . . . . . . . . . . . . 11.1 % 6.0 % 2.5 % 3.7 % QVC-Italy . . . . . . . . . . . . . . . . . . . . . . 8.7 % 9.0 % 46.0 % 41.5 % In 2014, QVC-U.S. net revenue growth was primarily due to a 4.7% increase in units shipped offset by a 0.9% decrease in ASP. QVC-U.S. experienced shipped sales growth in all categories except electronics. QVC-Germany's shipped sales in local currency increased primarily in the home category offset by declines primarily in the apparel and jewelry F-20 |
|
|
categories. QVC-Japan's shipped sales in local currency declined in all categories except electronics and beauty. The declines in QVC-Japan's shipped sales in local currency were primarily due to a local consumption tax increase that became effective April 1, 2014. QVC-U.K.'s shipped sales growth in local currency increased primarily in the beauty, home and jewelry categories. QVC-Italy's shipped sales growth in local currency increased primarily in the beauty, accessories and apparel categories. In 2013, QVC-U.S. net revenue growth was primarily due to a 4.6% increase in ASP as a result of higher rates in the beauty and accessories categories as well as a greater mix of accessories. QVC-U.S. experienced shipped sales growth in all categories except jewelry. QVC-Germany's shipped sales in local currency increased primarily in the apparel and accessories categories, but this growth was more than offset by declines in jewelry and electronics and an increase in estimated product returns. QVC-Japan's shipped sales in local currency improved primarily in the apparel, home and electronics categories, offset by declines in accessories and jewelry and an increase in estimated product returns. QVCU. K.'s shipped sales growth in local currency was primarily the result of increased sales in the home and beauty categories, partially offset by declines in jewelry. QVC-Italy's sales consisted primarily of home, beauty and apparel products. QVC's gross profit percentage was 37.0%, 36.6% and 36.4% for the years ended December 31, 2014, 2013 and 2012, respectively. The increase in gross profit percentage in 2014 and 2013 was primarily due to improved product margins in the U.S. and the U.K. QVC's operating expenses are principally comprised of commissions, order processing and customer service expenses, credit card processing fees, telecommunications expenses and production costs. Operating expenses increased $13 million or 1.8% and $25 million or 3.5% for the years ended December 31, 2014 and 2013, respectively. The increase in 2014 was primarily due to a $5 million increase in each of customer service, commissions expenses and credit card processing fees and a $4 million increase in programming and production costs, partially offset by favorable foreign currency exchange rates of $6 million. The increase in customer service expenses was primarily due to the launch of the new European systems platform that created some short-term disruptions and resulted in additional talk times in Germany and an increase in the U.S. due to volume associated with the sales increase. The increase in commission expenses was primarily due to higher programming distribution costs in Japan and sales increases in the U.S. The increase in credit card fees was primarily due to the U.S. sales increase and lower usage of the QVC branded credit card (“Q Card”) combined with a higher mix of purchases from customers using credit cards with higher rates charged to merchants. The increase in programming and production costs was primarily due to increased manpower costs in the U.S., partially offset by declines in Germany as a result of a reduction in live programming from 24 to 17 hours per day. The increase in 2013 was primarily due to a $29 million increase in credit card processing fees and a $17 million increase in commission expense, offset by a $22 million effect of exchange rates. In regards to the increase in credit card processing fees, QVC-U.S. reached a favorable legal settlement in 2012, which offset the related expenses. Credit card processing fees also increased in 2013 due to the U.S. sales increase and lower usage of the Q Card combined with a higher mix of purchases from customers using credit cards with higher rates charged to merchants. The increase in commission expense was primarily due to the sales increase in the U.S. and additional programming distribution expenses in Japan. QVC's SG&A expenses include personnel, information technology, provision for doubtful accounts, credit card income and marketing and advertising expenses. Such expenses increased $14 million, and remained consistent as a percent of net revenue, at 6.7% for the year ended December 31, 2014 and increased $23 million, and as a percent of net revenue, from 6.5% to 6.7% for the year ended December 31, 2013 as a result of a variety of factors. The increase in 2014 was primarily related to a $12 million increase in the provision for doubtful accounts, an $11 million increase in outside services expenses and a $10 million increase in personnel expense, partially offset by a $17 F-21 |
|
|
million increase in credit card income and a $3 million favorable impact of exchange rates. The increase in the provision for doubtful accounts was primarily due to the increased use of the Easy-Pay installment program in the U.S. and to a lesser extent in Germany. The increase in outside services expenses was primarily due to information technology and commerce platform projects and global market expansion expenses including France. The increase in personnel expenses was primarily due to merit, benefits and severance increases in the U.S. and the France start-up. The increase in credit card income was primarily due to the more favorable economics of the Q Card portfolio in the U.S. and higher bank reserve requirements associated with the U.S. regulatory environment in the prior year. QVC-U.S. amended and restated its agreement with a large consumer financial services company (the "Bank") pursuant to which the Bank provides revolving credit directly to QVC's customers for the sole purpose of purchasing merchandise or services with a QVC branded credit card. The agreement provides more favorable economic terms for QVC and was effective August 1, 2014. The increase in 2013 was primarily related to a $35 million increase in personnel expense, a $7 million increase in information technology expense, a $5 million increase in the provision for doubtful accounts and a $2 million decrease in credit card income, offset by a $13 million effect of exchange rates, a $12 million decrease in sales and franchise taxes and a $3 million decrease in rent expense. The increase in personnel expense was primarily due to merit, benefits and bonus increases in the U.S. and the U.K. as well as severance costs in Germany and the U.K. The increase in information technology expense was primarily due to additional cloud-based software solutions in the U.S. and solutions to enhance customer service and productivity in Germany. The increase in the provision for doubtful accounts was primarily due to the increased use of the Easy-Pay installment program in the U.S. The decrease in credit card income was primarily due to the overall economics, including usage, of the Q Card portfolio in the U.S. and higher bank reserve requirements. The decrease in sales and franchise taxes was primarily due to a revision in settlement estimates and credits in the U.S. The decrease in rent expense was primarily due to duplicate running costs including a lease cancellation accrual in the U.K. in 2012 associated with the move to its new headquarters, partially offset by higher rent expense on its new facility in 2013. Depreciation and amortization consisted of the following: Years ended December 31, 2014 2013 2012 amounts in millions Affiliate agreements . . . . . . . . . . . . . . . . . . . . . . . . . . . . . . . . . $ 150 150 151 Customer relationships . . . . . . . . . . . . . . . . . . . . . . . . . . . . . . . 173 172 172 Acquisition related amortization . . . . . . . . . . . . . . . . . . . . . . 323 322 323 Property and equipment . . . . . . . . . . . . . . . . . . . . . . . . . . . . . . 135 127 126 Software amortization . . . . . . . . . . . . . . . . . . . . . . . . . . . . . . . . 93 78 62 Channel placement amortization and related expenses . . . . . 36 31 15 Total depreciation and amortization . . . . . . . . . . . . . . . . . . . $ 587 558 526 The increases in software amortization in 2014 and 2013 were primarily due to solutions to enhance customer service and productivity in the U.S., Germany and Italy. Digital Commerce businesses. Our Digital Commerce businesses are comprised primarily of Backcountry, Bodybuilding, CommerceHub and Provide (through December 31, 2014, see discussion below). Revenue for the Digital Commerce businesses is seasonal due to certain holidays, which drive a significant portion of the Digital Commerce businesses' revenue. The third quarter is generally lower, as compared to the other three quarters, due to fewer holidays. As discussed above, on October 3, 2014, Liberty reattributed from the QVC Group (formerly known as the Interactive Group prior to the reattribution) to the Ventures Group its Digital Commerce companies, which were valued at $1.5 billion, and approximately $1 billion in cash. F-22 |
|
|
Additionally, on December 31, 2014, FTD acquired Provide from Liberty in return for approximately 10.2 million shares of FTD common stock representing approximately 35% of the combined company and approximately $145 million in cash. Subsequent to the FTD Transaction, Liberty accounts for FTD as an equity-method affiliate based on the ownership level and board representation. The results of the Digital Commerce businesses are reflected in the Ventures Group prospectively from the date of the reattribution. The results of the Digital Commerce businesses below reflects the consolidated results of the Digital Commerce businesses, as included in the QVC Group for the years ended December 31, 2013 and 2012 and in the QVC Group (through the reattribution date) and the Ventures Group from the reattribution date through December 31, 2014. Additionally, due to the FTD Transaction, Provide’s results will no longer be consolidated in future periods. In order to better understand the results of the remaining Digital Commerce businesses we have separately disclosed Provide’s financial performance. Provide will not be treated as a discontinued operation due to our continuing involvement in FTD. Years ended December 31, 2014 2013 2012 amounts in millions Revenue Digital Commerce businesses — continuing . . . . . . . . . . . . $ 1,032 943 752 Provide . . . . . . . . . . . . . . . . . . . . . . . . . . . . . . . . . . . . . . . . . . . 666 653 620 $ 1,698 1,596 1,372 Adjusted OIBDA Digital Commerce businesses — continuing . . . . . . . . . . . . $ 90 74 56 Provide . . . . . . . . . . . . . . . . . . . . . . . . . . . . . . . . . . . . . . . . . . . 7 29 46 $ 97 103 102 Operating income (loss) Digital Commerce businesses — continuing . . . . . . . . . . . . $ 7 10 (45) Provide . . . . . . . . . . . . . . . . . . . . . . . . . . . . . . . . . . . . . . . . . . . (15) (36) 15 $ (8) (26) (30) Digital Commerce businesses — continuing. Revenue for the continuing consolidated Digital Commerce businesses increased $89 million and $191 million for the years ended December 31, 2014 and 2013 as compared to the corresponding prior year periods, respectively. The increase in revenue was due to increases at each of our subsidiaries Backcountry ($37 million and $75 million, respectively), Bodybuilding ($34 million and $100 million, respectively) and CommerceHub ($15 million and $13 million, respectively). Backcountry revenue increased as a result of increased order volume and an increase in average order value. The increase in Bodybuilding revenue was primarily due to increased order volume on flat average order values. CommerceHub revenue growth was primarily attributed to growth in active customers (vendors and suppliers) who pay a license and setup fee and an increase in the number of aggregate transactions processed for which CommerceHub earns a per transaction fee. Adjusted OIBDA for the continuing Digital Commerce businesses increased $17 million and $18 million for the years ended December 31, 2014 and 2013, respectively. The growth in Adjusted OIBDA was primarily the result of increased revenue, as discussed above, primarily due to increases at Backcountry ($9 million and flat, respectively), Bodybuilding ($2 million and $10 million, respectively) and CommerceHub ($8 million and $9 million, respectively). Adjusted OIBDA represents 8.8% of revenue in 2014, as compared to 7.8% of revenue in 2013 and 7.4% in 2012. Most F-23 |
|
|
of our subsidiaries experienced flat to slightly increased Adjusted OIBDA as a percentage of sales for the years ended December 31, 2014 and 2013 which was primarily the result of improved product margins and cost containment efforts offset by increased marketing and promotional spend and lower advertising revenue due to unfavorable pricing and a shift to mobile applications. Additionally, for the year ended December 31, 2012 the Digital Commerce companies recorded legal settlement expense of approximately $6 million. Operating income (loss) for the continuing Digital Commerce businesses decreased $3 million and improved $55 million for the years ended December 31, 2014 and 2013, respectively. The slight decrease in 2014 was primarily the result of Adjusted OIBDA growth offset by increased depreciation and stock compensation expense at these subsidiaries combined with a $7 million impairment recorded at Evite. The significant change in operating income (loss) from 2012 is due to the Adjusted OIBDA fluctuations, discussed above, combined with $53 million of impairments of goodwill and other intangible assets during the year ended December 31, 2012 related to our consolidated subsidiary, Evite, as a result of continued declining operating results and disappointing trends during 2012. Provide. Provide comprises primarily three lines of e-commerce business––ProFlowers, gourmet foods and personalized gifts. The ProFlowers business is the most significant portion generating approximately 60% of total revenue for all periods presented. Provide’s business is highly seasonal with higher flower and gourmet food revenue in the first half of the year due to sales for Valentine’s Day and Mother’s Day. Revenue for the year ended December 31, 2014 increased approximately $13 million. The increase was primarily the result of revenue growth in the gourmet foods ($10 million) and personalized gifts ($6 million) business which was offset slightly by a decrease in ProFlowers revenue ($3 million). The overall demand for ProFlowers appeared to be down from the prior year as order volume was slightly down on a fairly flat average order value. Demand for gourmet foods and personalized gifts were up slightly. In the case of gourmet foods, average order value was flat while average order value for gifts was significantly lower due to increased discounting of product to move through outstanding inventory levels, particularly at RedEnvelope which is currently in the process of being shut down. Additionally, a winter storm in the first quarter of 2014 in proximity to Valentine’s Day caused delivery issues with flowers and reduced revenue as flowers were not delivered in time or significantly damaged. Provide’s revenue increased $33 million or 5% for the year ended December 31, 2013. Such increase is primarily attributable to a $28 million increase for ProFlowers due to an increase in average order value and a $13 million increase for gourmet foods. Provide’s Adjusted OIBDA decreased $22 million and $17 million for the years ended December 31, 2014 and 2013, respectively. The decrease in Adjusted OIBDA in 2014 was the product of slower revenue growth than expected and the impact of shipping issues related to the storm in the first quarter of 2014 (as discussed above). Additionally, sales and marketing efforts were not as productive as prior periods overall increasing cost with marginal top line growth. The decrease in 2013 was primarily due to a $19 million decrease for personalized gifts. Revenue for personalized gifts was relatively flat year-over-year while investment in these businesses continued to grow in anticipation of revenue growth. However, gross profit percentage dropped significantly due to higher costs related to products sold, and increased marketing efforts did not drive increased traffic or conversion. The personalized gifts results in 2013 and 2014, particularly RedEnvelope, ultimately led to our decision to wind down that business, which experienced Adjusted OIBDA losses of $15 million and $14 million for the years ended December 31, 2014 and 2013, respectively. Provide’s operating income was impacted by the items discussed above with the addition of greater depreciation and amortization and stock based compensation. In addition, in 2013 Provide recognized a $19 million impairment charge related to its personalized gifts line of business. F-24 |
|
|
As discussed above the Provide interest was sold for cash and an interest in FTD which will be accounted for as an equity method affiliate in future periods. Therefore, the consolidated results of Provide will no longer be included in Liberty on a go forward basis. Quantitative and Qualitative Disclosures about Market Risk. We are exposed to market risk in the normal course of business due to our ongoing investing and financial activities and the conduct of operations by our subsidiaries in different foreign countries. Market risk refers to the risk of loss arising from adverse changes in stock prices, interest rates and foreign currency exchange rates. The risk of loss can be assessed from the perspective of adverse changes in fair values, cash flows and future earnings. We have established policies, procedures and internal processes governing our management of market risks and the use of financial instruments to manage our exposure to such risks. We are exposed to changes in interest rates primarily as a result of our borrowing and investment activities, which include investments in fixed and floating rate debt instruments and borrowings used to maintain liquidity and to fund business operations. The nature and amount of our long-term and short-term debt are expected to vary as a result of future requirements, market conditions and other factors. We manage our exposure to interest rates by maintaining what we believe is an appropriate mix of fixed and variable rate debt. We believe this best protects us from interest rate risk. We have achieved this mix by (i) issuing fixed rate debt that we believe has a low stated interest rate and significant term to maturity, (ii) issuing variable rate debt with appropriate maturities and interest rates and (iii) entering into interest rate swap arrangements when we deem appropriate. As of December 31, 2014, our debt is comprised of the following amounts: Variable rate debt Fixed rate debt Principal Weighted avg Principal Weighted avg amount interest rate amount interest rate dollar amounts in millions QVC Group QVC . . . . . . . . . . . . . . . . . . . . . . . . . $ 508 2.0 % $ 4,124 5.0 % Corporate and other . . . . . . . . . . . . $ — NA $ 1,192 5.9 % Ventures Group Corporate and other . . . . . . . . . . . . $ 50 2.5 % $ 2,092 2.5 % We are exposed to changes in stock prices primarily as a result of our significant holdings in publicly traded securities. We continually monitor changes in stock markets, in general, and changes in the stock prices of our holdings, specifically. We believe that changes in stock prices can be expected to vary as a result of general market conditions, technological changes, specific industry changes and other factors. We periodically use equity collars and other financial instruments to manage market risk associated with certain investment positions. These instruments, when utilized, are recorded at fair value based on option pricing models. At December 31, 2014, the fair value of our AFS equity securities was $1,220 million. Had the market price of such securities been 10% lower at December 31, 2014, the aggregate value of such securities would have been $122 million lower. Our stock in Expedia and other equity method affiliates which are publicly traded securities are not reflected at fair value in our balance sheet. These securities are also subject to market risk that is not directly reflected in our statement of operations. Additionally, our exchangeable senior debentures are also subject to market risk. Because we mark these instruments to fair value each reporting date, increases in the price of the respective underlying security generally result in higher liabilities and unrealized losses in our statement of operations. Liberty is exposed to foreign exchange rate fluctuations related primarily to the monetary assets and liabilities and the financial results of QVC's foreign subsidiaries. Assets and liabilities of foreign subsidiaries for which the functional F-25 |
|
|
currency is the local currency are translated into U.S. dollars at period-end exchange rates, and the statements of operations are generally translated at the average exchange rate for the period. Exchange rate fluctuations on translating foreign currency financial statements into U.S. dollars that result in unrealized gains or losses are referred to as translation adjustments. Cumulative translation adjustments are recorded in accumulated other comprehensive earnings (loss) as a separate component of stockholders' equity. Transactions denominated in currencies other than the functional currency are recorded based on exchange rates at the time such transactions arise. Subsequent changes in exchange rates result in transaction gains and losses, which are reflected in income as unrealized (based on period-end translations) or realized upon settlement of the transactions. Cash flows from our operations in foreign countries are translated at the average rate for the period. Accordingly, Liberty may experience economic loss and a negative impact on earnings and equity with respect to our holdings solely as a result of foreign currency exchange rate fluctuations. We periodically assess the effectiveness of our derivative financial instruments. With regard to interest rate swaps, we monitor the fair value of interest rate swaps as well as the effective interest rate the interest rate swap yields, in comparison to historical interest rate trends. We believe that any losses incurred with regard to interest rate swaps would be largely offset by the effects of interest rate movements on the underlying debt facilities. These measures allow our management to evaluate the success of our use of derivative instruments and to determine when to enter into or exit from derivative instruments. Financial Statements and Supplementary Data. The consolidated financial statements of Liberty Interactive Corporation are filed under this Item, beginning on page F-31. The financial statement schedules required by Regulation S-X are filed under Item 15 of this Annual Report on Form 10K. Changes in and Disagreements with Accountants on Accounting and Financial Disclosure. None. Controls and Procedures. Disclosure Controls and Procedures In accordance with Exchange Act Rules 13a-15 and 15d-15, the Company carried out an evaluation, under the supervision and with the participation of management, including its chief executive officer and its principal accounting and financial officer (the “Executives”), of the effectiveness of its disclosure controls and procedures as of the end of the period covered by this report. Based on that evaluation, the Executives concluded that the Company's disclosure controls and procedures were not effective as of December 31, 2014 because of the material weakness in our internal control over financial reporting that is described below in “Management’s Report on Internal Control Over Financial Reporting.” However, giving full consideration to the material weakness, the Company’s management has concluded that the Consolidated Financial Statements included in this annual report present fairly, in all material respects, the Company’s financial position, results of operations and cash flows for the periods disclosed in conformity with U.S. generally accepted accounting principles. KPMG LLP has issued its report dated February 26, 2015, which expressed an unqualified opinion on those Consolidated Financial Statements. Management’s Report on Internal Control Over Financial Reporting See page F-28 for Management's Report on Internal Control Over Financial Reporting. F-26 |
|
|
See page F-29 for Report of Independent Registered Public Accounting Firm for their attestation regarding our internal control over financial reporting. Changes in Internal Control Over Financial Reporting Other than the identification of the material weakness described above, there was no change in the Company’s internal control over financial reporting that occurred during the Company’s quarter ended December 31, 2014, and that has materially affected, or is reasonably likely to materially affect, the Company’s internal control over financial reporting. Remediation Plan for Material Weakness in Internal Control over Financial Reporting In response to the material weakness identified in Management’s Report on Internal Control over Financial Reporting, the Company and QVC have developed a plan with oversight from the Audit Committee of the Board of Directors to remediate the material weakness. The remediation efforts expected to be implemented include the following: • Establish a more comprehensive review and approval process at QVC for authorizing user access to information technology systems and monitoring user access to ensure that all information technology controls designed to restrict access to operating systems, applications and data, and the ability to make program changes, are operating in a manner that provides the Company and QVC with assurance that such access is properly restricted to the appropriate personnel. • Evaluate QVC’s staffing levels and responsibilities to provide for appropriate segregation of duties among the personnel. • Develop and implement adequate training for QVC personnel to reinforce pre-established and new information technology controls and their financial reporting objectives enabling a better understanding of the internal control environment to improve our ability to detect and prevent potential deficiencies. • Engage external experts to assess and improve financial application access rights to optimize appropriate segregation of duties and to perform a code review of relevant software applications. The Company and QVC believe the foregoing efforts will effectively remediate the material weakness. Because the reliability of the internal control process requires repeatable execution, the successful remediation of this material weakness will require review and evidence of effectiveness prior to concluding that the controls are effective and there is no assurance that additional remediation steps will not be necessary. Although no assurance can be given as to when the remediation plan will be completed, the Company and QVC believe the remediation efforts will be completed during the third quarter of 2015 and will test and re-evaluate the effectiveness of QVC’s information technology general controls thereafter. Other Information. None. F-27 |
|
|
MANAGEMENT'S REPORT ON INTERNAL CONTROL OVER FINANCIAL REPORTING Liberty Interactive Corporation’s (the “Company”) management is responsible for establishing and maintaining adequate internal control over the Company’s financial reporting, as such term is defined in Rule 13a-15(f) of the Securities Exchange Act of 1934. The Company’s internal control over financial reporting is designed to provide reasonable assurance regarding the reliability of financial reporting and the preparation of financial statements for external purposes in accordance with accounting principles generally accepted in the United States of America. Because of inherent limitations, internal control over financial reporting may not prevent or detect misstatements. Also, projections of any evaluation of effectiveness to future periods are subject to the risk that controls may become inadequate because of changes in conditions, or that the degree of compliance with the policies and procedures may deteriorate. The Company’s management assessed the effectiveness of internal control over financial reporting as of December 31, 2014, using the criteria in Internal Control-Integrated Framework (1992), issued by the Committee of Sponsoring Organizations of the Treadway Commission. Based on this assessment, management has concluded that, as of December 31, 2014, our internal control over financial reporting is not effective due to the material weakness described below. A material weakness is a deficiency, or a combination of deficiencies, in internal control over financial reporting, such that there is a reasonable possibility that a material misstatement of the Company’s annual or interim financial statements will not be prevented or detected on a timely basis. Based on its evaluation of internal control over financial reporting as described above, management concluded that it did not design and maintain effective internal controls with respect to segregation of duties and related information technology general controls (ITGCs) at QVC, Inc., a wholly owned subsidiary. Specifically, the ITGCs were not designed and operating effectively to ensure (i) that access to applications and data, and the ability to make program changes, were adequately restricted to appropriate personnel and (ii) that the activities of individuals with access to modify data and make program changes were appropriately monitored. While the control deficiency identified did not result in any misstatements a reasonable possibility exists that a material misstatement to the annual or interim consolidated financial statements and disclosures will not be prevented or detected on a timely basis. The Company's independent registered public accounting firm who audited the consolidated financial statements included in the Annual Report on Form 10-K have issued an adverse report on the effectiveness of the Company's internal control over financial reporting. This attestation report appears on page F-29 of this Annual Report on Form 10-K. F-28 |
|
|
Report of Independent Registered Public Accounting Firm The Board of Directors and Stockholders Liberty Interactive Corporation: We have audited Liberty Interactive Corporation and subsidiaries’ (the Company) internal control over financial reporting as of December 31, 2014, based on criteria established in Internal Control – Integrated Framework (1992), issued by the Committee of Sponsoring Organizations of the Treadway Commission (COSO). The Company’s management is responsible for maintaining effective internal control over financial reporting and for its assessment of the effectiveness of internal control over financial reporting, included in the accompanying Management’s Report on Internal Control Over Financial Reporting on page F-28. Our responsibility is to express an opinion on the Company’s internal control over financial reporting based on our audit. We conducted our audit in accordance with the standards of the Public Company Accounting Oversight Board (United States). Those standards require that we plan and perform the audit to obtain reasonable assurance about whether effective internal control over financial reporting was maintained in all material respects. Our audit included obtaining an understanding of internal control over financial reporting, assessing the risk that a material weakness exists, and testing and evaluating the design and operating effectiveness of internal control based on the assessed risk. Our audit also included performing such other procedures as we considered necessary in the circumstances. We believe that our audit provides a reasonable basis for our opinion. A company’s internal control over financial reporting is a process designed to provide reasonable assurance regarding the reliability of financial reporting and the preparation of financial statements for external purposes in accordance with generally accepted accounting principles. A company’s internal control over financial reporting includes those policies and procedures that (1) pertain to the maintenance of records that, in reasonable detail, accurately and fairly reflect the transactions and dispositions of the assets of the company; (2) provide reasonable assurance that transactions are recorded as necessary to permit preparation of financial statements in accordance with generally accepted accounting principles, and that receipts and expenditures of the company are being made only in accordance with authorizations of management and directors of the company; and (3) provide reasonable assurance regarding prevention or timely detection of unauthorized acquisition, use, or disposition of the company’s assets that could have a material effect on the financial statements. Because of its inherent limitations, internal control over financial reporting may not prevent or detect misstatements. Also, projections of any evaluation of effectiveness to future periods are subject to the risk that controls may become inadequate because of changes in conditions, or that the degree of compliance with the policies or procedures may deteriorate. A material weakness is a deficiency, or a combination of deficiencies, in internal control over financial reporting, such that there is a reasonable possibility that a material misstatement of the company’s annual or interim financial statements will not be prevented or detected on a timely basis. A material weakness related to the design and operating effectiveness of information technology general controls over access to applications and data has been identified at the Company’s wholly owned subsidiary, QVC, Inc., and included in management’s assessment. We also have audited, in accordance with the standards of the Public Company Accounting Oversight Board (United States), the consolidated balance sheets of Liberty Interactive Corporation and subsidiaries as of December 31, 2014 and 2013, and the related consolidated statements of operations, comprehensive earnings (loss), cash flows, and equity for each of the years in the three-year period ended December 31, 2014. This material weakness was considered in determining the nature, timing, and extent of audit tests applied in our audit of the 2014 consolidated financial statements, and this report does not affect our report dated February 26, 2015, which expressed an unqualified opinion on those consolidated financial statements. F-29 |
|
|
In our opinion, because of the effect of the aforementioned material weakness on the achievement of the objectives of the control criteria, the Company has not maintained effective internal control over financial reporting as of December 31, 2014, based on criteria established in Internal Control – Integrated Framework (1992) issued by the Committee of Sponsoring Organizations of the Treadway Commission (COSO). /s/ KPMG LLP Denver, Colorado February 26, 2015 F-30 |
|
|
Report of Independent Registered Public Accounting Firm The Board of Directors and Stockholders Liberty Interactive Corporation: We have audited the accompanying consolidated balance sheets of Liberty Interactive Corporation and subsidiaries (the Company) as of December 31, 2014 and 2013, and the related consolidated statements of operations, comprehensive earnings (loss), cash flows, and equity for each of the years in the three-year period ended December 31, 2014. These consolidated financial statements are the responsibility of the Company’s management. Our responsibility is to express an opinion on these consolidated financial statements based on our audits. We conducted our audits in accordance with the standards of the Public Company Accounting Oversight Board (United States). Those standards require that we plan and perform the audit to obtain reasonable assurance about whether the financial statements are free of material misstatement. An audit includes examining, on a test basis, evidence supporting the amounts and disclosures in the financial statements. An audit also includes assessing the accounting principles used and significant estimates made by management, as well as evaluating the overall financial statement presentation. We believe that our audits provide a reasonable basis for our opinion. In our opinion, the consolidated financial statements referred to above present fairly, in all material respects, the financial position of Liberty Interactive Corporation and subsidiaries as of December 31, 2014 and 2013, and the results of their operations and their cash flows for each of the years in the three-year period ended December 31, 2014, in conformity with U.S. generally accepted accounting principles. We also have audited, in accordance with the standards of the Public Company Accounting Oversight Board (United States), Liberty Interactive Corporation and subsidiaries’ internal control over financial reporting as of December 31, 2014, based on criteria established in Internal Control – Integrated Framework (1992) issued by the Committee of Sponsoring Organizations of the Treadway Commission (COSO), and our report dated February 26, 2015 expressed an adverse opinion on the effectiveness of the Company’s internal control over financial reporting. /s/ KPMG LLP Denver, Colorado February 26, 2015 F-31 |
|
|
LIBERTY INTERACTIVE CORPORATION AND SUBSIDIARIES Consolidated Balance Sheets December 31, 2014 and 2013 2014 2013 Assets amounts in millions Current assets: Cash and cash equivalents . . . . . . . . . . . . . . . . . . . . . . . . . . . . . . . . . . . . . . . . . . . . . . . . . . . . . . $ 2,306 902 Trade and other receivables, net . . . . . . . . . . . . . . . . . . . . . . . . . . . . . . . . . . . . . . . . . . . . . . . . . . 1,232 1,152 Inventory, net . . . . . . . . . . . . . . . . . . . . . . . . . . . . . . . . . . . . . . . . . . . . . . . . . . . . . . . . . . . . . . . . . 1,049 1,123 Short-term marketable securities . . . . . . . . . . . . . . . . . . . . . . . . . . . . . . . . . . . . . . . . . . . . . . . . . 889 412 Other current assets . . . . . . . . . . . . . . . . . . . . . . . . . . . . . . . . . . . . . . . . . . . . . . . . . . . . . . . . . . . . 72 184 Current assets of discontinued operations . . . . . . . . . . . . . . . . . . . . . . . . . . . . . . . . . . . . . . . . . . — 653 Total current assets . . . . . . . . . . . . . . . . . . . . . . . . . . . . . . . . . . . . . . . . . . . . . . . . . . . . . . . . . . . 5,548 4,426 Investments in available-for-sale securities and other cost investments (note 7) . . . . . . . . . . . . 1,224 1,313 Investments in affiliates, accounted for using the equity method (note 8) . . . . . . . . . . . . . . . . . 1,633 1,237 Property and equipment, at cost . . . . . . . . . . . . . . . . . . . . . . . . . . . . . . . . . . . . . . . . . . . . . . . . . . . 2,030 2,201 Accumulated depreciation . . . . . . . . . . . . . . . . . . . . . . . . . . . . . . . . . . . . . . . . . . . . . . . . . . . . . . . (937) (993) 1,093 1,208 Intangible assets not subject to amortization (note 9): Goodwill . . . . . . . . . . . . . . . . . . . . . . . . . . . . . . . . . . . . . . . . . . . . . . . . . . . . . . . . . . . . . . . . . . . 5,404 5,872 Trademarks . . . . . . . . . . . . . . . . . . . . . . . . . . . . . . . . . . . . . . . . . . . . . . . . . . . . . . . . . . . . . . . . . 2,489 2,511 7,893 8,383 Intangible assets subject to amortization, net (note 9) . . . . . . . . . . . . . . . . . . . . . . . . . . . . . . . . . 1,185 1,587 Other assets, at cost, net of accumulated amortization . . . . . . . . . . . . . . . . . . . . . . . . . . . . . . . . . 65 80 Noncurrent assets of discontinued operations . . . . . . . . . . . . . . . . . . . . . . . . . . . . . . . . . . . . . . . . — 6,442 Total assets . . . . . . . . . . . . . . . . . . . . . . . . . . . . . . . . . . . . . . . . . . . . . . . . . . . . . . . . . . . . . . . . . $ 18,641 24,676 (continued) F-32 |
|
|
LIBERTY INTERACTIVE CORPORATION AND SUBSIDIARIES Consolidated Balance Sheets (Continued) December 31, 2014 and 2013 2014 2013 amounts in millions Liabilities and Equity Current liabilities: Accounts payable . . . . . . . . . . . . . . . . . . . . . . . . . . . . . . . . . . . . . . . . . . . . . . . . . . . . . . . . . . . $ 735 606 Accrued liabilities. . . . . . . . . . . . . . . . . . . . . . . . . . . . . . . . . . . . . . . . . . . . . . . . . . . . . . . . . . . 743 903 Current portion of debt (note 10) . . . . . . . . . . . . . . . . . . . . . . . . . . . . . . . . . . . . . . . . . . . . . . 946 909 Deferred income tax liabilities (note 11) . . . . . . . . . . . . . . . . . . . . . . . . . . . . . . . . . . . . . . . . 972 925 Other current liabilities . . . . . . . . . . . . . . . . . . . . . . . . . . . . . . . . . . . . . . . . . . . . . . . . . . . . . . 343 148 Current liabilities of discontinued operations . . . . . . . . . . . . . . . . . . . . . . . . . . . . . . . . . . . . . — 265 Total current liabilities . . . . . . . . . . . . . . . . . . . . . . . . . . . . . . . . . . . . . . . . . . . . . . . . . . . . 3,739 3,756 Long-term debt, including $2,574 million and $2,355 million measured at fair value (note 10) . . . . . . . . . . . . . . . . . . . . . . . . . . . . . . . . . . . . . . . . . . . . . . . . . . . . . . . . . . . . . . . . . . . 7,105 6,106 Deferred income tax liabilities (note 11) . . . . . . . . . . . . . . . . . . . . . . . . . . . . . . . . . . . . . . . . . . . 1,849 2,001 Other liabilities . . . . . . . . . . . . . . . . . . . . . . . . . . . . . . . . . . . . . . . . . . . . . . . . . . . . . . . . . . . . . . . 168 191 Noncurrent liabilities of discontinued operations . . . . . . . . . . . . . . . . . . . . . . . . . . . . . . . . . . . . — 1,187 Total liabilities . . . . . . . . . . . . . . . . . . . . . . . . . . . . . . . . . . . . . . . . . . . . . . . . . . . . . . . . . . . . . 12,861 13,241 Equity Stockholders' equity (note 12): Preferred stock, $.01 par value. Authorized 50,000,000 shares; no shares issued . . . . . . . . — — Series A Liberty Interactive common stock, $.01 par value. Authorized 4,000,000,000 shares; issued and outstanding 447,451,702 shares at December 31, 2014 and 471,625,030 shares at December 31, 2013 . . . . . . . . . . . . . . . . . . . . . . . . . . . . . 5 5 Series B Liberty Interactive common stock, $.01 par value. Authorized 150,000,000 shares; issued and outstanding 28,877,554 shares at December 31, 2014 and 28,884,103 shares at December 31, 2013 . . . . . . . . . . . . . . . . . . . . . . . . . . . . . . . . . . . . . . . — — Series A Liberty Ventures common stock, $.01 par value. Authorized 200,000,000 shares; issued and outstanding 134,525,874 shares at December 31, 2014 and 70,761,208 shares at December 31, 2013 . . . . . . . . . . . . . . . . . . . . . . . . . . . . . . 1 1 Series B Liberty Ventures common stock, $.01 par value. Authorized 7,500,000 shares; issued and outstanding 6,991,127 shares at December 31, 2014 and 2,885,378 shares at December 31, 2013 . . . . . . . . . . . . . . . . . . . . . . . . . . . . . . . . . . . . . . . . . . . . . . . . . . . . . . — — Additional paid-in capital . . . . . . . . . . . . . . . . . . . . . . . . . . . . . . . . . . . . . . . . . . . . . . . . . . . . 4 1,146 Accumulated other comprehensive earnings (loss), net of taxes . . . . . . . . . . . . . . . . . . . . . (94) 99 Retained earnings . . . . . . . . . . . . . . . . . . . . . . . . . . . . . . . . . . . . . . . . . . . . . . . . . . . . . . . . . . . 5,757 5,685 Total stockholders' equity . . . . . . . . . . . . . . . . . . . . . . . . . . . . . . . . . . . . . . . . . . . . . . . . . . 5,673 6,936 Noncontrolling interests in equity of subsidiaries . . . . . . . . . . . . . . . . . . . . . . . . . . . . . . . . . . . . 107 4,499 Total equity . . . . . . . . . . . . . . . . . . . . . . . . . . . . . . . . . . . . . . . . . . . . . . . . . . . . . . . . . . . . . . . . 5,780 11,435 Commitments and contingencies (note 17) Total liabilities and equity . . . . . . . . . . . . . . . . . . . . . . . . . . . . . . . . . . . . . . . . . . . . . . . . . . . . $ 18,641 24,676 See accompanying notes to consolidated financial statements. F-33 |
|
|
LIBERTY INTERACTIVE CORPORATION AND SUBSIDIARIES Consolidated Statements Of Operations Years ended December 31, 2014, 2013 and 2012 2014 2013 2012 amounts in millions, except per share amounts Total revenue, net . . . . . . . . . . . . . . . . . . . . . . . . . . . . . . . . . . . . . . . . . . . . . . . . . . . . . . . . $ 10,499 10,219 9,888 Operating costs and expenses: Cost of retail sales (exclusive of depreciation shown separately below) . . . . . . . . . . . 6,684 6,533 6,307 Operating expense . . . . . . . . . . . . . . . . . . . . . . . . . . . . . . . . . . . . . . . . . . . . . . . . . . . . . . . 891 862 819 Selling, general and administrative, including stock-based compensation (note 3). . . 1,067 1,029 955 Depreciation and amortization . . . . . . . . . . . . . . . . . . . . . . . . . . . . . . . . . . . . . . . . . . . . . 662 629 591 Impairment of intangible assets . . . . . . . . . . . . . . . . . . . . . . . . . . . . . . . . . . . . . . . . . . . . 7 30 53 9,311 9,083 8,725 Operating income . . . . . . . . . . . . . . . . . . . . . . . . . . . . . . . . . . . . . . . . . . . . . . . . . . . . . . . . 1,188 1,136 1,163 Other income (expense): Interest expense . . . . . . . . . . . . . . . . . . . . . . . . . . . . . . . . . . . . . . . . . . . . . . . . . . . . . . . . . (387) (380) (466) Share of earnings (losses) of affiliates, net (note 8) . . . . . . . . . . . . . . . . . . . . . . . . . . . . 39 33 47 Realized and unrealized gains (losses) on financial instruments, net (note 6) . . . . . . . (57) (22) (351) Gains (losses) on transactions, net . . . . . . . . . . . . . . . . . . . . . . . . . . . . . . . . . . . . . . . . . . 74 (1) 443 Other, net . . . . . . . . . . . . . . . . . . . . . . . . . . . . . . . . . . . . . . . . . . . . . . . . . . . . . . . . . . . . . . (21) (29) 47 (352) (399) (280) Earnings (loss) from continuing operations before income taxes . . . . . . . . . . . . . . . . . . 836 737 883 Income tax (expense) benefit (note 11) . . . . . . . . . . . . . . . . . . . . . . . . . . . . . . . . . . . . . . (258) (183) (278) Earnings (loss) from continuing operations . . . . . . . . . . . . . . . . . . . . . . . . . . . . . . . . . . . . 578 554 605 Earnings (loss) from discontinued operations, net of taxes (note 5) . . . . . . . . . . . . . . . 48 26 986 Net earnings (loss) . . . . . . . . . . . . . . . . . . . . . . . . . . . . . . . . . . . . . . . . . . . . . . . . . . . . . . . . 626 580 1,591 Less net earnings (loss) attributable to the noncontrolling interests . . . . . . . . . . . . . . . 89 79 61 Net earnings (loss) attributable to Liberty Interactive Corporation shareholders. . . . . . $ 537 501 1,530 Net earnings (loss) attributable to Liberty Interactive Corporation shareholders: Liberty Interactive Corporation common stock . . . . . . . . . . . . . . . . . . . . . . . . . . . . . . . NA NA 294 Liberty Interactive common stock . . . . . . . . . . . . . . . . . . . . . . . . . . . . . . . . . . . . . . . . . . 520 438 212 Liberty Ventures common stock . . . . . . . . . . . . . . . . . . . . . . . . . . . . . . . . . . . . . . . . . . . 17 63 1,024 $ 537 501 1,530 Basic net earnings (loss) from continuing operations attributable to Liberty Interactive Corporation shareholders per common share (note 3): Series A and Series B Liberty Interactive Corporation common stock . . . . . . . . . . . NA NA — Series A and Series B Liberty Interactive common stock . . . . . . . . . . . . . . . . . . . . . . $ 1.10 0.88 0.48 Series A and Series B Liberty Ventures common stock . . . . . . . . . . . . . . . . . . . . . . . . $ 0.03 0.74 4.26 Diluted net earnings (loss) from continuing operations attributable to Liberty Interactive Corporation shareholders per common share (note 3): Series A and Series B Liberty Interactive Corporation common stock . . . . . . . . . . . NA NA — Series A and Series B Liberty Interactive common stock . . . . . . . . . . . . . . . . . . . . . . $ 1.09 0.86 0.47 Series A and Series B Liberty Ventures common stock . . . . . . . . . . . . . . . . . . . . . . . . $ 0.03 0.73 4.19 Basic net earnings (loss) attributable to Liberty Interactive Corporation shareholders per common share (note 3): Series A and Series B Liberty Interactive Corporation common stock . . . . . . . . . . . NA NA 0.53 Series A and Series B Liberty Interactive common stock . . . . . . . . . . . . . . . . . . . . . . $ 1.07 0.85 0.39 Series A and Series B Liberty Ventures common stock . . . . . . . . . . . . . . . . . . . . . . . . $ 0.19 0.86 15.52 Diluted net earnings (loss) attributable to Liberty Interactive Corporation shareholders per common share (note 3): Series A and Series B Liberty Interactive Corporation common stock . . . . . . . . . . . NA NA 0.52 Series A and Series B Liberty Interactive common stock . . . . . . . . . . . . . . . . . . . . . . $ 1.06 0.83 0.38 Series A and Series B Liberty Ventures common stock . . . . . . . . . . . . . . . . . . . . . . . . $ 0.19 0.85 15.28 See accompanying notes to consolidated financial statements. F-34 |
|
|
LIBERTY INTERACTIVE CORPORATION AND SUBSIDIARIES Consolidated Statements Of Comprehensive Earnings (Loss) Years ended December 31, 2014, 2013 and 2012 2014 2013 2012 amounts in millions Net earnings (loss) . . . . . . . . . . . . . . . . . . . . . . . . . . . . . . . . . . . . . . . . . . . . . . . . . . . . . . . $ 626 580 1,591 Other comprehensive earnings (loss), net of taxes: Foreign currency translation adjustments . . . . . . . . . . . . . . . . . . . . . . . . . . . . . . . . . . . (192) (73) (26) Share of other comprehensive earnings (loss) of equity affiliates . . . . . . . . . . . . . . . . (18) 2 3 Other comprehensive earnings (loss) from discontinued operations . . . . . . . . . . . . . . (1) (3) 1 Other comprehensive earnings (loss) . . . . . . . . . . . . . . . . . . . . . . . . . . . . . . . . . . . . . (211) (74) (22) Comprehensive earnings (loss). . . . . . . . . . . . . . . . . . . . . . . . . . . . . . . . . . . . . . . . . . . . . 415 506 1,569 Less comprehensive earnings (loss) attributable to the noncontrolling interests . . . . 77 54 43 Comprehensive earnings (loss) attributable to Liberty Interactive Corporation shareholders . . . . . . . . . . . . . . . . . . . . . . . . . . . . . . . . . . . . . . . . . . . . . . . . . . . . . . . . . . $ 338 452 1,526 Comprehensive earnings (loss) attributable to Liberty Interactive Corporation shareholders: Liberty Interactive Corporation common stock . . . . . . . . . . . . . . . . . . . . . . . . . . . . . NA NA 277 Liberty Interactive common stock . . . . . . . . . . . . . . . . . . . . . . . . . . . . . . . . . . . . . . . . $ 336 387 222 Liberty Ventures common stock . . . . . . . . . . . . . . . . . . . . . . . . . . . . . . . . . . . . . . . . . 2 65 1,027 $ 338 452 1,526 See accompanying notes to consolidated financial statements. F-35 |
|
|
LIBERTY INTERACTIVE CORPORATION AND SUBSIDIARIES Consolidated Statements Of Cash Flows Years ended December 31, 2014, 2013 and 2012 2014 2013 2012 amounts in millions (See note 4) Cash flows from operating activities: Net earnings (loss) . . . . . . . . . . . . . . . . . . . . . . . . . . . . . . . . . . . . . . . . . . . . . . . . . . . . . . . . . . $ 626 580 1,591 Adjustments to reconcile net earnings to net cash provided by operating activities: (Earnings) loss from discontinued operations . . . . . . . . . . . . . . . . . . . . . . . . . . . . . . . . . . . . (48) (26) (986) Depreciation and amortization . . . . . . . . . . . . . . . . . . . . . . . . . . . . . . . . . . . . . . . . . . . . . . . . 662 629 591 Stock-based compensation . . . . . . . . . . . . . . . . . . . . . . . . . . . . . . . . . . . . . . . . . . . . . . . . . . . 108 118 91 Cash payments for stock-based compensation . . . . . . . . . . . . . . . . . . . . . . . . . . . . . . . . . . . . (15) (8) (12) Excess tax benefit from stock-based compensation . . . . . . . . . . . . . . . . . . . . . . . . . . . . . . . . (21) (13) (64) Noncash interest expense . . . . . . . . . . . . . . . . . . . . . . . . . . . . . . . . . . . . . . . . . . . . . . . . . . . . 6 13 9 Share of (earnings) losses of affiliates, net . . . . . . . . . . . . . . . . . . . . . . . . . . . . . . . . . . . . . . . (39) (33) (47) Cash receipts from returns on equity investments . . . . . . . . . . . . . . . . . . . . . . . . . . . . . . . . . 45 35 45 Realized and unrealized (gains) losses on financial instruments, net . . . . . . . . . . . . . . . . . . . 57 22 351 (Gains) losses on transactions, net . . . . . . . . . . . . . . . . . . . . . . . . . . . . . . . . . . . . . . . . . . . . . (74) 1 (443) (Gains) losses on extinguishment of debt . . . . . . . . . . . . . . . . . . . . . . . . . . . . . . . . . . . . . . . . 48 57 — Impairment of intangible assets . . . . . . . . . . . . . . . . . . . . . . . . . . . . . . . . . . . . . . . . . . . . . . . 7 30 53 Deferred income tax expense (benefit) . . . . . . . . . . . . . . . . . . . . . . . . . . . . . . . . . . . . . . . . . . (41) (22) (54) Other noncash charges (credits), net . . . . . . . . . . . . . . . . . . . . . . . . . . . . . . . . . . . . . . . . . . . . (2) (3) 2 Changes in operating assets and liabilities Current and other assets . . . . . . . . . . . . . . . . . . . . . . . . . . . . . . . . . . . . . . . . . . . . . . . . . . . . (84) (84) (78) Payables and other liabilities . . . . . . . . . . . . . . . . . . . . . . . . . . . . . . . . . . . . . . . . . . . . . . . . 405 (269) 398 Net cash provided (used) by operating activities . . . . . . . . . . . . . . . . . . . . . . . . . . . . . . . . 1,640 1,027 1,447 Cash flows from investing activities: Cash proceeds from dispositions of investments . . . . . . . . . . . . . . . . . . . . . . . . . . . . . . . . . . . . 163 1,137 692 Proceeds (payments) from settlement of financial instruments, net . . . . . . . . . . . . . . . . . . . . . — — (258) Investment in and loans to cost and equity investees . . . . . . . . . . . . . . . . . . . . . . . . . . . . . . . . (91) (384) (236) Capital expended for property and equipment . . . . . . . . . . . . . . . . . . . . . . . . . . . . . . . . . . . . . (241) (291) (333) Cash (paid) for acquisitions, net of cash acquired . . . . . . . . . . . . . . . . . . . . . . . . . . . . . . . . . . . — (24) (83) Purchases of short term investments and other marketable securities . . . . . . . . . . . . . . . . . . . . (864) (959) (58) Sales of short term investments and other marketable securities . . . . . . . . . . . . . . . . . . . . . . . 591 400 46 Other investing activities, net . . . . . . . . . . . . . . . . . . . . . . . . . . . . . . . . . . . . . . . . . . . . . . . . . . (16) (41) (39) Net cash provided (used) by investing activities . . . . . . . . . . . . . . . . . . . . . . . . . . . . . . . . . . (458) (162) (269) Cash flows from financing activities: Borrowings of debt . . . . . . . . . . . . . . . . . . . . . . . . . . . . . . . . . . . . . . . . . . . . . . . . . . . . . . . . . . 4,506 4,361 2,305 Repayments of debt . . . . . . . . . . . . . . . . . . . . . . . . . . . . . . . . . . . . . . . . . . . . . . . . . . . . . . . . . . (3,749) (5,415) (1,500) Repurchases of Liberty Interactive common stock . . . . . . . . . . . . . . . . . . . . . . . . . . . . . . . . . . (785) (1,089) (815) Proceeds from rights offering . . . . . . . . . . . . . . . . . . . . . . . . . . . . . . . . . . . . . . . . . . . . . . . . . . — — 328 Minimum withholding taxes on net share settlements of stock-based compensation . . . . . . . . (26) (21) (128) Excess tax benefit from stock-based compensation . . . . . . . . . . . . . . . . . . . . . . . . . . . . . . . . . 21 13 64 Other financing activities, net . . . . . . . . . . . . . . . . . . . . . . . . . . . . . . . . . . . . . . . . . . . . . . . . . . (33) (57) (5) Net cash provided (used) by financing activities . . . . . . . . . . . . . . . . . . . . . . . . . . . . . . . . . . (66) (2,208) 249 Effect of foreign currency exchange rates on cash . . . . . . . . . . . . . . . . . . . . . . . . . . . . . . . . . . . (46) (24) (20) Net cash provided (used) by discontinued operations: Cash provided (used) by operating activities . . . . . . . . . . . . . . . . . . . . . . . . . . . . . . . . . . . . . . 273 333 (15) Cash provided (used) by investing activities . . . . . . . . . . . . . . . . . . . . . . . . . . . . . . . . . . . . . . . (194) (198) 422 Cash provided (used) by financing activities . . . . . . . . . . . . . . . . . . . . . . . . . . . . . . . . . . . . . . 371 (172) (1) Change in available cash held by discontinued operations . . . . . . . . . . . . . . . . . . . . . . . . . . . . (116) 15 (368) Net cash provided (used) by discontinued operations . . . . . . . . . . . . . . . . . . . . . . . . . . . . . . 334 (22) 38 Net increase (decrease) in cash and cash equivalents . . . . . . . . . . . . . . . . . . . . . . . . . . . . . 1,404 (1,389) 1,445 Cash and cash equivalents at beginning of period . . . . . . . . . . . . . . . . . . . . . . . . . . . . . . . . 902 2,291 846 Cash and cash equivalents at end of period . . . . . . . . . . . . . . . . . . . . . . . . . . . . . . . . . . . . . $ 2,306 902 2,291 See accompanying notes to consolidated financial statements. F-36 |
|
|
LIBERTY INTERACTIVE CORPORATION AND SUBSIDIARIES Consolidated Statement Of Equity Years ended December 31, 2014, 2013 and 2012 Stockholders' Equity Liberty Liberty Accumulated Noncontrolling Interactive Ventures Additional other interest in Preferred paid-in comprehensive Retained equity of Total Stock Series A Series B Series A Series B capital earnings Earnings subsidiaries equity amounts in millions Balance at January 1, 2012 . . . . . . . . . . . . . . . . . . . . . . . . . . . . . . . . . . . . . . . . . . . . . . . . . . . . $ — 6 — 1 — 2,680 152 3,654 134 6,627 Net earnings . . . . . . . . . . . . . . . . . . . . . . . . . . . . . . . . . . . . . . . . . . . . . . . . . . . . . . . . . . . . . — — — — — — — 1,530 61 1,591 Other comprehensive earnings (loss) . . . . . . . . . . . . . . . . . . . . . . . . . . . . . . . . . . . . . . . . . . . — — — — — — (4) — (18) (22) Stock-based compensation . . . . . . . . . . . . . . . . . . . . . . . . . . . . . . . . . . . . . . . . . . . . . . . . . . . — — — — — 76 — — — 76 Minimum withholding taxes on net share settlements of stock-based compensation. . . . . . . . . — — — — — (128) — — — (128) Excess tax benefits on stock-based compensation . . . . . . . . . . . . . . . . . . . . . . . . . . . . . . . . . . — — — — — 64 — — — 64 Stock issued upon exercise of stock options . . . . . . . . . . . . . . . . . . . . . . . . . . . . . . . . . . . . . . — — — — — 28 — — — 28 Series A Liberty Interactive stock repurchases . . . . . . . . . . . . . . . . . . . . . . . . . . . . . . . . . . . . — (1) — — — (814) — — — (815) Series A Liberty Ventures stock issued for rights offering . . . . . . . . . . . . . . . . . . . . . . . . . . . . — — — — — 328 — — — 328 Noncontrolling interest recognized with acquisition of a controlling interest in a subsidiary. . . — — — — — — — — 4,341 4,341 Distribution to noncontrolling interest . . . . . . . . . . . . . . . . . . . . . . . . . . . . . . . . . . . . . . . . . . — — — — — — — — (29) (29) Other . . . . . . . . . . . . . . . . . . . . . . . . . . . . . . . . . . . . . . . . . . . . . . . . . . . . . . . . . . . . . . . . . . — — — — — (10) — — — (10) Balance at December 31, 2012 . . . . . . . . . . . . . . . . . . . . . . . . . . . . . . . . . . . . . . . . . . . . . . . . . $ — 5 — 1 — 2,224 148 5,184 4,489 12,051 Net earnings . . . . . . . . . . . . . . . . . . . . . . . . . . . . . . . . . . . . . . . . . . . . . . . . . . . . . . . . . . . . . — — — — — — — 501 79 580 Other comprehensive earnings (loss) . . . . . . . . . . . . . . . . . . . . . . . . . . . . . . . . . . . . . . . . . . . — — — — — — (49) — (25) (74) Stock-based compensation . . . . . . . . . . . . . . . . . . . . . . . . . . . . . . . . . . . . . . . . . . . . . . . . . . . — — — — — 93 — — 49 142 Minimum withholding taxes on net share settlements of stock-based compensation. . . . . . . . . — — — — — (38) — — — (38) Excess tax benefits on stock-based compensation . . . . . . . . . . . . . . . . . . . . . . . . . . . . . . . . . . — — — — — 23 — — — 23 Stock issued upon exercise of stock options . . . . . . . . . . . . . . . . . . . . . . . . . . . . . . . . . . . . . . — — — — — 5 — — — 5 Series A Liberty Interactive stock repurchases . . . . . . . . . . . . . . . . . . . . . . . . . . . . . . . . . . . . — — — — — (1,089) — — — (1,089) Distribution to noncontrolling interest . . . . . . . . . . . . . . . . . . . . . . . . . . . . . . . . . . . . . . . . . . — — — — — — — — (45) (45) Shares repurchased by subsidiary . . . . . . . . . . . . . . . . . . . . . . . . . . . . . . . . . . . . . . . . . . . . . . — — — — — (63) — — (82) (145) Shares issued by subsidiary . . . . . . . . . . . . . . . . . . . . . . . . . . . . . . . . . . . . . . . . . . . . . . . . . . — — — — — (7) — — 34 27 Other . . . . . . . . . . . . . . . . . . . . . . . . . . . . . . . . . . . . . . . . . . . . . . . . . . . . . . . . . . . . . . . . . . — — — — — (2) — — — (2) Balance at December 31, 2013 . . . . . . . . . . . . . . . . . . . . . . . . . . . . . . . . . . . . . . . . . . . . . . . . . $ — 5 — 1 — 1,146 99 5,685 4,499 11,435 Net earnings . . . . . . . . . . . . . . . . . . . . . . . . . . . . . . . . . . . . . . . . . . . . . . . . . . . . . . . . . . . . . — — — — — — — 537 89 626 Other comprehensive earnings (loss) . . . . . . . . . . . . . . . . . . . . . . . . . . . . . . . . . . . . . . . . . . . — — — — — — (199) — (12) (211) Stock-based compensation . . . . . . . . . . . . . . . . . . . . . . . . . . . . . . . . . . . . . . . . . . . . . . . . . . . — — — — — 103 — — 39 142 Minimum withholding taxes on net share settlements of stock-based compensation. . . . . . . . . — — — — — (58) — — — (58) Excess tax benefits on stock-based compensation . . . . . . . . . . . . . . . . . . . . . . . . . . . . . . . . . . — — — — — 35 — — — 35 Stock issued upon exercise of stock options . . . . . . . . . . . . . . . . . . . . . . . . . . . . . . . . . . . . . . — — — — — 36 — — — 36 Series A Liberty Interactive stock repurchases . . . . . . . . . . . . . . . . . . . . . . . . . . . . . . . . . . . . — — — — — (785) — — — (785) Distribution to noncontrolling interest . . . . . . . . . . . . . . . . . . . . . . . . . . . . . . . . . . . . . . . . . . — — — — — — — — (42) (42) Shares issued by subsidiary . . . . . . . . . . . . . . . . . . . . . . . . . . . . . . . . . . . . . . . . . . . . . . . . . . — — — — — (8) — — 8 — Distribution of Liberty TripAdvisor Holdings, Inc. . . . . . . . . . . . . . . . . . . . . . . . . . . . . . . . . . — — — — — (465) 6 (465) (4,474) (5,398) Other . . . . . . . . . . . . . . . . . . . . . . . . . . . . . . . . . . . . . . . . . . . . . . . . . . . . . . . . . . . . . . . . . . — — — — — — — — — — Balance at December 31, 2014 . . . . . . . . . . . . . . . . . . . . . . . . . . . . . . . . . . . . . . . . . . . . . . . . . $ — 5 — 1 — 4 (94) 5,757 107 5,780 See accompanying notes to consolidated financial statements. F-37 |
|
|
LIBERTY INTERACTIVE CORPORATION AND SUBSIDIARIES Notes to Consolidated Financial Statements December 31, 2014, 2013 and 2012 (1) Basis of Presentation The accompanying consolidated financial statements include the accounts of Liberty Interactive Corporation (formerly known as Liberty Media Corporation) and its controlled subsidiaries (collectively, "Liberty" or the "Company" unless the context otherwise requires). All significant intercompany accounts and transactions have been eliminated in consolidation. Liberty, through its ownership of interests in subsidiaries and other companies, is primarily engaged in the video and on-line commerce industries in North America, Europe and Asia. As further discussed in note 5, on August 27, 2014, Liberty completed the spin-off to holders of its Liberty Ventures common stock shares of its former wholly-owned subsidiary, Liberty TripAdvisor Holdings, Inc. (“TripAdvisor Holdings”) (the “TripAdvisor Holdings Spin-Off”). TripAdvisor Holdings is comprised of Liberty’s former 22% economic and 57% voting interest in TripAdvisor, Inc. (“TripAdvisor”) as well as BuySeasons, Inc. (“BuySeasons”), Liberty’s former whollyowned subsidiary, and a corporate level net debt balance of $350 million. In connection with the TripAdvisor Holdings Spin-Off during August 2014, TripAdvisor Holdings drew down $400 million in margin loans and distributed approximately $350 million to Liberty. This transaction has been recorded at historical cost due to the pro rata nature of the distribution. Following the completion of the TripAdvisor Holdings Spin-Off, Liberty and TripAdvisor Holdings operate as separate, publicly traded companies, and neither has any stock ownership, beneficial or otherwise, in the other. The consolidated financial statements of Liberty have been prepared to reflect TripAdvisor Holdings as discontinued operations. Accordingly, the assets and liabilities, revenue, costs and expenses, and cash flows of the businesses, assets and liabilities owned by TripAdvisor Holdings at the time of the TripAdvisor Holdings Spin-Off have been excluded from the respective captions in the accompanying consolidated balance sheets, statements of operations, comprehensive earnings (loss) and cash flows in such consolidated financial statements. Additionally, on October 3, 2014, Liberty announced that its board of directors approved the change in attribution from the Interactive Group (which we refer to as the QVC Group) to the Ventures Group of its Digital Commerce companies (defined below) and cash. The reattributed Digital Commerce companies are comprised of Liberty’s subsidiaries Backcountry.com, Inc. (“Backcountry”), Bodybuilding.com, LLC (“Bodybuilding”), CommerceHub, Evite, Inc. (“Evite”), Provide Commerce, Inc. (“Provide”) and LMC Right Start, Inc. (“Right Start”) (collectively, the “Digital Commerce” companies). See note 2 for additional information on the reattribution. F-38 |
|
|
LIBERTY INTERACTIVE CORPORATION AND SUBSIDIARIES Notes to Consolidated Financial Statements (Continued) December 31, 2014, 2013 and 2012 On December 31, 2014, Liberty announced the closing of the acquisition by FTD Companies, Inc. ("FTD") of Provide (the “FTD Transaction”). Under the terms of the transaction, Liberty received approximately 10.2 million shares of FTD common stock representing approximately 35% of the combined company and approximately $145 million in cash. We recognized a gain of $75 million as a result of this transaction, which is included in the Gains (losses) on transactions, net line item in the consolidated statement of operations. Subsequent to completion of the transaction, Liberty accounts for FTD as an equity-method affiliate based on the ownership level and board representation. The FTD Transaction resulted in a non-cash investing addition of $355 million to the investments in affiliates, accounted for using the equity method line item within the consolidated balance sheets. Given our significant continuing involvement with FTD, Provide is not presented as a discontinued operation in the consolidated financial statements of Liberty. As of December 31, 2013, the assets and liabilities subject to the sale are comprised of the following (amounts in millions): December 31, 2013 Current assets. . . . . . . . . . . . . . . . . . . . . . . . . . . . . . . . . . . . . . . . . . . . . . . . . . . . . . . $ 87 Property & equipment, net . . . . . . . . . . . . . . . . . . . . . . . . . . . . . . . . . . . . . . . . . . . . $ 32 Goodwill . . . . . . . . . . . . . . . . . . . . . . . . . . . . . . . . . . . . . . . . . . . . . . . . . . . . . . . . . . $ 338 Trademarks . . . . . . . . . . . . . . . . . . . . . . . . . . . . . . . . . . . . . . . . . . . . . . . . . . . . . . . . $ 22 Other intangible assets, net . . . . . . . . . . . . . . . . . . . . . . . . . . . . . . . . . . . . . . . . . . . . $ 31 Other assets . . . . . . . . . . . . . . . . . . . . . . . . . . . . . . . . . . . . . . . . . . . . . . . . . . . . . . . . $ 13 Current liabilities . . . . . . . . . . . . . . . . . . . . . . . . . . . . . . . . . . . . . . . . . . . . . . . . . . . . $ 91 Net deferred tax liability . . . . . . . . . . . . . . . . . . . . . . . . . . . . . . . . . . . . . . . . . . . . . . $ 8 Other liabilities . . . . . . . . . . . . . . . . . . . . . . . . . . . . . . . . . . . . . . . . . . . . . . . . . . . . . $ 9 These net assets are not deemed material for isolated presentation as assets and liabilities held for sale in our consolidated balance sheet as of December 31, 2013. Accordingly, these net assets are included in the above captions in the consolidated balance sheet as of December 31, 2013. On September 23, 2011, Liberty completed the split-off of a wholly owned subsidiary, Liberty Media Corporation ("LMC") (formerly known as Liberty CapStarz, Inc. and prior thereto known as Liberty Splitco, Inc.) (the "LMC Split- Off"). Prior to the LMC Split-Off, Liberty's equity was structured into three separate tracking stocks, Liberty Interactive common stock, Liberty Starz common stock and Liberty Capital common stock, which were intended to track and reflect the economic performance of the separate businesses, assets and liabilities attributed to each group. These attributed businesses, assets and liabilities were not separate legal entities and therefore no group could own assets, issue securities or enter into legally binding agreements. Holders of the tracking stocks did not have direct claim to the group's stock or assets and were not represented by separate boards of directors. At the time of the LMC Split-Off, LMC owned all the assets, businesses and liabilities previously attributed to the Liberty Capital and Liberty Starz tracking stock groups. The LMC Split-Off was effected by means of a redemption of all of the Liberty Capital common stock and Liberty Starz common stock of Liberty in exchange for the common stock of LMC. This transaction was accounted for at historical cost due to the pro rata nature of the distribution. Following the LMC Split-Off, Liberty and LMC operate as separate, publicly traded companies, and neither has any stock ownership, beneficial or otherwise, in the other. In connection with the LMC Split-Off, Liberty and LMC entered F-39 |
|
|
LIBERTY INTERACTIVE CORPORATION AND SUBSIDIARIES Notes to Consolidated Financial Statements (Continued) December 31, 2014, 2013 and 2012 into certain agreements in order to govern certain of the ongoing relationships between the two companies after the LMC Split-Off and to provide for an orderly transition. These agreements include a Reorganization Agreement, a Services Agreement, a Facilities Sharing Agreement and a Tax Sharing Agreement. The Tax Sharing Agreement provides for the allocation and indemnification of tax liabilities and benefits between Liberty and LMC and other agreements related to tax matters. Liberty is party to on-going discussions with the IRS under the Compliance Assurance Process audit program. The IRS may propose adjustments that relate to tax attributes allocated to and income allocable to LMC in the LMC Split-Off. Any potential outcome associated with any proposed adjustments would be covered by the Tax Sharing Agreement and are not expected to have any impact on Liberty's financial position. Pursuant to the Services Agreement, LMC will provide Liberty with general and administrative services including legal, tax, accounting, treasury and investor relations support. Liberty will reimburse LMC for direct, out-of-pocket expenses incurred by LMC in providing these services and for Liberty's allocable portion of costs associated with any shared services or personnel based on an estimated percentage of time spent providing services to Liberty. Under the Facilities Sharing Agreement, Liberty will share office space with LMC and related amenities at LMC's corporate headquarters. Under these various agreements approximately $11 million, $15 million and $12 million of these allocated expenses were reimbursed from Liberty to LMC for the years ended December 31, 2014, 2013 and 2012, respectively. (2) Tracking Stocks On August 9, 2012 Liberty completed the approved recapitalization of its common stock through the creation of the Liberty Interactive common stock and Liberty Ventures common stock as tracking stocks. In the recapitalization, each holder of Liberty Interactive Corporation common stock remained a holder of the same amount and series of Liberty Interactive common stock and received 0.05 of a share of the corresponding series of Liberty Ventures common stock, by means of a dividend, with cash issued in lieu of fractional shares of Liberty Ventures common stock. At the time of issuance of the Liberty Ventures common stock, cash of $1,346 million was reattributed to the Ventures Group from the QVC Group. The QVC Group borrowed funds under QVC's credit facility just prior to the completion of the recapitalization in order for Liberty to have an appropriate amount of cash available to be attributed to each tracking stock group. The reattribution of cash between the tracking stock groups had no consolidated impact on Liberty. On February 27, 2014, Liberty's board approved a two for one stock split of Series A and Series B Liberty Ventures common stock, effected by means of a dividend. The stock split was done in order to bring Liberty into compliance with a Nasdaq listing requirement regarding the minimum number of publicly held shares of the Series B Liberty Ventures common stock. In the stock split, a dividend was paid on April 11, 2014 of one share of Series A or Series B Liberty Ventures common stock to holders of each share of Series A or Series B Liberty Ventures common stock, respectively, held by them as of 5:00 pm, New York City time, on April 4, 2014. The stock split has been recorded retroactively for all periods presented for comparability purposes. As discussed in note 1, on October 3, 2014, Liberty announced that its board of directors approved the change in attribution from the QVC Group to the Ventures Group its Digital Commerce companies and cash, which was provided by QVC as a result of a draw-down of QVC’s credit facility. The reattribution of the Digital Commerce companies is presented F-40 |
|
|
LIBERTY INTERACTIVE CORPORATION AND SUBSIDIARIES Notes to Consolidated Financial Statements (Continued) December 31, 2014, 2013 and 2012 on a prospective basis from the date of the reattribution in Liberty’s consolidated financial statements and attributed financial information, with October 1, 2014 used as a proxy for the date of the reattribution. In exchange for the Digital Commerce companies and $970 million of cash (collectively, the "Reattributed Assets"), an inter-group interest in the Ventures Group was created in favor of the QVC Group. This inter-group interest was represented as a number of shares of Liberty Ventures common stock issuable to the QVC Group, which we refer to as the "Inter-Group Interest Shares" (as calculated below). Immediately following the reattribution on October 3, 2014, Liberty's board declared a dividend of the Inter-Group Interest Shares to the holders of Series A and Series B Liberty Interactive common stock in full elimination of the inter-group interest. In connection with the payment of the dividend, typical antidilution adjustments were made to outstanding options of Liberty Interactive common stock equity incentive awards, and the Liberty board has reattributed cash commensurate with the fair value of options assumed (outside of the Reattributed Assets) to the Ventures Group relating to its assumption of liabilities related to those awards. In the dividend, the Inter-Group Interest Shares were allocated, pro-rata, to the outstanding shares of Series A and Series B Liberty Interactive common stock at 5:00 p.m., New York City time, on October 13, 2014, the record date for the dividend, such that each holder of Liberty Interactive common stock received 0.14217 of a share of the corresponding series of Liberty Ventures common stock for each share of Liberty Interactive common stock held as of the record date, with cash paid in lieu of fractional shares. The distribution date for the dividend was on October 20, 2014, and the Liberty Interactive common stock began trading ex-dividend on October 15, 2014. The distribution resulted in 67,671,232 shares of combined Series A and Series B Liberty Ventures common stock being issued. The Inter-Group Interest Shares were allocated such that the number of shares of Series A Liberty Ventures common stock and shares of Series B Liberty Ventures common stock issued in the dividend were in the same proportion as the shares of Series A Liberty Interactive common stock and Series B Liberty Interactive common stock outstanding on the record date, with each share of Series A Liberty Interactive common stock and each share of Series B Liberty Interactive common stock receiving the same fraction of a share of Series A or Series B Liberty Ventures common stock, as the case may be. In connection with the reattribution, the Liberty Interactive tracking stock trading symbol “LINTA” was changed to "QVCA" and the "LINTB" trading symbol to "QVCB," effective October 7, 2014. Other than the issuance of Liberty Ventures shares in the fourth quarter of 2014, the reattribution of tracking stock groups has no consolidated impact on Liberty. Tracking stock is a type of common stock that the issuing company intends to reflect or "track" the economic performance of a particular business or "group," rather than the economic performance of the company as a whole. Liberty has two tracking stocks—Liberty Interactive common stock and Liberty Ventures common stock, which are intended to track and reflect the economic performance of the QVC Group and Ventures Group, respectively. While the QVC Group and the Ventures Group have separate collections of businesses, assets and liabilities attributed to them, no group is a separate legal entity and therefore cannot own assets, issue securities or enter into legally binding agreements. Holders of tracking stock have no direct claim to the group's stock or assets and are not represented by separate boards of directors. Instead, holders of tracking stock are stockholders of the parent corporation, with a single board of directors and subject to all of the risks and liabilities of the parent corporation. F-41 |
|
|
LIBERTY INTERACTIVE CORPORATION AND SUBSIDIARIES Notes to Consolidated Financial Statements (Continued) December 31, 2014, 2013 and 2012 The term "Ventures Group" does not represent a separate legal entity, rather it represents those businesses, assets and liabilities that have been attributed to that group. Following the reattribution, the Ventures Group is comprised primarily of our interests in Expedia, Inc., Interval Leisure Group, Inc., LendingTree, our Digital Commerce companies, investments in Time Warner Inc. and Time Warner Cable Inc., as well as cash in the amount of approximately $1,884 million (at December 31, 2014), including subsidiary cash. The Ventures Group also has attributed to it certain liabilities related to our Exchangeable Debentures and certain deferred tax liabilities. The Ventures Group is primarily focused on the maximization of the value of these investments and investing in new business opportunities. The term "QVC Group" does not represent a separate legal entity, rather it represents those businesses, assets and liabilities that have been attributed to that group. The QVC Group is primarily comprised of our merchandise-focused televised-shopping programs, Internet and mobile application businesses. Following the reattribution, the QVC Group has attributed to it the remainder of our businesses and assets, including our wholly-owned subsidiary QVC and our 38% interest in HSN, Inc. as well as cash in the amount of approximately $422 million (at December 31, 2014), including subsidiary cash. See Exhibit 99.1 to this Annual Report on Form 10-K for unaudited attributed financial information for Liberty's tracking stock groups. (3) Summary of Significant Accounting Policies Cash and Cash Equivalents Cash equivalents consist of investments which are readily convertible into cash and have maturities of three months or less at the time of acquisition. Receivables Receivables are reflected net of an allowance for doubtful accounts and sales returns. A provision for bad debts is provided as a percentage of accounts receivable based on historical experience and included in selling, general and administrative expense. A provision for vendor receivables are determined based on an estimate of probable expected losses and included in cost of goods sold. A summary of activity in the allowance for doubtful accounts is as follows: Balance Additions Balance beginning Charged Deductions- end of of year to expense Other write-offs year amounts in millions 2014 . . . . . . . . . . . . . . . . . . . . . . . . . . . . . . . . . . $ 86 95 (2) (87) 92 2013 . . . . . . . . . . . . . . . . . . . . . . . . . . . . . . . . . . $ 76 81 1 (72) 86 2012 . . . . . . . . . . . . . . . . . . . . . . . . . . . . . . . . . . $ 80 76 — (80) 76 Inventory Inventory, consisting primarily of products held for sale, is stated at the lower of cost or market. Cost is determined by the average cost method, which approximates the first-in, first-out method. Assessments about the realizability of inventory require the Company to make judgments based on currently available information about the likely method of disposition including sales to individual customers, returns to product vendors, liquidations and the estimated recoverable F-42 |
|
|
LIBERTY INTERACTIVE CORPORATION AND SUBSIDIARIES Notes to Consolidated Financial Statements (Continued) December 31, 2014, 2013 and 2012 values of each disposition category. Inventory is stated net of inventory obsolescence reserves of $86 million and $88 million for the years ended December 31, 2014 and 2013, respectively. Investments All marketable equity and debt securities held by the Company are classified as available-for-sale ("AFS") and are carried at fair value generally based on quoted market prices. U.S. generally accepted accounting principles ("GAAP") permit entities to choose to measure many financial instruments, such as AFS securities, and certain other items at fair value and to recognize the changes in fair value of such instruments in the entity's statement of operations (the "fair value option"). Liberty had previously entered into economic hedges for certain of its non-strategic AFS securities (although such instruments were not accounted for as fair value hedges by the Company). Changes in the fair value of these economic hedges were reflected in Liberty's statement of operations as unrealized gains (losses). In order to better match the changes in fair value of the subject AFS securities and the changes in fair value of the corresponding economic hedges in the Company's financial statements, Liberty has elected the fair value option for those of its AFS securities which it considers to be non-strategic ("Fair Value Option Securities"). Accordingly, changes in the fair value of Fair Value Option Securities, as determined by quoted market prices, are reported in realized and unrealized gains (losses) on financial instruments in the accompanying consolidated statement of operations. The total value of AFS securities for which the Company has elected the fair value option aggregated $1,220 million and $1,309 million as of December 31, 2014 and 2013, respectively. Other investments in which the Company's ownership interest is less than 20%, unless the Company has the ability to exercise significant influence, and that are not considered marketable securities are carried at cost. For those investments in affiliates in which the Company has the ability to exercise significant influence, the equity method of accounting is used. Under this method, the investment, originally recorded at cost, is adjusted to recognize the Company's share of net earnings or losses of the affiliate as they occur rather than as dividends or other distributions are received. Losses are limited to the extent of the Company's investment in, advances to and commitments for the investee. In the event the Company is unable to obtain accurate financial information from an equity affiliate in a timely manner, the Company records its share of earnings or losses of such affiliate on a lag (see note 8). The Company's share of net earnings or loss of affiliates also includes any other than temporary declines in fair value recognized during the period. Changes in the Company's proportionate share of the underlying equity of an equity method investee, which result from the issuance of additional equity securities by such equity investee, are recognized in the statement of operations through the other, net line item. To the extent there is a difference between our ownership percentage in the underlying equity of an equity method investee and our carrying value, such difference is accounted for as if the equity method investee were a consolidated subsidiary. The Company continually reviews its equity investments and its AFS securities which are not Fair Value Option Securities to determine whether a decline in fair value below the carrying value is other than temporary. The primary factors the Company considers in its determination are the length of time that the fair value of the investment is below the Company's carrying value; the severity of the decline; and the financial condition, operating performance and near term prospects of the investee. In addition, the Company considers the reason for the decline in fair value, be it general market conditions, industry specific or investee specific; analysts' ratings and estimates of 12 month share price targets for the investee; changes in stock price or valuation subsequent to the balance sheet date; and the Company's intent and ability to F-43 |
|
|
LIBERTY INTERACTIVE CORPORATION AND SUBSIDIARIES Notes to Consolidated Financial Statements (Continued) December 31, 2014, 2013 and 2012 hold the investment for a period of time sufficient to allow for a recovery in fair value. If the decline in fair value is deemed to be other than temporary, the carrying value of the security is written down to fair value. In situations where the fair value of an investment is not evident due to a lack of a public market price or other factors, the Company uses its best estimates and assumptions to arrive at the estimated fair value of such investment. The Company's assessment of the foregoing factors involves considerable management judgment and accordingly, actual results may differ materially from the Company's estimates and judgments. Writedowns for AFS securities which are not Fair Value Option Securities would be included in the consolidated statements of operations as other than temporary declines in fair values of investments. Writedowns for equity method investments would be included in share of earnings (losses) of affiliates. Derivative Instruments and Hedging Activities All of the Company's derivatives, whether designated in hedging relationships or not, are recorded on the balance sheet at fair value. If the derivative is designated as a fair value hedge, the changes in the fair value of the derivative and of the hedged item attributable to the hedged risk are recognized in earnings. If the derivative is designated as a cash flow hedge, the effective portions of changes in the fair value of the derivative are recorded in other comprehensive earnings and are recognized in the statement of operations when the hedged item affects earnings. Ineffective portions of changes in the fair value of cash flow hedges are recognized in earnings. If the derivative is not designated as a hedge, changes in the fair value of the derivative are recognized in earnings. The Company has entered into several interest rate swap agreements to mitigate the cash flow risk associated with interest payments related to certain of its variable rate debt. None of the Company's derivatives are currently designated as hedges. The fair value of the Company's derivative instruments are estimated using the Black-Scholes model. The Black- Scholes model incorporates a number of variables in determining such fair values, including expected volatility of the underlying security and an appropriate discount rate. The Company obtains volatility rates from pricing services based on the expected volatility of the underlying security over the remaining term of the derivative instrument. A discount rate is obtained at the inception of the derivative instrument and updated each reporting period in which equity collars are outstanding, based on the Company's estimate of the discount rate at which it could currently settle the derivative instrument. The Company considered its own credit risk as well as the credit risk of its counterparties in estimating the discount rate. Management judgment was required in estimating the Black-Scholes variables. F-44 |
|
|
LIBERTY INTERACTIVE CORPORATION AND SUBSIDIARIES Notes to Consolidated Financial Statements (Continued) December 31, 2014, 2013 and 2012 Property and Equipment Property and equipment consisted of the following: December 31, December 31, 2014 2013 amounts in millions Land . . . . . . . . . . . . . . . . . . . . . . . . . . . . . . . . . . . . . . . . . . . . . . . . . . . . $ 205 208 Buildings and improvements . . . . . . . . . . . . . . . . . . . . . . . . . . . . . . . . 935 976 Support equipment . . . . . . . . . . . . . . . . . . . . . . . . . . . . . . . . . . . . . . . . 847 940 Projects in progress . . . . . . . . . . . . . . . . . . . . . . . . . . . . . . . . . . . . . . . . 43 77 Total property and equipment . . . . . . . . . . . . . . . . . . . . . . . . . . . . . $ 2,030 2,201 Property and equipment, including significant improvements, is stated at cost. Depreciation is computed using the straight-line method using estimated useful lives of 2 to 15 years for support equipment and 8 to 20 years for buildings and improvements. Depreciation expense for the years ended December 31, 2014, 2013 and 2012 was $158 million, $147 million and $142 million, respectively. Intangible Assets Intangible assets with estimable useful lives are amortized over their respective estimated useful lives to their estimated residual values, and reviewed for impairment upon certain triggering events. Goodwill and other intangible assets with indefinite useful lives (collectively, "indefinite lived intangible assets") are not amortized, but instead are tested for impairment at least annually. Our annual impairment assessment of our indefinite-lived intangible assets is performed during the fourth quarter of each year. The Company utilizes a qualitative assessment for determining whether step one of the goodwill impairment analysis is necessary. The accounting guidance permits entities to first assess qualitative factors to determine whether it is more likely than not that the fair value of a reporting unit is less than its carrying amount as a basis for determining whether it is necessary to perform the two-step goodwill impairment test. In evaluating goodwill on a qualitative basis the Company reviews the business performance of each reporting unit and evaluates other relevant factors as identified in the relevant accounting guidance to determine whether it was more likely than not that an indicated impairment exists for any of our reporting units. The Company considers whether there are any negative macroeconomic conditions, industry specific conditions, market changes, increased competition, increased costs in doing business, management challenges, the legal environments and how these factors might impact company specific performance in future periods. As part of the analysis the Company also considers fair value determinations for certain reporting units that have been made at various points throughout the current year and prior year for other purposes. If a step one test is considered necessary based on the qualitative factors, the Company compares the estimated fair value of a reporting unit to its carrying value. Developing estimates of fair value requires significant judgments, including making assumptions about appropriate discount rates, perpetual growth rates, relevant comparable market multiples, public trading prices and the amount and timing of expected future cash flows. The cash flows employed in Liberty's valuation analyses are based on management's best estimates considering current marketplace factors and risks as well as assumptions of growth rates in future years. There is no assurance that actual results in the future will approximate these forecasts. For those reporting units whose carrying value exceeds the fair value, a second test is required to measure the F-45 |
|
|
LIBERTY INTERACTIVE CORPORATION AND SUBSIDIARIES Notes to Consolidated Financial Statements (Continued) December 31, 2014, 2013 and 2012 impairment loss (the "Step 2 Test"). In the Step 2 Test, the fair value (Level 3) of the reporting unit is allocated to all of the assets and liabilities of the reporting unit with any residual value being allocated to goodwill. Any excess of the carrying value of the goodwill over this allocated amount is recorded as an impairment charge. The accounting guidance also permits entities to first perform a qualitative assessment to determine whether it is more likely than not that an indefinite-lived intangible asset is impaired. If the qualitative assessment supports that it is more likely than not that the carrying value of the Company’s indefinite-lived intangible assets, other than goodwill, exceeds its fair value, then a quantitative assessment is performed. If the carrying value of an indefinite-lived intangible asset exceeds its fair value, an impairment loss is recognized in an amount equal to that excess. Impairment of Long-lived Assets The Company periodically reviews the carrying amounts of its property and equipment and its intangible assets (other than goodwill and indefinite-lived intangibles) to determine whether current events or circumstances indicate that such carrying amounts may not be recoverable. If the carrying amount of the asset group is greater than the expected undiscounted cash flows to be generated by such asset group, including its ultimate disposition, an impairment adjustment is to be recognized. Such adjustment is measured by the amount that the carrying value of such asset groups exceeds their fair value. The Company generally measures fair value by considering sale prices for similar asset groups or by discounting estimated future cash flows using an appropriate discount rate. Considerable management judgment is necessary to estimate the fair value of asset groups. Accordingly, actual results could vary significantly from such estimates. Asset groups to be disposed of are carried at the lower of their financial statement carrying amount or fair value less costs to sell. Noncontrolling Interests The Company reports noncontrolling interests of subsidiaries within equity in the balance sheet and the amount of consolidated net income attributable to the parent and to the noncontrolling interest is presented in the statement of operations. Also, changes in ownership interests in subsidiaries in which the Company maintains a controlling interest are recorded in equity. Foreign Currency Translation The functional currency of the Company is the United States (''U.S.'') dollar. The functional currency of the Company's foreign operations generally is the applicable local currency for each foreign subsidiary. Assets and liabilities of foreign subsidiaries are translated at the spot rate in effect at the applicable reporting date, and the consolidated statements of operations are translated at the average exchange rates in effect during the applicable period. The resulting unrealized cumulative translation adjustment, net of applicable income taxes, is recorded as a component of accumulated other comprehensive earnings in stockholders' equity. Transactions denominated in currencies other than the functional currency are recorded based on exchange rates at the time such transactions arise. Subsequent changes in exchange rates result in transaction gains and losses which are reflected in the accompanying consolidated statements of operations and comprehensive earnings (loss) as unrealized (based on the applicable period-end exchange rate) or realized upon settlement of the transactions. F-46 |
|
|
LIBERTY INTERACTIVE CORPORATION AND SUBSIDIARIES Notes to Consolidated Financial Statements (Continued) December 31, 2014, 2013 and 2012 Revenue Recognition Retail revenue is recognized at the time of delivery to customers. The revenue for shipments in-transit is recorded as deferred revenue and included in other current liabilities. Service revenue is recognized when the applicable criteria are met: persuasive evidence of an arrangement exists, services have been rendered, the price is fixed and determinable and collectability is reasonably assured. An allowance for returned merchandise is provided as a percentage of sales based on historical experience. The total reduction in sales due to returns for the years ended December 31, 2014, 2013 and 2012 aggregated $2,123 million, $2,134 million and $2,037 million, respectively. Sales tax collected from customers on retail sales is recorded on a net basis and is not included in revenue. In May 2014, the Financial Accounting Standards Board issued new accounting guidance on revenue from contracts with customers. The new guidance requires an entity to recognize the amount of revenue to which it expects to be entitled for the transfer of promised goods or services to customers. The updated guidance will replace most existing revenue recognition guidance in GAAP when it becomes effective and permits the use of either a retrospective or cumulative effect transition method. This guidance is effective for fiscal years, and interim periods within those fiscal years, beginning after December 15, 2016. The Company has not yet selected a transition method and is currently evaluating the effect that the updated standard will have on its revenue recognition but does not believe that the standard will significantly impact its financial statements and related disclosures. Cost of Sales Cost of sales primarily includes actual product cost, provision for obsolete inventory, buying allowances received from suppliers, shipping and handling costs and warehouse costs. Advertising Costs Advertising costs generally are expensed as incurred. Advertising expense aggregated $271 million, $258 million and $247 million for the years ended December 31, 2014, 2013 and 2012, respectively. Advertising costs are reflected in the Selling, general and administrative expense line item in our consolidated statements of operations. Stock-Based Compensation As more fully described in note 14, the Company has granted to its directors, employees and employees of its subsidiaries options, restricted stock and stock appreciation rights ("SARs") to purchase shares of Liberty Interactive and/or Liberty Ventures common stock ("Liberty common stock") (collectively, "Awards"). The Company measures the cost of employee services received in exchange for an Award of equity instruments (such as stock options and restricted stock) based on the grant-date fair value of the Award, and recognizes that cost over the period during which the employee is required to provide service (usually the vesting period of the Award). The Company measures the cost of employee services received in exchange for an Award of liability instruments (such as stock appreciation rights that will be settled in cash) based on the current fair value of the Award, and remeasures the fair value of the Award at each reporting date. F-47 |
|
|
LIBERTY INTERACTIVE CORPORATION AND SUBSIDIARIES Notes to Consolidated Financial Statements (Continued) December 31, 2014, 2013 and 2012 Stock compensation expense was $108 million, $118 million and $91 million for the years ended December 31, 2014, 2013 and 2012, respectively, included in selling, general and administrative expense in the accompanying consolidated statements of operations. Income Taxes The Company accounts for income taxes using the asset and liability method. Deferred tax assets and liabilities are recognized for the future tax consequences attributable to differences between the financial statement carrying value amounts and income tax bases of assets and liabilities and the expected benefits of utilizing net operating loss and tax credit carryforwards. The deferred tax assets and liabilities are calculated using enacted tax rates in effect for each taxing jurisdiction in which the Company operates for the year in which those temporary differences are expected to be recovered or settled. Net deferred tax assets are then reduced by a valuation allowance if the Company believes it more likely than not such net deferred tax assets will not be realized. The effect on deferred tax assets and liabilities of an enacted change in tax rates is recognized in income in the period that includes the enactment date. When the tax law requires interest to be paid on an underpayment of income taxes, the Company recognizes interest expense from the first period the interest would begin accruing according to the relevant tax law. Such interest expense is included in interest expense in the accompanying consolidated statements of operations. Any accrual of penalties related to underpayment of income taxes on uncertain tax positions is included in other income (expense) in the accompanying consolidated statements of operations. Earnings (Loss) Attributable to Liberty Interactive Corporation Stockholders and Earnings (Loss) Per Common Share Net earnings (loss) attributable to Liberty stockholders is comprised of the following (amounts in millions): Years ended December 31, 2014 2013 2012 Liberty Interactive Corporation Net earnings (loss) from continuing operations . . . . . . . . . . . NA NA (1) Net earnings (loss) from discontinued operations . . . . . . . . . NA NA 295 Liberty Interactive Net earnings (loss) from continuing operations . . . . . . . . . . . $ 535 455 262 Net earnings (loss) from discontinued operations . . . . . . . . . $ (15) (17) (50) Liberty Ventures Net earnings (loss) from continuing operations . . . . . . . . . . . $ 3 54 281 Net earnings (loss) from discontinued operations . . . . . . . . . $ 14 9 743 Basic earnings (loss) per common share ("EPS") is computed by dividing net earnings (loss) attributable to such common stock by the weighted average number of common shares outstanding for the period. Diluted EPS presents the dilutive effect on a per share basis of potential common shares as if they had been converted at the beginning of the periods presented. F-48 |
|
|
LIBERTY INTERACTIVE CORPORATION AND SUBSIDIARIES Notes to Consolidated Financial Statements (Continued) December 31, 2014, 2013 and 2012 Series A and Series B Liberty Interactive Corporation Common Stock The basic and diluted EPS calculation for Liberty Interactive Corporation prior to the recapitalization is based on the following weighted average outstanding shares. Excluded from diluted EPS, for the period prior to the recapitalization, are less than a million potential common shares because their inclusion would be antidilutive. January 1, 2012 - August 9, 2012 number of shares in millions Basic WASO . . . . . . . . . . . . . . . . . . . . . . . . . . . . . . . . . . . . . . . . . . . . . . 559 Potentially dilutive shares . . . . . . . . . . . . . . . . . . . . . . . . . . . . . . . . . . . . 9 Diluted WASO . . . . . . . . . . . . . . . . . . . . . . . . . . . . . . . . . . . . . . . . . . . . . 568 Series A and Series B Liberty Interactive Common Stock Liberty completed a recapitalization on August 9, 2012, whereby each holder of current Liberty Interactive Corporation common stock became a holder of the same number of Liberty Interactive common stock. EPS for the period from the recapitalization through December 31, 2014, is based on the following weighted average outstanding shares. Excluded from diluted EPS for the year ended December 31, 2014 are approximately 1 million potential common shares because their inclusion would be antidilutive. Years ended December 31, 2014 2013 2012 number of shares in millions Basic WASO . . . . . . . . . . . . . . . . . . . . . . . . . . . . . . . . . . . . . . . . 484 519 541 Potentially dilutive shares . . . . . . . . . . . . . . . . . . . . . . . . . . . . . . 8 8 10 Diluted WASO . . . . . . . . . . . . . . . . . . . . . . . . . . . . . . . . . . . . . . . 492 527 551 Series A and Series B Liberty Ventures Common Stock Liberty completed a recapitalization on August 9, 2012, whereby each holder of then-existing Liberty Interactive common stock received 0.05 of a share of the corresponding series of Liberty Ventures common stock, by means of a dividend, with cash paid in lieu of fractional shares of Liberty Ventures common stock. Additionally, as part of the recapitalization Liberty distributed subscription rights, which were priced at a discount to the market value, to all holders of Liberty Ventures common stock, see further discussion in note 12. The rights offering, because of the discount, is considered a stock dividend which requires retroactive treatment for prior periods for the weighted average shares outstanding. As discussed in note 2, Liberty completed a two for one stock split on April 11, 2014 on its Series A and Series B Liberty Ventures common stock. Therefore, all prior period outstanding share amounts have been retroactively adjusted for comparability. Additionally, as discussed in note 2, on October 3, 2014, Liberty attributed from the QVC Group to the Ventures Group its Digital Commerce companies. In exchange for the Reattributed Assets, Inter-Group Interest Shares in the Ventures Group were created in favor of the QVC Group. Immediately following the reattribution on October 3, 2014, Liberty's board declared a dividend of the Inter-Group Interest Shares to the holders of Series A and Series B Liberty Interactive common stock in full elimination of the inter-group interest. The Inter-Group Interest Shares were allocated, F-49 |
|
|
LIBERTY INTERACTIVE CORPORATION AND SUBSIDIARIES Notes to Consolidated Financial Statements (Continued) December 31, 2014, 2013 and 2012 pro-rata, to the outstanding shares of Series A and Series B Liberty Interactive common stock at 5:00 p.m., New York City time, on October 13, 2014, the record date for the dividend, such that each holder of Liberty Interactive common stock received 0.14217 of a share of the corresponding series of Liberty Ventures common stock for each share of Liberty Interactive common stock held as of the record date, with cash paid in lieu of fractional shares. The distribution date for the dividend was on October 20, 2014, and the Liberty Interactive common stock began trading ex-dividend on October 15, 2014. The reattribution of the Digital Commerce companies is presented on a prospective basis from the date of the reattribution in Liberty’s consolidated financial statements, with October 1, 2014 used as a proxy for the date of the reattribution. EPS for the period from the recapitalization through December 31, 2014, is based on the following weighted average outstanding shares. Excluded from diluted EPS for the year ended December 31, 2014 are less than a million potential common shares because their inclusion would be antidilutive. Years ended December 31, 2014 2013 2012 number of shares in millions Basic WASO . . . . . . . . . . . . . . . . . . . . . . . . . . . . . . . . . . . . . . . 87 73 66 Potentially dilutive shares . . . . . . . . . . . . . . . . . . . . . . . . . . . . . 1 1 1 Diluted WASO . . . . . . . . . . . . . . . . . . . . . . . . . . . . . . . . . . . . . . 88 74 67 Reclasses and adjustments Certain prior period amounts have been reclassified for comparability with the current year presentation. Estimates The preparation of financial statements in conformity with GAAP requires management to make estimates and assumptions that affect the reported amounts of assets and liabilities at the date of the financial statements and the reported amounts of revenue and expenses during the reporting period. Actual results could differ from those estimates. Liberty considers (i) recurring and non-recurring fair value measurements, (ii) accounting for income taxes, (iii) assessments of other-than-temporary declines in fair value of its investments and (iv) estimates of retail-related adjustments and allowances to be its most significant estimates. Liberty holds investments that are accounted for using the equity method. Liberty does not control the decision making process or business management practices of these affiliates. Accordingly, Liberty relies on management of these affiliates to provide it with accurate financial information prepared in accordance with GAAP that Liberty uses in the application of the equity method. In addition, Liberty relies on audit reports that are provided by the affiliates' independent auditors on the financial statements of such affiliates. The Company is not aware, however, of any errors in or possible misstatements of the financial information provided by its equity affiliates that would have a material effect on Liberty's consolidated financial statements. F-50 |
|
|
LIBERTY INTERACTIVE CORPORATION AND SUBSIDIARIES Notes to Consolidated Financial Statements (Continued) December 31, 2014, 2013 and 2012 (4) Supplemental Disclosures to Consolidated Statements of Cash Flows Years ended December 31, 2014 2013 2012 amounts in millions Cash paid for acquisitions: Fair value of assets acquired . . . . . . . . . . . . . . . . . . . . . . . . . . $ — 7 13 Intangibles not subject to amortization . . . . . . . . . . . . . . . . . . — 12 45 Intangibles subject to amortization . . . . . . . . . . . . . . . . . . . . . — 2 40 Net liabilities assumed . . . . . . . . . . . . . . . . . . . . . . . . . . . . . . . — (7) (19) Deferred tax assets (liabilities) . . . . . . . . . . . . . . . . . . . . . . . . — 10 (8) Other . . . . . . . . . . . . . . . . . . . . . . . . . . . . . . . . . . . . . . . . . . . . . — — 12 Cash paid for acquisitions, net of cash acquired . . . . . . . . $ — 24 83 Cash paid for interest . . . . . . . . . . . . . . . . . . . . . . . . . . . . . . . . . . $ 362 362 411 Cash paid for income taxes . . . . . . . . . . . . . . . . . . . . . . . . . . . . . . $ 44 410 133 (5) Discontinued Operations On August 27, 2014, Liberty completed the TripAdvisor Holdings Spin-Off to holders of its Liberty Ventures common stock shares of its former wholly-owned subsidiary, TripAdvisor Holdings. TripAdvisor Holdings is comprised of Liberty’s former 22% economic and 57% voting interest in TripAdvisor, as well as BuySeasons, Liberty’s former wholly-owned subsidiary, and a corporate level net debt balance of $350 million. In connection with the TripAdvisor Holdings Spin-Off during August 2014, TripAdvisor Holdings drew down $400 million in margin loans and distributed approximately $350 million to Liberty. This transaction has been recorded at historical cost due to the pro rata nature of the distribution. Following the completion of the TripAdvisor Holdings Spin-Off, Liberty and TripAdvisor Holdings operate as separate, publicly traded companies, and neither has any stock ownership, beneficial or otherwise, in the other. The consolidated financial statements of Liberty have been prepared to reflect TripAdvisor Holdings as discontinued operations. Accordingly, the assets and liabilities, revenue, costs and expenses, and cash flows of the businesses, assets and liabilities owned by TripAdvisor Holdings at the time of the TripAdvisor Holdings Spin-Off have been excluded from the respective captions in the accompanying consolidated balance sheets, statements of operations, comprehensive earnings and cash flows in such consolidated financial statements. In connection with the TripAdvisor Holdings Spin-off, Liberty and TripAdvisor Holdings entered into a tax sharing agreement (the “Tax Sharing Agreement”). The Tax Sharing Agreement provides for the allocation and indemnification of tax liabilities and benefits between Liberty and TripAdvisor Holdings and other agreements related to tax matters. Among other things, pursuant to the Tax Sharing Agreement, TripAdvisor Holdings has agreed to indemnify Liberty, subject to certain limited exceptions, for losses and taxes resulting from the TripAdvisor Holdings Spin-Off to the extent such losses or taxes result primarily from, individually or in the aggregate, the breach of certain restrictive covenants F-51 |
|
|
LIBERTY INTERACTIVE CORPORATION AND SUBSIDIARIES Notes to Consolidated Financial Statements (Continued) December 31, 2014, 2013 and 2012 made by TripAdvisor Holdings (applicable to actions or failures to act by TripAdvisor Holdings and its subsidiaries following the completion of the TripAdvisor Holdings Spin-Off). In October 2014, the IRS completed its examination of the TripAdvisor Holdings Spin-Off and notified Liberty that it agreed with the nontaxable characterization of the transaction. Liberty expects to execute a Closing Agreement with the IRS documenting this conclusion during 2015. Certain combined financial information for TripAdvisor Holdings, which is included in the discontinued operations line items of the consolidated Liberty balance sheets as of December 31, 2013, is as follows (amounts in millions): December 31, 2013 Current assets. . . . . . . . . . . . . . . . . . . . . . . . . . . . . . . . . . . . . . . . . . . . . . . . . . . $ 653 Investments in available-for-sale securities and other cost investments . . . . $ 188 Property & equipment, net . . . . . . . . . . . . . . . . . . . . . . . . . . . . . . . . . . . . . . . . $ 39 Goodwill . . . . . . . . . . . . . . . . . . . . . . . . . . . . . . . . . . . . . . . . . . . . . . . . . . . . . . $ 3,460 Trademarks . . . . . . . . . . . . . . . . . . . . . . . . . . . . . . . . . . . . . . . . . . . . . . . . . . . . $ 1,832 Other intangible assets, net . . . . . . . . . . . . . . . . . . . . . . . . . . . . . . . . . . . . . . . . $ 905 Other assets . . . . . . . . . . . . . . . . . . . . . . . . . . . . . . . . . . . . . . . . . . . . . . . . . . . . $ 34 Current liabilities . . . . . . . . . . . . . . . . . . . . . . . . . . . . . . . . . . . . . . . . . . . . . . . . $ 265 Debt, including current portion . . . . . . . . . . . . . . . . . . . . . . . . . . . . . . . . . . . . $ 369 Net deferred tax liability . . . . . . . . . . . . . . . . . . . . . . . . . . . . . . . . . . . . . . . . . . $ 836 Certain combined financial information for TripAdvisor Holdings, which is included in earnings (loss) from discontinued operations, is as follows (amounts in millions, except per share amounts): Years ended December 31, 2014 2013 2012 Revenue . . . . . . . . . . . . . . . . . . . . . . . . . . . . . . . . . . . . . . . . . . $ 883 1,033 166 Earnings (loss) before income taxes . . . . . . . . . . . . . . . . . . . . $ 68 (27) 1,102 Income tax (expense) benefit . . . . . . . . . . . . . . . . . . . . . . . . . . $ (20) 53 (116) Earnings (loss) attributable to Liberty Interactive Corporation shareholders . . . . . . . . . . . . . . . . . . . . . . . . . . . . $ (1) (8) 988 F-52 |
|
|
LIBERTY INTERACTIVE CORPORATION AND SUBSIDIARIES Notes to Consolidated Financial Statements (Continued) December 31, 2014, 2013 and 2012 Earnings per share impact of discontinued operations The combined impact from discontinued operations, discussed above, is as follows: Years ended December 31, 2014 2013 2012 Basic earnings (loss) from discontinued operations attributable to Liberty shareholders per common share (note 3): Series A and Series B Liberty Interactive Corporation common stock . . . . . . . . . $ NA NA 0.53 Series A and Series B Liberty Interactive common stock . . . . . . . . . . . . . . . . . . . . $ (0.03) (0.03) (0.09) Series A and Series B Liberty Ventures common stock . . . . . . . . . . . . . . . . . . . . . . $ 0.16 0.12 11.26 Diluted earnings (loss) from discontinued operations attributable to Liberty shareholders per common share (note 3): Series A and Series B Liberty Interactive Corporation common stock . . . . . . . . . $ NA NA 0.52 Series A and Series B Liberty Interactive common stock . . . . . . . . . . . . . . . . . . . . $ (0.03) (0.03) (0.09) Series A and Series B Liberty Ventures common stock . . . . . . . . . . . . . . . . . . . . . . $ 0.16 0.12 11.09 The assets and liabilities included in the TripAdvisor Holdings Spin-Off, and their resulting impacts on the attributed consolidated statements of operations, were included in discontinued operations based on which group owned the assets at the time of the TripAdvisor Holdings Spin-Off. (6) Assets and Liabilities Measured at Fair Value For assets and liabilities required to be reported at fair value, GAAP provides a hierarchy that prioritizes inputs to valuation techniques used to measure fair value into three broad levels. Level 1 inputs are quoted market prices in active markets for identical assets or liabilities that the reporting entity has the ability to access at the measurement date. Level 2 inputs, other than quoted market prices included within Level 1, are observable for the asset or liability, either directly or indirectly. Level 3 inputs are unobservable inputs for the asset or liability. The Company does not have any recurring assets or liabilities measured at fair value that would be considered Level 3. F-53 |
|
|
LIBERTY INTERACTIVE CORPORATION AND SUBSIDIARIES Notes to Consolidated Financial Statements (Continued) December 31, 2014, 2013 and 2012 The Company's assets and liabilities measured at fair value are as follows: December 31, 2014 December 31, 2013 Quoted prices Quoted prices in active Significant in active Significant markets other markets other for identical observable for identical observable assets inputs assets inputs Description Total (Level 1) (Level 2) Total (Level 1) (Level 2) amounts in millions Cash equivalents . . . . . . . . . . . . . . . . . . . . . . . . . $ 2,147 2,147 — 762 762 — Short term marketable securities . . . . . . . . . . . . $ 889 277 612 412 62 350 Available-for-sale securities . . . . . . . . . . . . . . . . $ 1,220 1,203 17 1,309 1,047 262 Debt . . . . . . . . . . . . . . . . . . . . . . . . . . . . . . . . . . . $ 2,574 — 2,574 2,355 — 2,355 The majority of the Company's Level 2 financial assets and liabilities are debt instruments with quoted market prices that are not considered to be traded on "active markets," as defined in GAAP. Accordingly, the debt instruments are reported in the foregoing table as Level 2 fair value. Realized and Unrealized Gains (Losses) on Financial Instruments Realized and unrealized gains (losses) on financial instruments are comprised of changes in the fair value of the following: Years ended December 31, 2014 2013 2012 amounts in millions Fair Value Option Securities . . . . . . . . . . . . . . . . . . . . . . . . . . . . $ 173 514 470 Exchangeable senior debentures . . . . . . . . . . . . . . . . . . . . . . . . (230) (553) (602) Other financial instruments . . . . . . . . . . . . . . . . . . . . . . . . . . . . — 17 (219) $ (57) (22) (351) (7) Investments in Available-for-Sale Securities and Other Cost Investments All marketable equity and debt securities held by the Company are classified as available-for-sale ("AFS") and are carried at fair value generally based on quoted market prices. GAAP permits entities to choose to measure many financial instruments, such as AFS securities, and certain other items at fair value and to recognize the changes in fair value of such instruments in the entity's statement of operations (the "fair value option"). In prior years, Liberty entered into economic hedges for certain of its non-strategic AFS securities (although such instruments were not accounted for as fair value hedges by the Company). Changes in the fair value of these economic hedges were reflected in Liberty's statement of operations as unrealized gains (losses). In order to better match the changes in fair value of the subject AFS securities and the changes in fair value of the corresponding economic hedges in the Company's financial statements, Liberty elected the fair value option for those of its AFS securities which it considers to be non-strategic ("Fair Value Option Securities"). Accordingly, changes in the fair value of Fair Value Option Securities, as determined by quoted market prices, are reported F-54 |
|
|
LIBERTY INTERACTIVE CORPORATION AND SUBSIDIARIES Notes to Consolidated Financial Statements (Continued) December 31, 2014, 2013 and 2012 in realized and unrealized gains (losses) on financial instruments in the accompanying consolidated statements of operations. Investments in AFS securities, the majority of which are considered Fair Value Option Securities and other cost investments, are summarized as follows: December 31, December 31, 2014 2013 amounts in millions QVC Group Other cost investments . . . . . . . . . . . . . . . . . . . . . . . . . . . . . . . . . . . . $ 4 4 Total attributed QVC Group . . . . . . . . . . . . . . . . . . . . . . . . . . . . . . $ 4 4 Ventures Group Time Warner Inc. . . . . . . . . . . . . . . . . . . . . . . . . . . . . . . . . . . . . . . . . $ 375 306 Time Warner Cable Inc. . . . . . . . . . . . . . . . . . . . . . . . . . . . . . . . . . . . 815 741 Other AFS investments . . . . . . . . . . . . . . . . . . . . . . . . . . . . . . . . . . . . 30 262 Total attributed Ventures Group . . . . . . . . . . . . . . . . . . . . . . . . . . . 1,220 1,309 Consolidated Liberty . . . . . . . . . . . . . . . . . . . . . . . . . . . . . . . . . . . . . . . $ 1,224 1,313 (8) Investments in Affiliates Accounted for Using the Equity Method Liberty has various investments accounted for using the equity method. The following table includes Liberty's carrying amount and percentage ownership of the more significant investments in affiliates at December 31, 2014 and the carrying amount at December 31, 2013: December 31, 2014 December 31, 2013 Percentage Market Carrying Carrying ownership value amount amount dollars in millions QVC Group HSN, Inc. (2) . . . . . . . . . . . . . . . . . . . . . . . . 38 % $ 1,521 $ 328 293 Other . . . . . . . . . . . . . . . . . . . . . . . . . . . . . . various N/A 47 50 Total QVC Group . . . . . . . . . . . . . . . . . . . 375 343 Ventures Group Expedia (1)(2) . . . . . . . . . . . . . . . . . . . . . . . 18 % $ 1,992 514 477 FTD (3) . . . . . . . . . . . . . . . . . . . . . . . . . . . . 35 % $ 355 355 — Other . . . . . . . . . . . . . . . . . . . . . . . . . . . . . . various N/A 389 417 Total Ventures Group . . . . . . . . . . . . . . . . 1,258 894 Consolidated Liberty . . . . . . . . . . . . . . . . . . . $ 1,633 1,237 F-55 |
|
|
LIBERTY INTERACTIVE CORPORATION AND SUBSIDIARIES Notes to Consolidated Financial Statements (Continued) December 31, 2014, 2013 and 2012 The following table presents Liberty's share of earnings (losses) of affiliates: Years ended December 31, 2014 2013 2012 amounts in millions QVC Group HSN, Inc. . . . . . . . . . . . . . . . . . . . . . . . . . . . . . . . . . . . . . . . . . . $ 60 61 40 Other . . . . . . . . . . . . . . . . . . . . . . . . . . . . . . . . . . . . . . . . . . . . . (9) (13) (12) Total QVC Group . . . . . . . . . . . . . . . . . . . . . . . . . . . . . . . . . . 51 48 28 Ventures Group Expedia, Inc. . . . . . . . . . . . . . . . . . . . . . . . . . . . . . . . . . . . . . . . 58 31 67 Other . . . . . . . . . . . . . . . . . . . . . . . . . . . . . . . . . . . . . . . . . . . . . (70) (46) (48) Total Ventures Group . . . . . . . . . . . . . . . . . . . . . . . . . . . . . . . (12) (15) 19 Consolidated Liberty . . . . . . . . . . . . . . . . . . . . . . . . . . . . . . . . . . $ 39 33 47 (1) Liberty entered into a forward sales contract on 12 million shares of Expedia common stock in March 2012 at a per share forward price of $34.316. The forward contract was settled in October 2012 for total cash proceeds of $412 million and the 12 million shares of Expedia common stock, previously held as collateral, were released to the counterparty. In the fourth quarter of 2012, when the forward contract settled, the difference between the fair value of the Expedia shares and the carrying value of the shares ($443 million) was recognized in the gain (loss) on transactions, net line item in the statement of operations. Liberty owns an approximate 18% equity interest and 58% voting interest in Expedia. Liberty has entered into governance arrangements pursuant to which Mr. Barry Diller, Chairman of the Board and Senior Executive Officer of Expedia, may vote its interests of Expedia, subject to certain limitations. Additionally, through our governance arrangements with Mr. Diller, we have the right to appoint and have appointed 20% of the members of Expedia's board of directors, which is currently comprised of 10 members. Therefore, we determined based on these arrangements that we have significant influence and have accounted for the investment as an equity method affiliate. (2) During the years ended December 31, 2014, 2013 and 2012, Expedia, Inc. paid dividends aggregating $15 million, $13 million and $23 million, respectively, and HSN, Inc. paid dividends of $22 million and $16 million during the years ended December 31, 2014 and December 31, 2013, respectively, which were recorded as reductions to the investment balances. (3) As discussed in note 1, FTD acquired Liberty’s formerly wholly-owned subsidiary, Provide, on December 31, 2014. In exchange for Provide, Liberty received approximately 10.2 million shares of FTD common stock representing approximately 35% of the combined company and approximately $145 million in cash. Subsequent to completion of the transaction, Liberty accounts for FTD as an equity-method affiliate based on the ownership level and board representation. F-56 |
|
|
LIBERTY INTERACTIVE CORPORATION AND SUBSIDIARIES Notes to Consolidated Financial Statements (Continued) December 31, 2014, 2013 and 2012 HSN, Inc. Liberty records the share of earnings (loss) for HSN, Inc. on a quarter lag due to timeliness considerations and access to financial information. Summarized unaudited financial information for HSN, Inc., on a quarter lag, is as follows: HSN, Inc. Consolidated Balance Sheets September 30, September 30, 2014 2013 amounts in millions Current assets . . . . . . . . . . . . . . . . . . . . . . . . . . . . . . . . . . . . . . . . . . . . $ 863 773 Property and equipment, net . . . . . . . . . . . . . . . . . . . . . . . . . . . . . . . . 180 171 Goodwill . . . . . . . . . . . . . . . . . . . . . . . . . . . . . . . . . . . . . . . . . . . . . . . 10 10 Intangible assets . . . . . . . . . . . . . . . . . . . . . . . . . . . . . . . . . . . . . . . . . 262 266 Other assets . . . . . . . . . . . . . . . . . . . . . . . . . . . . . . . . . . . . . . . . . . . . . 14 6 Total assets . . . . . . . . . . . . . . . . . . . . . . . . . . . . . . . . . . . . . . . . . . . . $ 1,329 1,226 Current liabilities . . . . . . . . . . . . . . . . . . . . . . . . . . . . . . . . . . . . . . . . . $ 474 412 Deferred income taxes . . . . . . . . . . . . . . . . . . . . . . . . . . . . . . . . . . . . 76 90 Long-term debt . . . . . . . . . . . . . . . . . . . . . . . . . . . . . . . . . . . . . . . . . . 216 231 Other liabilities . . . . . . . . . . . . . . . . . . . . . . . . . . . . . . . . . . . . . . . . . . 15 11 Equity . . . . . . . . . . . . . . . . . . . . . . . . . . . . . . . . . . . . . . . . . . . . . . . . . . 548 482 Total liabilities and equity . . . . . . . . . . . . . . . . . . . . . . . . . . . . . . . . $ 1,329 1,226 HSN, Inc. Consolidated Statements of Operations Trailing twelve months ended September 30, 2014 2013 2012 amounts in millions Revenue . . . . . . . . . . . . . . . . . . . . . . . . . . . . . . . . . . . . . . $ 3,490 3,367 3,206 Cost of revenue . . . . . . . . . . . . . . . . . . . . . . . . . . . . . . . . (2,246) (2,152) (2,039) Gross profit . . . . . . . . . . . . . . . . . . . . . . . . . . . . . . . . . . 1,244 1,215 1,167 Selling, general and administrative expenses . . . . . . . . (928) (898) (877) Amortization . . . . . . . . . . . . . . . . . . . . . . . . . . . . . . . . . . (43) (40) (38) Operating income . . . . . . . . . . . . . . . . . . . . . . . . . . . . . 273 277 252 Interest expense . . . . . . . . . . . . . . . . . . . . . . . . . . . . . . . . (7) (7) (27) Other income (expense), net . . . . . . . . . . . . . . . . . . . . . . — 1 (18) Income tax (expense) benefit . . . . . . . . . . . . . . . . . . . . . (100) (98) (78) Income (loss) from continuing operations . . . . . . . . . 166 173 129 Discontinued operations, net of tax . . . . . . . . . . . . . . . . — 1 (8) Net earnings (loss) attributable to HSN shareholders . . $ 166 174 121 F-57 |
|
|
LIBERTY INTERACTIVE CORPORATION AND SUBSIDIARIES Notes to Consolidated Financial Statements (Continued) December 31, 2014, 2013 and 2012 (9) Goodwill and Other Intangible Assets Goodwill Changes in the carrying amount of goodwill are as follows: QVC Digital Commerce Total amounts in millions Balance at January 1, 2013 . . . . . . . . . . . . . . . . . . . . . . . . . . . . . $ 5,349 558 5,907 Foreign currency translation adjustments . . . . . . . . . . . . . . . (37) — (37) Acquisitions . . . . . . . . . . . . . . . . . . . . . . . . . . . . . . . . . . . . . . — 7 7 Impairments . . . . . . . . . . . . . . . . . . . . . . . . . . . . . . . . . . . . . . — (5) (5) Balance at December 31, 2013 . . . . . . . . . . . . . . . . . . . . . . . . . . $ 5,312 560 5,872 Impairments . . . . . . . . . . . . . . . . . . . . . . . . . . . . . . . . . . . . . . — (7) (7) Sale of subsidiary . . . . . . . . . . . . . . . . . . . . . . . . . . . . . . . . . . — (352) (352) Foreign currency translation adjustments . . . . . . . . . . . . . . . (106) — (106) Other . . . . . . . . . . . . . . . . . . . . . . . . . . . . . . . . . . . . . . . . . . . . — (3) (3) Balance at December 31, 2014 . . . . . . . . . . . . . . . . . . . . . . . . . . $ 5,206 198 5,404 Goodwill recognized from acquisitions primarily relates to assembled workforces, website community and other intangible assets that do not qualify for separate recognition. As presented in the accompanying consolidated balance sheets, trademarks is the other significant indefinite lived intangible asset. Intangible Assets Subject to Amortization Intangible assets subject to amortization are comprised of the following: December 31, 2014 December 31, 2013 Gross Net Gross Net carrying Accumulated carrying carrying Accumulated carrying amount amortization amount amount amortization amount amounts in millions Television distribution rights . . . . . . . . . . . . . . . . . . . . $ 2,308 (1,847) 461 2,324 (1,700) 624 Customer relationships . . . . . . . . . . . . . . . . . . . . . . . . . 2,488 (2,015) 473 2,620 (1,940) 680 Other . . . . . . . . . . . . . . . . . . . . . . . . . . . . . . . . . . . . . . . 735 (484) 251 804 (521) 283 Total . . . . . . . . . . . . . . . . . . . . . . . . . . . . . . . . . . . . . . . . $ 5,531 (4,346) 1,185 5,748 (4,161) 1,587 The weighted average life of these amortizable intangible assets was approximately 9 years, at the time of acquisition. However, amortization is expected to match the usage of the related asset and will be on an accelerated basis as demonstrated in table below. Amortization expense for intangible assets with finite useful lives was $504 million, $482 million and $449 million for the years ended December 31, 2014, 2013 and 2012, respectively. Based on its amortizable intangible assets as of F-58 |
|
|
LIBERTY INTERACTIVE CORPORATION AND SUBSIDIARIES Notes to Consolidated Financial Statements (Continued) December 31, 2014, 2013 and 2012 December 31, 2014, Liberty expects that amortization expense will be as follows for the next five years (amounts in millions): 2015 . . . . . . . . . . . . . . . . . . . . . . . . . . . . . . . . . . . . . . . . . . . . . . . . . . . . . . . . . . . . . . . . . . . . $ 470 2016 . . . . . . . . . . . . . . . . . . . . . . . . . . . . . . . . . . . . . . . . . . . . . . . . . . . . . . . . . . . . . . . . . . . . $ 421 2017 . . . . . . . . . . . . . . . . . . . . . . . . . . . . . . . . . . . . . . . . . . . . . . . . . . . . . . . . . . . . . . . . . . . . $ 262 2018 . . . . . . . . . . . . . . . . . . . . . . . . . . . . . . . . . . . . . . . . . . . . . . . . . . . . . . . . . . . . . . . . . . . . $ 10 2019 . . . . . . . . . . . . . . . . . . . . . . . . . . . . . . . . . . . . . . . . . . . . . . . . . . . . . . . . . . . . . . . . . . . . $ 7 Impairments Continued declining operating results as compared to budgeted results and certain trends related to certain Digital Commerce companies required a Step 2 impairment test and a determination of fair value for those subsidiaries. Fair value for those subsidiaries, including the related intangibles and goodwill, were determined using the respective companies' projections of future operating performance and applying a combination of market multiples (market approach) and discounted cash flow (income approach) calculations (Level 3). As of December 31, 2014 accumulated goodwill impairment losses for the Digital Commerce companies was $111 million. F-59 |
|
|
LIBERTY INTERACTIVE CORPORATION AND SUBSIDIARIES Notes to Consolidated Financial Statements (Continued) December 31, 2014, 2013 and 2012 (10) Debt Debt is summarized as follows: Outstanding principal Carrying value December 31, December 31, December 31, 2014 2014 2013 amounts in millions QVC Group Corporate level notes and debentures 8.5% Senior Debentures due 2029 . . . . . . . . . . . . . . . . . . . . . . . . . . . . . . . . . $ 287 285 285 8.25% Senior Debentures due 2030 . . . . . . . . . . . . . . . . . . . . . . . . . . . . . . . . 504 501 501 1% Exchangeable Senior Debentures due 2043 . . . . . . . . . . . . . . . . . . . . . . 400 444 423 Subsidiary level notes and facilities QVC 7.5% Senior Secured Notes due 2019 . . . . . . . . . . . . . . . . . . . . . . . . . . — — 761 QVC 3.125% Senior Secured Notes due 2019. . . . . . . . . . . . . . . . . . . . . . . . 400 399 — QVC 7.375% Senior Secured Notes due 2020. . . . . . . . . . . . . . . . . . . . . . . . 500 500 500 QVC 5.125% Senior Secured Notes due 2022. . . . . . . . . . . . . . . . . . . . . . . . 500 500 500 QVC 4.375% Senior Secured Notes due 2023. . . . . . . . . . . . . . . . . . . . . . . . 750 750 750 QVC 4.850% Senior Secured Notes due 2024. . . . . . . . . . . . . . . . . . . . . . . . 600 600 — QVC 4.45% Senior Secured Notes due 2025 . . . . . . . . . . . . . . . . . . . . . . . . . 600 599 — QVC 5.45% Senior Secured Notes due 2034 . . . . . . . . . . . . . . . . . . . . . . . . . 400 399 — QVC 5.95% Senior Secured Notes due 2043 . . . . . . . . . . . . . . . . . . . . . . . . . 300 300 300 QVC Bank Credit Facilities . . . . . . . . . . . . . . . . . . . . . . . . . . . . . . . . . . . . . . 508 508 922 Other subsidiary debt . . . . . . . . . . . . . . . . . . . . . . . . . . . . . . . . . . . . . . . . . . . . 75 75 141 Total QVC Group . . . . . . . . . . . . . . . . . . . . . . . . . . . . . . . . . . . . . . . . . . . . . $ 5,824 5,860 5,083 Ventures Group Corporate level debentures 4% Exchangeable Senior Debentures due 2029 . . . . . . . . . . . . . . . . . . . . . . $ 438 294 284 3.75% Exchangeable Senior Debentures due 2030 . . . . . . . . . . . . . . . . . . . . 438 291 270 3.5% Exchangeable Senior Debentures due 2031 . . . . . . . . . . . . . . . . . . . . . 355 325 316 0.75% Exchangeable Senior Debentures due 2043 . . . . . . . . . . . . . . . . . . . . 850 1,220 1,062 Subsidiary level notes and facilities Other subsidiary debt . . . . . . . . . . . . . . . . . . . . . . . . . . . . . . . . . . . . . . . . . . . . 61 61 — Total Ventures Group. . . . . . . . . . . . . . . . . . . . . . . . . . . . . . . . . . . . . . . . . . . $ 2,142 2,191 1,932 Total consolidated Liberty debt . . . . . . . . . . . . . . . . . . . . . . . . . . . . . . . . . . . . $ 7,966 8,051 7,015 Less debt classified as current . . . . . . . . . . . . . . . . . . . . . . . . . . . . . . . . . . . . . (946) (909) Total long-term debt . . . . . . . . . . . . . . . . . . . . . . . . . . . . . . . . . . . . . . . . . . . 7,105 6,106 Exchangeable Senior Debentures Each $1,000 original principal amount of the 0.75% Exchangeable Senior Debentures is exchangeable for a basket of 6.3040 shares of common stock of Time Warner Cable Inc., 5.1635 shares of common stock of Time Warner Inc. and 0.6454 shares of Time, Inc., which may change over time to include other publicly traded common equity securities that may be distributed on or in respect of those shares of Time Warner Cable Inc. and Time Warner Inc. (or into which any of those securities may be converted or exchanged). This basket of shares for which each Debenture in the original principal amount of $1,000 may be exchanged is referred to as the Reference Shares attributable to such Debenture, and to each F-60 |
|
|
LIBERTY INTERACTIVE CORPORATION AND SUBSIDIARIES Notes to Consolidated Financial Statements (Continued) December 31, 2014, 2013 and 2012 issuer of Reference Shares as a Reference Company. Each Debenture is exchangeable at the option of the holder at any time, upon which they will be entitled to receive the Reference Shares attributable to such Debenture or, at the election of Liberty Interactive LLC (“Liberty LLC”), cash or a combination of Reference Shares and cash having a value equal to such Reference Shares. Upon exchange, holders will not be entitled to any cash payment representing accrued interest or outstanding additional distributions. Each $1,000 debenture of Liberty LLC's 4% Exchangeable Senior Debentures is exchangeable at the holder's option for the value of 3.2265 shares of Sprint common stock and 0.7860 shares of CenturyLink, Inc. ("CenturyLink") common stock. Liberty LLC may, at its election, pay the exchange value in cash, Sprint and CenturyLink common stock or a combination thereof. Liberty LLC, at its option, may redeem the debentures, in whole or in part, for cash generally equal to the face amount of the debentures plus accrued interest. Each $1,000 debenture of Liberty LLC's 3.75% Exchangeable Senior Debentures is exchangeable at the holder's option for the value of 2.3578 shares of Sprint common stock and 0.5746 shares of CenturyLink common stock. Liberty LLC may, at its election, pay the exchange value in cash, Sprint and CenturyLink common stock or a combination thereof. Liberty, at its option, may redeem the debentures, in whole or in part, for cash equal to the face amount of the debentures plus accrued interest. Each $1,000 debenture of Liberty LLC's 3.5% Exchangeable Senior Debentures (the "Motorola Exchangeables") was exchangeable at the holder's option for the value of 5.2598 shares of Motorola Solutions, Inc. and 4.6024 shares of Motorola Mobility Holdings, Inc., as a result of Motorola Inc.'s separation of Motorola Mobility Holdings, Inc. ("MMI") in a 1 for 8 stock distribution, and the subsequent 1 for 7 reverse stock split of Motorola, Inc. (which has been renamed Motorola Solutions, Inc. ("MSI")), effective January 4, 2011. MMI was acquired on May 22, 2012 for $40 per share in cash. Pursuant to the indenture, the cash paid to shareholders in the MMI acquisition was to be paid to the holders of the Motorola Exchangeables as an extraordinary distribution. Liberty LLC made a cash payment of $184.096 per debenture in the second quarter of 2012 for a total payment of $111 million. The remaining exchange value is payable, at Liberty's option, in cash or MSI stock or a combination thereof. Liberty LLC, at its option, may redeem the debentures, in whole or in part, for cash generally equal to the adjusted principal amount of the debentures plus accrued interest. As a result of a cash distribution made by Liberty LLC in 2007, the cash disbursement discussed above and various principal payments made to holders of the Motorola Exchangeables, the adjusted principal amount of each $1,000 debenture is $592, as of December 31, 2014. Each $1,000 original principal amount of the 1% Exchangeable Senior Debentures due 2043 (the “HSNi Exchangeables”) is initially exchangeable for 13.4580 shares of common stock of HSNi (the "HSNi Reference Shares"). Each of the HSNi Exchangeables is exchangeable at the option of the holder, for certain triggering events (primarily the increase in an average trading period at the end of the quarter for HSNi reference shares above 130% or below 98% of the adjusted principal amount at the end of a quarter) after the calendar quarter ended March 31, 2014, upon achieving certain trading prices of the underlying HSNi Reference Shares. Upon exchange, holders of HSNi Exchangeables will be entitled to receive the HSNi Reference Shares attributable to such HSNi Exchangeables or, at the election of Liberty LLC, cash or a combination of HSNi Reference Shares and cash having a value equal to such HSNi Reference Shares. For purposes of the HSNi Exchangeables, Liberty LLC is treated as an affiliate of HSNi under the Securities Act. Therefore, for as long as Liberty LLC is treated as an affiliate of HSNi for purposes of the HSNi Exchangeables, any reference shares consisting of F-61 |
|
|
LIBERTY INTERACTIVE CORPORATION AND SUBSIDIARIES Notes to Consolidated Financial Statements (Continued) December 31, 2014, 2013 and 2012 HSNi common stock (or common stock of any other reference company of which Liberty LLC is treated as an affiliate for purposes of the HSNi Exchangeables) delivered by Liberty LLC upon exchange or purchase of a HSNi Exchangeables will be "restricted securities" under the Securities Act and subject to restrictions on transfer. Liberty LLC may deliver HSNi Reference Shares upon exchange or purchase of the HSNi Exchangeables only if (1) permitted under certain contractual arrangements between the Company and HSNi and (2) such Reference Shares would be freely transferable by the holders of the HSNi Reference Shares (other than by affiliates of HSNi) under the Securities Act, or if not freely transferable, there is at that time an effective registration statement under a registration rights agreement that Liberty LLC has with HSNi (or such other Reference Company) pursuant to which the recipients of such HSNi Reference Shares may sell those shares in a registered transaction under the Securities Act. Liberty LLC will make an additional distribution on the HSNi Exchangeables if HSNi makes a distribution of cash (an “Excess Regular Cash Dividend”) in excess of the regular quarterly cash dividend of $0.18, currently paid by the HSNi securities (other than publicly traded common equity securities) or other property with respect to the HSNi Reference Shares. The principal amount of the HSNi Exchangeables will not be reduced by any amount we pay that corresponds to any Excess Regular Cash Dividends on the HSNi Reference Shares. In January 2015 HSNi declared a special dividend of $10 per share from which Liberty anticipates receiving approximately $200 million in cash in February 2015. Pursuant to the debentures a portion of the special dividend ($54 million) will be passed through to the holders of the notes and will reduce the outstanding principal balance in March 2015. On October 5, 2016, Liberty LLC may, at its option, redeem the HSNi Exchangeables, in whole or in part, in each case at a redemption price, in cash, equal to the adjusted principal amount of the HSNi Exchangeables plus accrued and unpaid interest to the date of redemption plus any final period distribution. Additionally, as of such date, holders may tender HSNi Exchangeables for purchase by Liberty LLC, at a purchase price equal to the adjusted principal amount plus accrued and unpaid interest to the purchase date plus any final period distribution. Liberty LLC may pay the purchase price, at its election, in cash or through delivery of HSNi Reference Shares (subject to the restrictions discussed previously) having a value equal to the purchase price or a combination of HSNi Reference Shares and cash. If Liberty LLC makes a partial redemption, HSNi Exchangeables in an aggregate original principal amount of at least $100 million must remain outstanding. Liberty has elected to account for all of its Exchangeables using the fair value option. Accordingly, changes in the fair value of this instrument are recognized as unrealized gains (losses) in the statements of operations. Liberty will review the triggering events on a quarterly basis to determine whether a triggering event has occurred to require current classification of certain Exchangeables, see additional discussion below. Liberty has sold, split-off or otherwise disposed of all of its shares of Motorola, Sprint and CenturyLink common stock which underlie the respective Exchangeable Senior Debentures. Because such exchangeable debentures are exchangeable at the option of the holder at any time and Liberty can no longer use owned shares to redeem the debentures, Liberty has classified for financial reporting purposes the portion of the debentures that could be redeemed for cash as a current liability. Such amount aggregated $910 million at December 31, 2014. Although such amount has been classified as a current liability for financial reporting purposes, the Company believes the probability that the holders of such instruments will exchange a significant principal amount of the debentures prior to maturity is remote. F-62 |
|
|
LIBERTY INTERACTIVE CORPORATION AND SUBSIDIARIES Notes to Consolidated Financial Statements (Continued) December 31, 2014, 2013 and 2012 Interest on the Company's exchangeable debentures is payable semi-annually based on the date of issuance. At maturity, all of the Company's exchangeable debentures are payable in cash. Senior Debentures Interest on the Senior Debentures is payable semi-annually based on the date of issuance. The Senior Debentures are stated net of an aggregate unamortized discount of $5 million at December 31, 2014 and 2013. Such discount is being amortized to interest expense in the accompanying consolidated statements of operations. QVC Senior Secured Notes On March 18, 2014, QVC issued $400 million principal amount of new 3.125% Senior Secured Notes due 2019 at an issue price of 99.828% and $600 million principal amount of new 4.85% Senior Secured Notes due 2024 at an issue price of 99.927% (collectively, the “March Notes”). The March Notes are secured by the capital stock of QVC and certain of QVC’s subsidiaries and have equal priority to QVC’s senior secured credit facility. The net proceeds from the March Notes offerings were used to repay indebtedness under QVC’s senior secured credit facility and for working capital and other general corporate purposes. On August 21, 2014, QVC issued $600 million principal amount of 4.45% Senior Secured Notes due 2025 at an issue price of 99.860% and new $400 million principal amount 5.45% Senior Secured Notes due 2034 at an issue price of 99.784% (collectively, the “August Notes”). The August Notes are secured by the capital stock of QVC and certain of QVC’s subsidiaries and have equal priority to QVC’s senior secured credit facility. The net proceeds from the August Notes offerings were used for the redemption of QVC’s 7.5% Senior Secured Notes due 2019 (the “Redemption”) on September 9, 2014 and for working capital and other general corporate purposes. As a result of the Redemption, QVC incurred an extinguishment loss of $48 million for the year ended December 31, 2014. As a result of refinancing transactions in the prior year, QVC recorded extinguishment losses of $57 million for the year ended December 31, 2013. Losses on early extinguishment of debt are recorded in other, net in the Company's consolidated statements of operations. During prior years, QVC issued $500 million principal amount of 7.375% Senior Secured Notes due 2020 at par, $1,000 million principal amount of QVC 7.50% Senior Secured Notes due 2019 at an issue price of 98.278% of par, $500 million principal amount of 5.125% Senior Secured Notes due 2022 at par, $750 million principal amount of 4.375% Senior Secured Notes due 2023 at par and $300 million principal amount of 5.95% Senior Secured Notes due 2043 at par. QVC was in compliance with all of its debt covenants related to its outstanding senior notes at December 31, 2014. QVC Bank Credit Facilities The QVC Bank Credit Facility is a multi-currency facility providing for a $2 billion revolving credit facility, with a $250 million sub-limit for standby letters of credit and $1 billion of uncommitted incremental revolving loan commitments F-63 |
|
|
LIBERTY INTERACTIVE CORPORATION AND SUBSIDIARIES Notes to Consolidated Financial Statements (Continued) December 31, 2014, 2013 and 2012 or incremental term loans. The loans are scheduled to mature on March 1, 2018. The Bank Credit Facility contains covenants customary to those generally contained in bank credit facilities. Borrowings under the Bank Credit Facility bear interest at either the alternate base rate or LIBOR (based on an interest period selected by QVC of one week, one month, two months, three months or six months, or to the extent available from all lenders, nine months or twelve months) at QVC's election in each case plus a margin. Borrowings that are alternate base rate loans will bear interest at a per annum rate equal to the base rate plus a margin that varies between 0.25% and 1.00% depending on QVC's ratio of consolidated total debt to consolidated Adjusted OIBDA (the “consolidated leverage ratio”). Borrowings that are LIBOR loans will bear interest at a per annum rate equal to the applicable LIBOR plus a margin that varies between 1.25% and 2.00% depending on QVC's consolidated leverage ratio. The interest rate on the senior secured credit facility was 2.0% at December 31, 2014. Each loan may be prepaid at any time and from time to time without penalty other than customary breakage costs. Any amounts prepaid on the revolving facility may be reborrowed. The Bank Credit Facility is secured by the stock of QVC. Availability under the QVC Credit Agreement at December 31, 2014 was $1.5 billion. QVC was in compliance with all debt covenants related to the bank Credit Facility at December 31, 2014. QVC Interest Rate Swap Arrangements In prior years QVC entered into forward interest rate swap arrangements with an aggregate notional amount of $3.1 billion. Such arrangements matured in March 2013 and no further interest swap arrangements were entered into. These swap arrangements did not qualify as cash flow hedges under GAAP. Accordingly, changes in the fair value of the swaps were reflected in realized and unrealized gains or losses on financial instruments in the accompanying consolidated statements of operations. Other Subsidiary Debt Other subsidiary debt at December 31, 2014 is comprised of capitalized satellite transponder lease obligations and bank debt of certain subsidiaries. Five Year Maturities The annual principal maturities of Liberty's debt, based on stated maturity dates, for each of the next five years is as follows (amounts in millions): 2015 . . . . . . . . . . . . . . . . . . . . . . . . . . . . . . . . . . . . . . . . . . . . . . . . . . . . . . . . . . . . . . . . . . $ 47 2016 . . . . . . . . . . . . . . . . . . . . . . . . . . . . . . . . . . . . . . . . . . . . . . . . . . . . . . . . . . . . . . . . . . $ 26 2017 . . . . . . . . . . . . . . . . . . . . . . . . . . . . . . . . . . . . . . . . . . . . . . . . . . . . . . . . . . . . . . . . . . $ 39 2018 . . . . . . . . . . . . . . . . . . . . . . . . . . . . . . . . . . . . . . . . . . . . . . . . . . . . . . . . . . . . . . . . . . $ 533 2019 . . . . . . . . . . . . . . . . . . . . . . . . . . . . . . . . . . . . . . . . . . . . . . . . . . . . . . . . . . . . . . . . . . $ 427 Fair Value of Debt Liberty estimates the fair value of its debt based on the quoted market prices for the same or similar issues or on the current rate offered to Liberty for debt of the same remaining maturities. The fair value, based on quoted prices of F-64 |
|
|
LIBERTY INTERACTIVE CORPORATION AND SUBSIDIARIES Notes to Consolidated Financial Statements (Continued) December 31, 2014, 2013 and 2012 instruments but not considered to be active markets (Level 2), of Liberty's publicly traded debt securities that are not reported at fair value in the accompanying consolidated balance sheets is as follows (amounts in millions): December 31, 2014 2013 Senior debentures . . . . . . . . . . . . . . . . . . . . . . . . . . . . . . . . . . . . . . . . . . . . . $ 882 845 QVC senior secured notes . . . . . . . . . . . . . . . . . . . . . . . . . . . . . . . . . . . . . . $ 4,118 2,861 Due to the variable rate nature, Liberty believes that the carrying amount of its subsidiary debt not discussed above approximated fair value at December 31, 2014. (11) Income Taxes Income tax benefit (expense) consists of: Years ended December 31, 2014 2013 2012 amounts in millions Current: Federal . . . . . . . . . . . . . . . . . . . . . . . . . . . . . . . . . . . . . . . . . . . . $ (157) (97) (167) State and local . . . . . . . . . . . . . . . . . . . . . . . . . . . . . . . . . . . . . . (32) (26) (26) Foreign . . . . . . . . . . . . . . . . . . . . . . . . . . . . . . . . . . . . . . . . . . . . (110) (82) (139) $ (299) (205) (332) Deferred: Federal . . . . . . . . . . . . . . . . . . . . . . . . . . . . . . . . . . . . . . . . . . . . $ 59 (19) 19 State and local . . . . . . . . . . . . . . . . . . . . . . . . . . . . . . . . . . . . . . (23) 47 28 Foreign . . . . . . . . . . . . . . . . . . . . . . . . . . . . . . . . . . . . . . . . . . . . 5 (6) 7 41 22 54 Income tax benefit (expense) . . . . . . . . . . . . . . . . . . . . . . . . . . . $ (258) (183) (278) The following table presents a summary of our domestic and foreign earnings from continuing operations before income taxes: Years ended December 31, 2014 2013 2012 amounts in millions Domestic . . . . . . . . . . . . . . . . . . . . . . . . . . . . . . . . . . . . . . . . . . $ 676 575 667 Foreign . . . . . . . . . . . . . . . . . . . . . . . . . . . . . . . . . . . . . . . . . . . . 160 162 216 Total . . . . . . . . . . . . . . . . . . . . . . . . . . . . . . . . . . . . . . . . . . . . . $ 836 737 883 F-65 |
|
|
LIBERTY INTERACTIVE CORPORATION AND SUBSIDIARIES Notes to Consolidated Financial Statements (Continued) December 31, 2014, 2013 and 2012 Income tax benefit (expense) differs from the amounts computed by applying the U.S. federal income tax rate of 35% as a result of the following: Years ended December 31, 2014 2013 2012 amounts in millions Computed expected tax benefit (expense) . . . . . . . . . . . . . . . . $ (293) (258) (309) State and local income taxes, net of federal income taxes . . . . (7) (15) — Foreign taxes, net of foreign tax credits . . . . . . . . . . . . . . . . . . (2) (7) 5 Sale of consolidated subsidiary . . . . . . . . . . . . . . . . . . . . . . . . . 14 — — Impairment of intangible assets not deductible for tax purposes . . . . . . . . . . . . . . . . . . . . . . . . . . . . . . . . . . . . . . . . . . (3) (2) (16) Dividends received deductions . . . . . . . . . . . . . . . . . . . . . . . . . 10 9 13 Alternative energy tax credits . . . . . . . . . . . . . . . . . . . . . . . . . . 58 54 48 Change in valuation allowance affecting tax expense . . . . . . . (2) (27) (8) Impact of change in state rate on deferred taxes . . . . . . . . . . . (28) 66 — Other, net . . . . . . . . . . . . . . . . . . . . . . . . . . . . . . . . . . . . . . . . . . . (5) (3) (11) Income tax benefit (expense) . . . . . . . . . . . . . . . . . . . . . . . . . . . $ (258) (183) (278) During 2014 and 2013, Liberty changed its estimate of the effective state tax rate used to measure its net deferred tax liabilities, based on expected changes to the Company’s state apportionment factors. The change in 2014 was caused by the sale of a consolidated subsidiary (Provide) on December 31, 2014. The change in state apportionment factors during 2013 also changed the potential utilization of the Company’s state net operating loss carryforwards, which resulted in a valuation allowance being recorded for certain state net operating loss carryforwards that may expire unused. In both years, the rate change required an adjustment to the recognized deferred taxes at the corporate level. During 2014, 2013 and 2012, Liberty offset federal tax liabilities with tax credits derived from its alternative energy investments. F-66 |
|
|
LIBERTY INTERACTIVE CORPORATION AND SUBSIDIARIES Notes to Consolidated Financial Statements (Continued) December 31, 2014, 2013 and 2012 The tax effects of temporary differences that give rise to significant portions of the deferred income tax assets and deferred income tax liabilities are presented below: December 31, 2014 2013 amounts in millions Deferred tax assets: Net operating and capital loss carryforwards . . . . . . . . . . . . . . . . . . . . $ 90 74 Foreign tax credit carryforwards . . . . . . . . . . . . . . . . . . . . . . . . . . . . . . 88 129 Accrued stock compensation . . . . . . . . . . . . . . . . . . . . . . . . . . . . . . . . . 41 27 Other accrued liabilities . . . . . . . . . . . . . . . . . . . . . . . . . . . . . . . . . . . . . 143 85 Other future deductible amounts . . . . . . . . . . . . . . . . . . . . . . . . . . . . . . 134 119 Deferred tax assets . . . . . . . . . . . . . . . . . . . . . . . . . . . . . . . . . . . . . . . 496 434 Valuation allowance . . . . . . . . . . . . . . . . . . . . . . . . . . . . . . . . . . . . . . . . (54) (52) Net deferred tax assets . . . . . . . . . . . . . . . . . . . . . . . . . . . . . . . . . . . . 442 382 Deferred tax liabilities: Investments . . . . . . . . . . . . . . . . . . . . . . . . . . . . . . . . . . . . . . . . . . . . . . . 703 569 Intangible assets . . . . . . . . . . . . . . . . . . . . . . . . . . . . . . . . . . . . . . . . . . . 1,284 1,416 Discount on exchangeable debentures . . . . . . . . . . . . . . . . . . . . . . . . . 1,009 958 Deferred gain on debt retirements . . . . . . . . . . . . . . . . . . . . . . . . . . . . . 257 313 Other . . . . . . . . . . . . . . . . . . . . . . . . . . . . . . . . . . . . . . . . . . . . . . . . . . . . 10 52 Deferred tax liabilities . . . . . . . . . . . . . . . . . . . . . . . . . . . . . . . . . . . . . 3,263 3,308 Net deferred tax liabilities . . . . . . . . . . . . . . . . . . . . . . . . . . . . . . . . . . . . . $ 2,821 2,926 The Company's deferred tax assets and liabilities are reported in the accompanying consolidated balance sheets as follows: December 31, 2014 2013 amounts in millions Current deferred tax liabilities . . . . . . . . . . . . . . . . . . . . . . . . . . . . . . . . . . $ 972 925 Long-term deferred tax liabilities . . . . . . . . . . . . . . . . . . . . . . . . . . . . . . . . 1,849 2,001 Net deferred tax liabilities . . . . . . . . . . . . . . . . . . . . . . . . . . . . . . . . . . . $ 2,821 2,926 The Company's valuation allowance increased $2 million in 2014. The entire change in valuation allowance affected tax expense. At December 31, 2014, Liberty had net operating losses (on a tax effected basis) and foreign tax credit carryforwards for income tax purposes aggregating approximately $90 million and $88 million, respectively, of which, $9 million will expire in 2017 and $169 million will expire beyond 2020 if not utilized to reduce domestic, state or foreign income tax liabilities in future periods. These net operating losses and foreign tax credit carryforwards are expected to be utilized prior to expiration, except for $54 million of net operating losses which based on current projections of domestic, state and foreign income may expire unused. F-67 |
|
|
LIBERTY INTERACTIVE CORPORATION AND SUBSIDIARIES Notes to Consolidated Financial Statements (Continued) December 31, 2014, 2013 and 2012 A reconciliation of unrecognized tax benefits is as follows: Years ended December 31, 2014 2013 amounts in millions Balance at beginning of year . . . . . . . . . . . . . . . . . . . . . . . . . . . . . . . . . . $ 124 122 Additions based on tax positions related to the current year . . . . . . . . 16 19 Additions for tax positions of prior years . . . . . . . . . . . . . . . . . . . . . . . 20 1 Reductions for tax positions of prior years . . . . . . . . . . . . . . . . . . . . . . (3) (3) Lapse of statute and settlements . . . . . . . . . . . . . . . . . . . . . . . . . . . . . . (21) (15) Balance at end of year . . . . . . . . . . . . . . . . . . . . . . . . . . . . . . . . . . . . . . . . $ 136 124 As of December 31, 2014, the Company had recorded tax reserves of $136 million related to unrecognized tax benefits for uncertain tax positions. If such tax benefits were to be recognized for financial statement purposes, $68 million would be reflected in the Company's tax expense and affect its effective tax rate. Liberty's estimate of its unrecognized tax benefits related to uncertain tax positions requires a high degree of judgment. The Company has tax positions for which the amount of related unrecognized tax benefits could change during 2015. The amount of unrecognized tax benefits related to these issues could change as a result of potential settlements, lapsing of statute of limitations and revisions of estimates. It is reasonably possible that the amount of the Company's gross unrecognized tax benefits may decrease within the next twelve months by up to $23 million. As of December 31, 2014, the Company's 2001 through 2010 tax years are closed for federal income tax purposes, and the IRS has completed its examination of the Company's 2010 through 2012 tax years. The Company's tax loss carryforwards from its 2010 through 2012 tax years are still subject to adjustment. The Company's 2013 and 2014 tax years are being examined currently as part of the IRS's Compliance Assurance Process ("CAP") program. Various states are currently examining the Company's prior years state income tax returns. QVC is currently under audit in the U.K., Germany and Italy. As of December 31, 2014, no material assessments have resulted from these audits. As of December 31, 2014, the Company had recorded $28 million of accrued interest and penalties related to uncertain tax positions. (12) Stockholders' Equity Preferred Stock Liberty's preferred stock is issuable, from time to time, with such designations, preferences and relative participating, optional or other rights, qualifications, limitations or restrictions thereof, as shall be stated and expressed in a resolution or resolutions providing for the issue of such preferred stock adopted by Liberty's Board of Directors. As of December 31, 2014, no shares of preferred stock were issued. F-68 |
|
|
LIBERTY INTERACTIVE CORPORATION AND SUBSIDIARIES Notes to Consolidated Financial Statements (Continued) December 31, 2014, 2013 and 2012 Common Stock Series A Liberty Interactive and Liberty Ventures common stock has one vote per share, and Series B Liberty Interactive and Liberty Ventures common stock has ten votes per share. Each share of the Series B common stock is exchangeable at the option of the holder for one share of Series A common stock of the same group. The Series A and Series B common stock participate on an equal basis with respect to dividends and distributions. As of December 31, 2014, Liberty reserved for issuance upon exercise of outstanding stock options approximately 24.9 million shares of Series A Liberty Interactive common stock and approximately 1.0 million shares of Series B Liberty Interactive common stock. As of December 31, 2014, Liberty reserved for issuance upon exercise of outstanding stock options approximately 4.0 million shares of Series A Liberty Ventures common stock and approximately 1.5 million shares of Series B Liberty Ventures common stock. In addition to the Series A and Series B Liberty Interactive and Ventures common stock there are 4 billion and 200 million shares of Series C Liberty Interactive and Ventures common stock authorized for issuance, respectively. As of December 31, 2014, no shares of any Series C Liberty Interactive and Ventures common stock were issued or outstanding. As discussed in note 2, on February 27, 2014, Liberty’s board approved a two for one stock split of Series A and Series B Liberty Ventures common stock, to be effected by means of a dividend. The stock split was done in order to bring Liberty into compliance with a Nasdaq listing requirement regarding the minimum number of publicly held shares of the Series B Liberty Ventures common stock. In the stock split, a dividend was paid on April 11, 2014 to holders of Series A and Series B Liberty Ventures common stock of one share of Series A or Series B Liberty Ventures common stock for each share of Series A or Series B Liberty Ventures common stock, respectively, held by them as of 5:00 pm, New York City time, on April 4, 2014. The stock split has been recorded retroactively for all periods presented for comparability purposes. Additionally, as discussed in note 2, on October 3, 2014, Liberty attributed from the QVC Group to the Ventures Group its Digital Commerce companies. Holders of Liberty Interactive common shares received 0.14217 shares of Liberty Ventures common shares for each share of Liberty Interactive common shares held, as of the record date. The shares issued and subsequently distributed to Liberty Interactive common stock shareholders in the form of a dividend did not require retroactive treatment. Purchases of Common Stock During the year ended December 31, 2012 the Company repurchased 44,668,431 shares of Series A Liberty Interactive common stock for aggregate cash consideration of $815 million. During the year ended December 31, 2013 the Company repurchased 46,305,637 shares of Series A Liberty Interactive common stock for aggregate cash consideration of $1,089 million. During the year ended December 31, 2014 the Company repurchased 27,356,993 shares of Series A Liberty Interactive common stock for aggregate cash consideration of $785 million. F-69 |
|
|
LIBERTY INTERACTIVE CORPORATION AND SUBSIDIARIES Notes to Consolidated Financial Statements (Continued) December 31, 2014, 2013 and 2012 All of the foregoing shares were repurchased pursuant to a previously announced share repurchase program and have been retired and returned to the status of authorized and available for issuance. During 2012, in connection with the creation of the Liberty Ventures tracking stock, the Company distributed subscription rights to purchase shares of Series A Liberty Ventures common stock (each, a “Series A Right”). Each whole Series A Right entitled its holder to subscribe, at a per share subscription price of $35.99, for one share of Series A Liberty Ventures common stock. In the fourth quarter of 2012, the Company issued approximately 9 million shares in connection with the rights offering and raised approximately $328 million of cash. (13) Transactions with Officers and Directors Chief Executive Officer Compensation Arrangement In December 2014, the Compensation Committee (the "Committee") of Liberty approved a compensation arrangement, including term options discussed in note 14, for its President and Chief Executive Officer (the "CEO"). The arrangement provides for a five year employment term beginning January 1, 2015 and ending December 31, 2019, with an annual base salary of $960,750, increasing annually by 5% of the prior year's base salary, and an annual target cash bonus equal to 250% of the applicable year's annual base salary. The arrangement also provides that, in the event the CEO is terminated for "cause," he will be entitled only to his accrued base salary and any amounts due under applicable law and he will forfeit all rights to his unvested term options. If, however, the CEO is terminated by Liberty without cause or if he terminates his employment for “good reason,” the arrangement provides for him to receive his accrued base salary, his accrued but unpaid bonus and any amounts due under applicable law, a severance payment of 1.5 times his base salary during the year of his termination, a payment equal to $11,750,000 pro rated based upon the elapsed number of days in the calendar year of termination, a payment equal to $17.5 million, and for his unvested term options to generally vest pro rata based on the portion of the term elapsed through the termination date plus 18 months and for all vested and accelerated options to remain exercisable until their respective expiration dates. If the CEO terminates his employment without “good reason,” he will be entitled to his accrued base salary, his accrued but unpaid bonus and any amounts due under applicable law and a payment of the $11,750,000 and for his unvested term options to generally vest pro rata based on the portion of the term elapsed through the termination date and all vested and accelerated options to remain exercisable until their respective expiration dates. Lastly, in the case of the CEO's death or his disability, the arrangement provides that he will be entitled only to his accrued base salary and any amounts due under applicable law, a payment of 1.5 times his base salary during that year, a payment equal to $11,750,000 pro rated based upon the elapsed number of days in the calendar year of termination, a payment equal to $17.5 million and for his unvested term options to fully vest and for his vested and accelerated term options to remain exercisable until their respective expiration dates. In addition, beginning in 2015, the CEO will receive annual performance-based options to purchase shares of QVCB and LVNTB with a term of 7 years (the “Performance Options”) and performance-based restricted stock units with respect to QVCB and LVNTB (the “Performance RSUs” and together with the Performance Options, the “Performance Awards”) during the employment term. Grants of Performance Awards will be allocated between Liberty and Liberty Media Corporation. The aggregate target amount to be allocated between Liberty and Liberty Media will be $16 million with respect to calendar year 2015, $17 million with respect to calendar year 2016, $18 million with respect to calendar year 2017, $19 million with respect to calendar year 2018 and $20 million with respect to calendar year 2019. Vesting of the F-70 |
|
|
LIBERTY INTERACTIVE CORPORATION AND SUBSIDIARIES Notes to Consolidated Financial Statements (Continued) December 31, 2014, 2013 and 2012 Performance Awards will be determined based on satisfaction of performance metrics that will be set by Liberty and Liberty Media’s respective compensation committees in the first quarter of each applicable year, except that the CEO will forfeit his unvested Performance Awards if his employment is terminated for any reason before the end of the applicable year. In addition, Liberty and Liberty Media’s compensation committees may grant additional Performance Awards, with a value of up to 50% of the target amount allocated to Liberty for the relevant year (the “Above Target Awards”), and the compensation committees may determine to establish additional performance metrics with respect to such Above Target Awards. Salary compensation related to services provided is allocated from LMC to Liberty pursuant to the Services Agreement. Any cash bonus attributable to the performance of Liberty is paid directly by Liberty. (14) Stock-Based Compensation Liberty – Incentive Plans Pursuant to the Liberty Interactive Corporation 2000 Incentive Plan, as amended from time to time (the "2000 Plan"), and the Liberty Interactive Corporation 2007 Incentive Plan, as amended from time to time (the "2007 Plan") the Company has granted to certain of its employees stock options and SARs (collectively, "Awards") to purchase shares of Liberty common stock. The 2000 Plan and 2007 Plan provide for Awards to be issued in respect of a maximum of 1.9 million shares and 3.5 million shares, respectively, of Liberty common stock. No additional grants may be made pursuant to these plans. On June 24, 2010, stockholders of the Company approved the Liberty Interactive Corporation 2010 Incentive Plan, as amended from time to time (the "2010 Plan"). The 2010 Plan provides for Awards to be made in respect of a maximum of 45.6 million shares of Liberty common stock. Additionally, pursuant to the Liberty Interactive Corporation 2012 Incentive Plan, as amended (the "2012 Plan"), the Company may grant Awards to be made in respect of a maximum of 47 million shares of Liberty common stock. Awards generally vest over 4-5 years and have a term of 7-10 years. Liberty issues new shares upon exercise of equity awards. Pursuant to the Liberty Interactive Corporation 2011 Nonemployee Director Incentive Plan, as amended from time to time (the "2011 NDIP"), the Liberty Board of Directors has the full power and authority to grant eligible nonemployee directors stock options, SARs, stock options with tandem SARs, and restricted stock. In connection with the TripAdvisor Holdings Spin-Off in August 2014, all outstanding Awards with respect to Liberty Ventures common stock (“Liberty Ventures Award”) were adjusted pursuant to the anti-dilution provisions of the incentive plans under which the equity awards were granted, such that a holder of a Liberty Ventures Award received: i. An adjustment to the exercise price or base price, as applicable, and the number of shares subject to the Liberty Ventures Award (as so adjusted, an “Adjusted Liberty Ventures Award”) and ii. A corresponding equity award relating to shares of TripAdvisor Holdings common stock (a “TripAdvisor Holdings Award”) The exercise prices and number of shares subject to the Adjusted Liberty Ventures Award and the TripAdvisor Holdings Award were determined based on 1) the exercise prices and number of shares subject to the Liberty Ventures Award, 2) the pre-distribution trading price of the Liberty Ventures common stock and 3) the post-distribution trading F-71 |
|
|
LIBERTY INTERACTIVE CORPORATION AND SUBSIDIARIES Notes to Consolidated Financial Statements (Continued) December 31, 2014, 2013 and 2012 prices of Liberty Ventures common stock and TripAdvisor Holdings common stock, such that all of the pre-distribution intrinsic value of the Liberty Ventures Award was allocated between the Adjusted Liberty Ventures Award and the TripAdvisor Holdings Award. Following the TripAdvisor Holdings Spin-Off, employees of Liberty hold Awards in both Liberty Ventures common stock and TripAdvisor Holdings common stock. The compensation expense relating to employees of Liberty is recorded at Liberty. Additionally, outstanding stock options, relating to Liberty Interactive common stock, were adjusted, using a similar methodology as described above, in connection with the stock dividend related to the reattribution of the Digital Commerce businesses from the QVC Group to the Ventures Group during October 2014. Liberty – Grants During the year ended December 31, 2014, Liberty granted, primarily to QVC employees, 1.9 million options to purchase shares of Series A Liberty Interactive common stock which had a weighted average grant-date fair value of $12.04 per share. Liberty also granted approximately 20 thousand options to purchase shares of Series A Liberty Ventures common stock which had a weighted average grant-date fair value of $16.55 per share. Such options primarily vest on a semi-annual basis over a 4 year vesting period. In December 2014, Liberty granted 646 thousand options of Series B Liberty Interactive common stock and 1.4 million options of Series B Liberty Ventures common stock to the CEO of Liberty in connection with a new employment agreement (see note 13). Such options had a weighted average grant-date fair value of $10.50 per share and $15.52 per share, respectively. Of those options, one half vest on December 24, 2018 and the other half vest on December 24, 2019. During the year ended December 31, 2013, Liberty granted, primarily to QVC employees, 4.3 million options to purchase shares of Series A Liberty Interactive common stock. Such options had a weighted average grant-date fair value of $8.26 per share. Liberty also granted approximately 7 thousand options to purchase shares of Series A Liberty Ventures common stock. Such options had a weighted average grant-date fair value of $57.37 per share. During the year ended December 31, 2012, the Company granted approximately 3.4 million options to purchase shares of Series A Liberty Interactive common stock. Such options had a weighted average grant-date fair value of $8.44. During the year ended December 31, 2012, the Company also granted 36 thousand options to purchase shares of Series A Liberty Ventures common stock, which options had a weighted average grant-date fair value of $27.29 per share. During the fourth quarter of 2012, the Company entered into a series of transactions with certain officers of Liberty and its subsidiaries, associated with certain outstanding stock options, in order to recognize tax deductions in that year versus future years (the "2012 Option Exchange"). On December 4, 2012 (the "Grant Date"), pursuant to the approval of the Compensation Committee of its Board of Directors, the Company effected the acceleration of (i) each unvested in-themoney option to acquire shares of Series A Liberty Interactive common stock and (ii) each unvested in-the-money option to acquire shares of Series A Liberty Ventures common stock, in each case, held by certain of its and its subsidiaries' officers (collectively, the “Eligible Optionholders”). Following this acceleration, also on the Grant Date, each Eligible Optionholder exercised, on a net settled basis, substantially all of his or her outstanding in-the-money vested and unvested options to acquire Series A Liberty Interactive shares and Series A Liberty Ventures shares (the “Eligible Options”), and: F-72 |
|
|
LIBERTY INTERACTIVE CORPORATION AND SUBSIDIARIES Notes to Consolidated Financial Statements (Continued) December 31, 2014, 2013 and 2012 • with respect to each vested Eligible Option, the Company granted the Eligible Optionholder a vested new option with substantially the same terms and conditions as the exercised vested Eligible Option; • and with respect to each unvested Eligible Option: • the Eligible Optionholder sold to the Company, for cash, the shares of Series A Liberty Interactive or Series A Liberty Ventures, as applicable, received upon exercise of such unvested Eligible Option and used the proceeds of that sale to purchase from the Company an equal number of restricted Series A Liberty Interactive or Series A Liberty Ventures shares, as applicable, which have a vesting schedule identical to that of the exercised unvested Eligible Option; and • the Company granted the Eligible Optionholder an unvested new option, with substantially the same terms and conditions as the exercised unvested Eligible Option, except that (a) the number of shares underlying the new option is equal to the number of shares underlying such exercised unvested Eligible Option less the number of restricted shares purchased from the Company as described above and (b) the exercise price of the new option is the closing price per Series A Liberty Interactive or Series A Liberty Ventures share, as applicable, on The Nasdaq Global Select Market on the Grant Date. In connection with the 2012 Option Exchange, Liberty granted 20.1 million and 905 thousand options to purchase shares of Series A Liberty Interactive common stock and Series A Liberty Ventures common stock, respectively. Such options had a weighted average grant-date fair value of $7.15 and $26.58 per share, respectively. The 2012 Option Exchange was considered a modification under ASC 718 - Stock Compensation and resulted in incremental compensation expense in 2012 of $17 million and $4 million for the Liberty Interactive (now QVC) and Liberty Ventures groups, respectively. Incremental compensation expense is also being recognized over the remaining vesting periods of the new unvested options and the restricted shares and is included in unrecognized compensation. The Company has calculated the grant-date fair value for all of its equity classified awards and any subsequent remeasurement of its liability classified awards using the Black-Scholes Model. The Company estimates the expected term of the Awards based on historical exercise and forfeiture data. For grants made in 2014, 2013 and 2012, the range of expected terms was 1.3 to 9.0 years. The volatility used in the calculation for Awards is based on the historical volatility of Liberty's stocks and the implied volatility of publicly traded Liberty options. The Company uses a zero dividend rate and the risk-free rate for Treasury Bonds with a term similar to that of the subject options. F-73 |
|
|
LIBERTY INTERACTIVE CORPORATION AND SUBSIDIARIES Notes to Consolidated Financial Statements (Continued) December 31, 2014, 2013 and 2012 The following table presents the range of volatilities used by Liberty in the Black-Scholes Model for the 2014, 2013 and 2012 Liberty Interactive and Liberty Ventures grants. Volatility 2014 grants Liberty Interactive options . . . . . . . . . . . . . . . . . . . . . . . . . . . . . . . . . . . . 33.6 % - 39.7 % Liberty Ventures options . . . . . . . . . . . . . . . . . . . . . . . . . . . . . . . . . . . . . . 41.1 % - 43.7 % 2013 grants Liberty Interactive options . . . . . . . . . . . . . . . . . . . . . . . . . . . . . . . . . . . . 38.3 % - 38.7 % Liberty Ventures options . . . . . . . . . . . . . . . . . . . . . . . . . . . . . . . . . . . . . . 43.7 % - 49.9 % 2012 grants Liberty Interactive options . . . . . . . . . . . . . . . . . . . . . . . . . . . . . . . . . . . . 28.2 % - 47.51 % Liberty Ventures options . . . . . . . . . . . . . . . . . . . . . . . . . . . . . . . . . . . . . . 47.5 % - 49.94 % Liberty - Outstanding Awards The following table presents the number and weighted average exercise price ("WAEP") of the Awards to purchase Liberty Interactive and Liberty Ventures common stock granted to certain officers, employees and directors of the Company, as well as the weighted average remaining life and aggregate intrinsic value of the Awards. As discussed in note 2, on February 27, 2014, Liberty’s board approved a two for one stock split of Series A and Series B Liberty Ventures common stock, to be effected by means of a dividend. The stock split has been recorded retroactively for all periods presented for comparability purposes. Liberty Interactive Series A Series B Weighted Aggregate Weighted Aggregate average intrinsic average intrinsic Awards remaining value Awards remaining value (000's) WAEP life (in millions) (000's) WAEP life (in millions) Outstanding at January 1, 2014 . . . . . . . . . . . . . . . . 30,607 $ 17.98 432 $ 17.92 Granted . . . . . . . . . . . . . . . . . . . . . . . . . . . . . . . . 1,879 $ 29.19 646 $ 29.87 Exercised . . . . . . . . . . . . . . . . . . . . . . . . . . . . . . . (6,016) $ 15.84 — $ — Forfeited/Cancelled . . . . . . . . . . . . . . . . . . . . . . . (1,005) $ 20.96 — $ — Stock dividend adjustment . . . . . . . . . . . . . . . . . . (565) $ 17.38 (34) $ 16.51 Outstanding at December 31, 2014. . . . . . . . . . . . . . 24,900 $ 17.49 4.4 years $ 297 1,044 $ 24.78 4.5 years $ 5 Exercisable at December 31, 2014 . . . . . . . . . . . . . . 16,879 $ 16.38 4.1 years $ 220 398 $ 16.51 0.5 years $ 5 Liberty Ventures Series A Series B Weighted Aggregate Weighted Aggregate average intrinsic average intrinsic Awards remaining value Awards remaining value (000's) WAEP life (in millions) (000's) WAEP life (in millions) Outstanding at January 1, 2014 . . . . . . . . . . . . . . . . 1,932 $ 28.71 44 $ 23.35 Granted . . . . . . . . . . . . . . . . . . . . . . . . . . . . . . . . 20 $ 38.10 1,406 $ 37.63 Exercised . . . . . . . . . . . . . . . . . . . . . . . . . . . . . . . (398) $ 19.57 — $ — Forfeited/Cancelled . . . . . . . . . . . . . . . . . . . . . . . (1) $ 34.30 — $ — Adjustment for the TripAdvisor Holdings Spin-Off . 28 $ 14.63 — $ — Stock dividend adjustment . . . . . . . . . . . . . . . . . . 2,416 $ 22.15 57 $ 20.76 Outstanding at December 31, 2014. . . . . . . . . . . . . . 3,997 $ 19.10 4.3 years $ 74 1,507 $ 36.24 6.6 years $ 2 Exercisable at December 31, 2014 . . . . . . . . . . . . . . 3,094 $ 18.87 4.1 years $ 58 101 $ 16.82 0.5 years $ 2 F-74 |
|
|
LIBERTY INTERACTIVE CORPORATION AND SUBSIDIARIES Notes to Consolidated Financial Statements (Continued) December 31, 2014, 2013 and 2012 As of December 31, 2014, the total unrecognized compensation cost related to unvested awards of Liberty employees was approximately $80 million, including incremental compensation under the Option Exchange. Such amount will be recognized in the Company's consolidated statements of operations over a weighted average period of approximately 2.0 years. Liberty – Exercises The aggregate intrinsic value of all options exercised during the years ended December 31, 2014, 2013 and 2012 was $91 million, $76 million and $339 million, respectively. The aggregate intrinsic value of options exercised for the year ended December 31, 2012 includes approximately $242 million related to the intrinsic value of options exercised as a result of the 2012 Option Exchange. Liberty – Restricted Stock Associated with the 2012 Option Exchange the Company issued unvested restricted shares of Liberty Interactive and Liberty Ventures common stock, of which 639 thousand and 177 thousand shares, respectively, remain unvested as of December 31, 2014. These shares continue to vest over the next year, and since the 2012 Option Exchange was accounted for as a modification, the compensation expense associated with these restricted shares was treated as incremental compensation, as discussed above, and is included in the total unrecognized compensation costs under the outstanding Awards section above. The Company had approximately 1.3 million shares and 249 thousand shares of unvested restricted Liberty Interactive and Liberty Ventures common stock, respectively, held by certain directors, officers and employees of the Company as of December 31, 2014, not issued under the Option Exchange. These Series A unvested restricted shares of Liberty Interactive and Liberty Ventures had a weighted average grant date fair value of $17.49 and $4.07 per share, respectively. The aggregate fair value of all restricted shares of Liberty common stock that vested during the years ended December 31, 2014, 2013 and 2012 was $19 million, $16 million and $12 million, respectively. Other Certain of the Company's other subsidiaries have stock-based compensation plans under which employees and nonemployees are granted options or similar stock-based awards. Awards made under these plans vest and become exercisable over various terms. The awards and compensation recorded, if any, under these plans is not significant to Liberty. (15) Employee Benefit Plans Subsidiaries of Liberty sponsor 401(k) plans, which provide their employees an opportunity to make contributions to a trust for investment in Liberty common stock, as well as other mutual funds. The Company's subsidiaries make matching contributions to their plans based on a percentage of the amount contributed by employees. Employer cash contributions F-75 |
|
|
LIBERTY INTERACTIVE CORPORATION AND SUBSIDIARIES Notes to Consolidated Financial Statements (Continued) December 31, 2014, 2013 and 2012 to all plans aggregated $27 million, $24 million and $19 million, respectively, for the years ended December 31, 2014, 2013 and 2012, respectively. (16) Other Comprehensive Earnings (Loss) Accumulated other comprehensive earnings (loss) included in Liberty's consolidated balance sheets and consolidated statements of equity reflect the aggregate of foreign currency translation adjustments, unrealized holding gains and losses on AFS securities and Liberty's share of accumulated other comprehensive earnings of affiliates. The 2013 and 2012 tax (expense) benefit and before-tax amounts have been revised to be consistent with the 2014 presentation. The change in the components of accumulated other comprehensive earnings (loss), net of taxes ("AOCI"), is summarized as follows: Foreign Share of AOCI currency AOCI of translation of equity discontinued adjustments affiliates operations AOCI amounts in millions Balance at January 1, 2012 . . . . . . . . . . . . . . . . . . . . . . . . . . . . . . . . . . . . . . . . $ 158 (6) — 152 Other comprehensive earnings (loss) attributable to Liberty Interactive Corporation stockholders . . . . . . . . . . . . . . . . . . . . . . . . . . . . . . . . . . . . . . (7) 3 — (4) Balance at December 31, 2012 . . . . . . . . . . . . . . . . . . . . . . . . . . . . . . . . . . . . . 151 (3) — 148 Other comprehensive earnings (loss) attributable to Liberty Interactive Corporation stockholders . . . . . . . . . . . . . . . . . . . . . . . . . . . . . . . . . . . . . . (48) 2 (3) (49) Balance at December 31, 2013 . . . . . . . . . . . . . . . . . . . . . . . . . . . . . . . . . . . . . 103 (1) (3) 99 Other comprehensive earnings (loss) attributable to Liberty Interactive Corporation stockholders . . . . . . . . . . . . . . . . . . . . . . . . . . . . . . . . . . . . . . (178) (18) (3) (199) Distribution to stockholders for TripAdvisor Holdings Spin-Off . . . . . . . . — — 6 6 Balance at December 31, 2014 . . . . . . . . . . . . . . . . . . . . . . . . . . . . . . . . . . . . . $ (75) (19) — (94) F-76 |
|
|
LIBERTY INTERACTIVE CORPORATION AND SUBSIDIARIES Notes to Consolidated Financial Statements (Continued) December 31, 2014, 2013 and 2012 The components of other comprehensive earnings (loss) are reflected in Liberty's consolidated statements of comprehensive earnings (loss) net of taxes. The following table summarizes the tax effects related to each component of other comprehensive earnings (loss). Tax Before-tax (expense) Net-of-tax amount benefit amount amounts in millions Year ended December 31, 2014: Foreign currency translation adjustments . . . . . . . . . . . . . . . . . . . . . . . . . . . . . . . . . . . . . $ (241) 49 (192) Share of other comprehensive earnings (loss) of equity affiliates . . . . . . . . . . . . . . . . . . (29) 11 (18) Other comprehensive earnings (loss) from discontinued operations . . . . . . . . . . . . . . . . (2) 1 (1) Other comprehensive earnings (loss) . . . . . . . . . . . . . . . . . . . . . . . . . . . . . . . . . . . . . . . . $ (272) 61 (211) Year ended December 31, 2013: Foreign currency translation adjustments . . . . . . . . . . . . . . . . . . . . . . . . . . . . . . . . . . . . . $ (65) (8) (73) Share of other comprehensive earnings (loss) of equity affiliates . . . . . . . . . . . . . . . . . . 3 (1) 2 Other comprehensive earnings (loss) from discontinued operations . . . . . . . . . . . . . . . . (5) 2 (3) Other comprehensive earnings (loss) . . . . . . . . . . . . . . . . . . . . . . . . . . . . . . . . . . . . . . . . $ (67) (7) (74) Year ended December 31, 2012: Foreign currency translation adjustments . . . . . . . . . . . . . . . . . . . . . . . . . . . . . . . . . . . . . $ (47) 21 (26) Share of other comprehensive earnings (loss) of equity affiliates . . . . . . . . . . . . . . . . . . 5 (2) 3 Other comprehensive earnings (loss) from discontinued operations . . . . . . . . . . . . . . . . 2 (1) 1 Other comprehensive earnings (loss) . . . . . . . . . . . . . . . . . . . . . . . . . . . . . . . . . . . . . . . . $ (40) 18 (22) (17) Commitments and Contingencies Operating Leases Liberty leases business offices, has entered into satellite transponder lease agreements and uses certain equipment under lease arrangements. Rental expense under such arrangements amounted to $47 million, $50 million and $52 million for the years ended December 31, 2014, 2013 and 2012, respectively. A summary of future minimum lease payments under noncancelable operating leases as of December 31, 2014 follows (amounts in millions): Years ending December 31: 2015 . . . . . . . . . . . . . . . . . . . . . . . . . . . . . . . . . . . . . . . . . . . . . . . . . . . . . . . . . . . . . . . . . . . . $ 33 2016 . . . . . . . . . . . . . . . . . . . . . . . . . . . . . . . . . . . . . . . . . . . . . . . . . . . . . . . . . . . . . . . . . . . . $ 30 2017 . . . . . . . . . . . . . . . . . . . . . . . . . . . . . . . . . . . . . . . . . . . . . . . . . . . . . . . . . . . . . . . . . . . . $ 28 2018 . . . . . . . . . . . . . . . . . . . . . . . . . . . . . . . . . . . . . . . . . . . . . . . . . . . . . . . . . . . . . . . . . . . . $ 28 2019 . . . . . . . . . . . . . . . . . . . . . . . . . . . . . . . . . . . . . . . . . . . . . . . . . . . . . . . . . . . . . . . . . . . . $ 25 Thereafter . . . . . . . . . . . . . . . . . . . . . . . . . . . . . . . . . . . . . . . . . . . . . . . . . . . . . . . . . . . . . . . . $ 126 It is expected that in the normal course of business, leases that expire generally will be renewed or replaced by leases on other properties; thus, it is anticipated that future lease commitments will not be less than the amount shown for 2014. F-77 |
|
|
LIBERTY INTERACTIVE CORPORATION AND SUBSIDIARIES Notes to Consolidated Financial Statements (Continued) December 31, 2014, 2013 and 2012 Litigation Liberty has contingent liabilities related to legal and tax proceedings and other matters arising in the ordinary course of business. Although it is reasonably possible Liberty may incur losses upon conclusion of such matters, an estimate of any loss or range of loss cannot be made. In the opinion of management, it is expected that amounts, if any, which may be required to satisfy such contingencies will not be material in relation to the accompanying consolidated financial statements. (18) Information About Liberty's Operating Segments Liberty, through its ownership interests in subsidiaries and other companies, is primarily engaged in the video and online commerce industries. Liberty identifies its reportable segments as (A) those consolidated subsidiaries that represent 10% or more of its consolidated annual revenue, annual Adjusted OIBDA or total assets and (B) those equity method affiliates whose share of earnings represent 10% or more of Liberty's annual pre-tax earnings. The segment presentation for prior periods has been conformed to the current period segment presentation. Liberty evaluates performance and makes decisions about allocating resources to its operating segments based on financial measures such as revenue, Adjusted OIBDA, gross margin, average sales price per unit, number of units shipped and revenue or sales per customer equivalent. In addition, Liberty reviews nonfinancial measures such as unique website visitors, conversion rates and active customers, as appropriate. Liberty defines Adjusted OIBDA as revenue less cost of sales, operating expenses, and selling, general and administrative expenses (excluding stock-based compensation). Liberty believes this measure is an important indicator of the operational strength and performance of its businesses, including each business's ability to service debt and fund capital expenditures. In addition, this measure allows management to view operating results and perform analytical comparisons and benchmarking between businesses and identify strategies to improve performance. This measure of performance excludes depreciation and amortization, stock-based compensation, separately reported litigation settlements and restructuring and impairment charges that are included in the measurement of operating income pursuant to GAAP. Accordingly, Adjusted OIBDA should be considered in addition to, but not as a substitute for, operating income, net income, cash flow provided by operating activities and other measures of financial performance prepared in accordance with GAAP. Liberty generally accounts for intersegment sales and transfers as if the sales or transfers were to third parties, that is, at current prices. For the year ended December 31, 2014, Liberty has identified the following consolidated subsidiary as its reportable segment: • QVC—consolidated subsidiary that markets and sells a wide variety of consumer products in the United States and several foreign countries, primarily by means of its televised shopping programs and via the Internet and mobile transactions through its domestic and international websites. Additionally, for presentation purposes Liberty is providing financial information of the Digital Commerce businesses on an aggregated basis. The consolidated businesses do not contribute significantly to the overall operations of Liberty on an individual basis; however, Liberty believes that on an aggregated basis they provide relevant information for users of these financial statements. While these businesses may not meet the aggregation criteria under relevant accounting F-78 |
|
|
LIBERTY INTERACTIVE CORPORATION AND SUBSIDIARIES Notes to Consolidated Financial Statements (Continued) December 31, 2014, 2013 and 2012 literature, Liberty believes the information is relevant and helpful for a more complete understanding of the consolidated results. • Digital Commerce—the aggregation of certain consolidated subsidiaries and equity affiliate that market and sell a wide variety of consumer products via the Internet. Categories of consumer products include perishable and personal gift offerings (Provide, prior to December 31, 2014 and our equity affiliate, FTD, as of December 31, 2014), active lifestyle gear and clothing (Backcountry), fitness and health goods (Bodybuilding), digital invitations (Evite), infant and juvenile-related products (Right Start) and a drop-ship solutions company (CommerceHub). Due to the TripAdvisor Holdings Spin-Off completed on August 27, 2014, TripAdvisor is no longer considered a separate reportable segment. Prior to the completion of the TripAdvisor Holdings Spin-Off, BuySeasons was included in the Digital Commerce segment. Liberty's operating segments are strategic business units that offer different products and services. They are managed separately because each segment requires different technologies, distribution channels and marketing strategies. The accounting policies of the segments that are also consolidated subsidiaries are the same as those described in the Company's summary of significant accounting policies. Performance Measures Years ended December 31, 2014 2013 2012 Adjusted Adjusted Adjusted Revenue OIBDA Revenue OIBDA Revenue OIBDA amounts in millions QVC Group QVC . . . . . . . . . . . . . . . . . . . . . . . . . . . . . . . . . . . . . . . . $ 8,801 1,910 8,623 1,841 8,516 1,828 Digital Commerce (1) . . . . . . . . . . . . . . . . . . . . . . . . . . 1,227 53 1,596 103 1,372 102 Corporate and other . . . . . . . . . . . . . . . . . . . . . . . . . . . . — (24) — (20) — (27) Total QVC Group . . . . . . . . . . . . . . . . . . . . . . . . . . . . 10,028 1,939 10,219 1,924 9,888 1,903 Ventures Group Digital Commerce (1) . . . . . . . . . . . . . . . . . . . . . . . . . . 471 44 NA NA NA NA Corporate and other . . . . . . . . . . . . . . . . . . . . . . . . . . . . — (18) — (11) — (5) Total Ventures Group . . . . . . . . . . . . . . . . . . . . . . . . . 471 26 — (11) — (5) Consolidated Liberty . . . . . . . . . . . . . . . . . . . . . . . . . $ 10,499 1,965 10,219 1,913 9,888 1,898 (1) As discussed in note 2, on October 3, 2014, Liberty completed the reattribution from the QVC Group (formerly referred to as the Interactive Group, prior to the reattribution), to the Ventures Group its Digital Commerce companies. The reattribution of the Digital Commerce companies is presented on a prospective basis from the date of the reattribution in Liberty’s consolidated financial statements, with October 1, 2014 used as a proxy for the date of the reattribution. Accordingly, Revenue and Adjusted OIBDA attributable to the Digital Commerce companies are included in the QVC Group for the period through September 30, 2014 and are included in the Ventures Group for the period beginning October 1, 2014. F-79 |
|
|
LIBERTY INTERACTIVE CORPORATION AND SUBSIDIARIES Notes to Consolidated Financial Statements (Continued) December 31, 2014, 2013 and 2012 Other Information December 31, 2014 December 31, 2013 Investments Investments Total in Capital Total in Capital assets affiliates expenditures Assets (1) affiliates expenditures amounts in millions QVC Group QVC . . . . . . . . . . . . . . . . . . . . . . . . . . . . . . . . . . $ 12,466 47 183 13,031 51 217 Digital Commerce (1)(2) . . . . . . . . . . . . . . . . . NA NA 43 1,218 — 74 Corporate and other . . . . . . . . . . . . . . . . . . . . . 546 328 — 613 292 — Total QVC Group . . . . . . . . . . . . . . . . . . . . . . 13,012 375 226 14,862 343 291 Ventures Group Digital Commerce (2) . . . . . . . . . . . . . . . . . . . . 693 355 15 NA NA NA Corporate and other (1) . . . . . . . . . . . . . . . . . . . 5,135 903 — 9,984 894 — Total Ventures Group . . . . . . . . . . . . . . . . . . . 5,828 1,258 15 9,984 894 — Inter-group eliminations . . . . . . . . . . . . . . . . . . (199) — — (170) — — Consolidated Liberty . . . . . . . . . . . . . . . . . . . $ 18,641 1,633 241 24,676 1,237 291 (1) Total assets of discontinued operations at December 31, 2013 are included in the table above. BuySeasons and TripAdvisor total assets are included in the Corporate and other line item in the QVC Group and Ventures Group, respectively. (2) As discussed in note 2, on October 3, 2014, Liberty completed the reattribution from the QVC Group (formerly referred to as the Interactive Group, prior to the reattribution), to the Ventures Group its Digital Commerce companies. The reattribution of the Digital Commerce companies is presented on a prospective basis from the date of the reattribution in Liberty’s consolidated financial statements, with October 1, 2014 used as a proxy for the date of the reattribution. Accordingly, total assets, investments and affiliates and capital expenditures attributable to the Digital Commerce companies are included in the QVC Group for the period through September 30, 2014 and are included in the Ventures Group for the period beginning October 1, 2014. F-80 |
|
|
LIBERTY INTERACTIVE CORPORATION AND SUBSIDIARIES Notes to Consolidated Financial Statements (Continued) December 31, 2014, 2013 and 2012 The following table provides a reconciliation of segment Adjusted OIBDA to earnings (loss) from continuing operations before income taxes: Years ended December 31, 2014 2013 2012 amounts in millions Consolidated segment Adjusted OIBDA . . . . . . . . . . . . . . . $ 1,965 1,913 1,898 Stock-based compensation . . . . . . . . . . . . . . . . . . . . . . . . . (108) (118) (91) Depreciation and amortization . . . . . . . . . . . . . . . . . . . . . . (662) (629) (591) Impairment of intangible assets . . . . . . . . . . . . . . . . . . . . . (7) (30) (53) Interest expense . . . . . . . . . . . . . . . . . . . . . . . . . . . . . . . . . . (387) (380) (466) Share of earnings (loss) of affiliates, net . . . . . . . . . . . . . . 39 33 47 Realized and unrealized gains (losses) on financial instruments, net . . . . . . . . . . . . . . . . . . . . . . . . . . . . . . . (57) (22) (351) Gains (losses) on transactions, net . . . . . . . . . . . . . . . . . . . 74 (1) 443 Other, net . . . . . . . . . . . . . . . . . . . . . . . . . . . . . . . . . . . . . . . (21) (29) 47 Earnings (loss) from continuing operations before income taxes . . . . . . . . . . . . . . . . . . . . . . . . . . . . . . . . . . . . . . . . . $ 836 737 883 Revenue by Geographic Area Revenue by geographic area based on the location of customers is as follows: Years ended December 31, 2014 2013 2012 amounts in millions United States . . . . . . . . . . . . . . . . . . . . . . . . . . . . . . . . . . . . . $ 7,617 7,332 6,873 Japan. . . . . . . . . . . . . . . . . . . . . . . . . . . . . . . . . . . . . . . . . . . . 912 1,029 1,251 Germany . . . . . . . . . . . . . . . . . . . . . . . . . . . . . . . . . . . . . . . . 1,003 971 957 Other foreign countries . . . . . . . . . . . . . . . . . . . . . . . . . . . . . 967 887 807 $ 10,499 10,219 9,888 Long-lived Assets by Geographic Area December 31, 2014 2013 amounts in millions United States . . . . . . . . . . . . . . . . . . . . . . . . . . . . . . . . . . . . . . . . . . . . . . . $ 529 550 Japan . . . . . . . . . . . . . . . . . . . . . . . . . . . . . . . . . . . . . . . . . . . . . . . . . . . . . . 176 220 Germany . . . . . . . . . . . . . . . . . . . . . . . . . . . . . . . . . . . . . . . . . . . . . . . . . . . 210 245 Other foreign countries . . . . . . . . . . . . . . . . . . . . . . . . . . . . . . . . . . . . . . . 178 193 $ 1,093 1,208 F-81 |
|
|
LIBERTY INTERACTIVE CORPORATION AND SUBSIDIARIES Notes to Consolidated Financial Statements (Continued) December 31, 2014, 2013 and 2012 (19) Quarterly Financial Information (Unaudited) 1st 2nd 3rd 4th Quarter Quarter Quarter Quarter amounts in millions, except per share amounts 2014: Revenue . . . . . . . . . . . . . . . . . . . . . . . . . . . . . . . . . . . . . . . . . . . . . . . . . . . . . . . . . . . $ 2,434 2,483 2,330 3,252 Operating income . . . . . . . . . . . . . . . . . . . . . . . . . . . . . . . . . . . . . . . . . . . . . . . . . . . $ 246 259 239 444 Earnings from continuing operations . . . . . . . . . . . . . . . . . . . . . . . . . . . . . . . . . . . . $ 91 87 129 271 Net earnings (loss) attributable to Liberty Interactive Corporation stockholders: Series A and Series B Liberty Interactive common stock . . . . . . . . . . . . . . . . . $ 110 105 83 222 Series A and Series B Liberty Ventures common stock . . . . . . . . . . . . . . . . . . . $ (28) (28) 37 36 Basic net earnings (loss) from continuing operations attributable to Liberty Interactive Corporation stockholders per common share: Series A and Series B Liberty Interactive common stock . . . . . . . . . . . . . . . . . $ 0.23 0.23 0.18 0.47 Series A and Series B Liberty Ventures common stock . . . . . . . . . . . . . . . . . . . $ (0.45) (0.47) 0.47 0.28 Diluted net earnings (loss) from continuing operations attributable to Liberty Interactive Corporation stockholders per common share: Series A and Series B Liberty Interactive common stock . . . . . . . . . . . . . . . . . $ 0.23 0.23 0.18 0.46 Series A and Series B Liberty Ventures common stock . . . . . . . . . . . . . . . . . . . $ (0.45) (0.47) 0.46 0.28 Basic net earnings (loss) attributable to Liberty Interactive Corporation stockholders per common share: Series A and Series B Liberty Interactive common stock . . . . . . . . . . . . . . . . . $ 0.22 0.22 0.17 0.47 Series A and Series B Liberty Ventures common stock . . . . . . . . . . . . . . . . . . . $ (0.38) (0.38) 0.51 0.28 Diluted net earnings (loss) attributable to Liberty Interactive Corporation stockholders per common share: Series A and Series B Liberty Interactive common stock . . . . . . . . . . . . . . . . . $ 0.22 0.21 0.17 0.46 Series A and Series B Liberty Ventures common stock . . . . . . . . . . . . . . . . . . . $ (0.38) (0.38) 0.50 0.28 F-82 |
|
|
LIBERTY INTERACTIVE CORPORATION AND SUBSIDIARIES Notes to Consolidated Financial Statements (Continued) December 31, 2014, 2013 and 2012 1st 2nd 3rd 4th Quarter Quarter Quarter Quarter amounts in millions, except per share amounts 2013: Revenue . . . . . . . . . . . . . . . . . . . . . . . . . . . . . . . . . . . . . . . . . . . . . . . . . . . . . . . . . . . $ 2,417 2,384 2,225 3,193 Operating income . . . . . . . . . . . . . . . . . . . . . . . . . . . . . . . . . . . . . . . . . . . . . . . . . . . $ 264 269 197 406 Earnings from continuing operations . . . . . . . . . . . . . . . . . . . . . . . . . . . . . . . . . . . . $ 41 131 122 260 Net earnings (loss) attributable to Liberty Interactive Corporation stockholders: Series A and Series B Liberty Interactive common stock . . . . . . . . . . . . . . . . . $ 95 109 77 157 Series A and Series B Liberty Ventures common stock . . . . . . . . . . . . . . . . . . . $ (68) 11 36 84 Basic net earnings (loss) from continuing operations attributable to Liberty Interactive Corporation stockholders per common share: Series A and Series B Liberty Interactive common stock . . . . . . . . . . . . . . . . . $ 0.19 0.22 0.16 0.32 Series A and Series B Liberty Ventures common stock . . . . . . . . . . . . . . . . . . . $ (0.97) 0.07 0.47 1.18 Diluted net earnings (loss) from continuing operations attributable to Liberty Interactive Corporation stockholders per common share: Series A and Series B Liberty Interactive common stock . . . . . . . . . . . . . . . . . $ 0.18 0.21 0.15 0.32 Series A and Series B Liberty Ventures common stock . . . . . . . . . . . . . . . . . . . $ (0.97) 0.07 0.46 1.16 Basic net earnings (loss) attributable to Liberty Interactive Corporation stockholders per common share: Series A and Series B Liberty Interactive common stock . . . . . . . . . . . . . . . . . $ 0.18 0.21 0.15 0.31 Series A and Series B Liberty Ventures common stock . . . . . . . . . . . . . . . . . . . $ (0.93) 0.15 0.49 1.15 Diluted net earnings (loss) attributable to Liberty Interactive Corporation stockholders per common share: Series A and Series B Liberty Interactive common stock . . . . . . . . . . . . . . . . . $ 0.18 0.21 0.15 0.31 Series A and Series B Liberty Ventures common stock . . . . . . . . . . . . . . . . . . . $ (0.93) 0.15 0.49 1.14 F-83 |
|
|
Unaudited Attributed Financial Information for Tracking Stock Groups Our Liberty Interactive common stock is intended to reflect the separate performance of our QVC Group (formerly referred to as the Interactive Group), which, subsequent to the reattribution, is comprised of our subsidiary, QVC, Inc. (“QVC”) and our interest in HSN, Inc. Our Liberty Ventures common stock is intended to reflect the separate performance of our Ventures Group which, subsequent to the reattribution, consists of our on-line commerce businesses Backcountry.com, Inc. ("Backcountry"), Bodybuilding.com, LLC ("Bodybuilding"), CommerceHub, Evite, Inc. (“Evite”) and LMC Right Start, Inc. (“Right Start”) (collectively, the “Digital Commerce” businesses), and our interest in equity method investments of Expedia, Inc., Interval Leisure Group, Inc., FTD Companies, Inc. (“FTD”) (included in the Digital Commerce businesses) and LendingTree, Inc. (“LendingTree”) and available-for-sale securities Time Warner, Time Warner Cable and AOL. On August 9, 2012 Liberty completed the approved recapitalization of its common stock through the creation of the Liberty Interactive common stock and Liberty Ventures common stock as tracking stocks. In the recapitalization, each holder of Liberty Interactive Corporation common stock remained a holder of the same amount and series of Liberty Interactive common stock and received 0.05 of a share of the corresponding series of Liberty Ventures common stock, by means of a dividend, with cash issued in lieu of fractional shares of Liberty Ventures common stock. On October 3, 2014, Liberty reattributed from the Interactive Group to the Ventures Group its Digital Commerce businesses, which were valued at $1.5 billion, and approximately $1 billion in cash. In connection with the reattribution, each holder of Liberty Interactive common stock received 0.14217 of a share of the corresponding series of Liberty Ventures common stock for each share of Liberty Interactive common stock held as of the record date, with cash paid in lieu of fractional shares. The distribution date for the dividend was on October 20, 2014, and the Liberty Interactive common stock began trading ex-dividend on October 15, 2014. The Interactive Group is referred to as the QVC Group subsequent to the reattribution. The reattribution of the Digital Commerce companies is presented on a prospective basis from the date of the reattribution in Liberty’s consolidated financial statements, with October 1, 2014 used as a proxy for the date of the reattribution. On December 31, 2014, Liberty announced the closing of the acquisition by FTD of Provide. Under the terms of the transaction, Liberty received approximately 10.2 million shares of FTD common stock representing approximately 35% of the combined company and approximately $145 million in cash. Subsequent to completion of the transaction, Liberty accounts for FTD as an equity-method affiliate based on the ownership level and board representation. Given our significant continuing involvement with FTD, Provide is not presented as a discontinued operation in the consolidated financial statements of Liberty. The following tables present our assets and liabilities as of December 31, 2014 and 2013 and revenue, expenses and cash flows for the three years ended December 31, 2014, 2013 and 2012. The tables further present our revenue, expenses and cash flows that are attributed to the QVC Group and the Ventures Group, respectively, as if the recapitalization had occurred at the beginning 2012, for comparative purposes. Therefore, the attributed earnings presented in the Unaudited Attributed Financial Information Statements are not the same as those reflected in the Liberty Interactive Corporation consolidated financial statements for the year ended December 31, 2012. The earnings attributed to the QVC Group and Ventures Group for purposes of those financial statements only relate to the period after the tracking stocks were issued. F-84 |
|
|
The financial information in this Exhibit should be read in conjunction with our consolidated financial statements for the year ended December 31, 2014 included in this Annual Report on Form 10-K. Notwithstanding the following attribution of assets, liabilities, revenue, expenses and cash flows to the QVC Group and the Ventures Group, our tracking stock structure does not affect the ownership or the respective legal title to our assets or responsibility for our liabilities. We and our subsidiaries are each responsible for our respective liabilities. Holders of Liberty Interactive common stock and Liberty Ventures common stock are holders of our common stock and are subject to risks associated with an investment in our company and all of our businesses, assets and liabilities. The issuance of Liberty Interactive common stock and Liberty Ventures common stock does not affect the rights of our creditors or creditors of our subsidiaries. F-85 |
|
|
SUMMARY ATTRIBUTED FINANCIAL DATA QVC Group December 31, 2014 December 31, 2013 amounts in millions Summary balance sheet data: Current assets $ 2,783 3,245 Investments in affiliates, accounted for using the equity method $ 375 343 Intangible assets not subject to amortization, net $ 7,634 8,383 Total assets $ 13,012 14,862 Long-term debt $ 5,851 5,044 Long-term deferred income tax liabilities $ 1,033 1,207 Attributed net assets $ 4,280 6,378 Years ended December 31, 2014 2013 2012 amounts in millions Summary operations data: Revenue $ 10,028 10,219 9,888 Cost of sales (6,378) (6,533) (6,307) Operating expenses (854) (862) (819) Selling, general and administrative expenses (1) (940) (1,010) (943) Depreciation and amortization (643) (629) (591) Impairment of intangible assets (7) (30) (53) Operating income (loss) 1,206 1,155 1,175 Interest expense (312) (290) (322) Share of earnings (losses) of affiliates, net 51 48 28 Realized and unrealized gains (losses) on financial instruments, net (22) (12) 51 Gains (losses) on transactions, net — (1) — Other income (expense), net (43) (54) — Income tax benefit (expense) (306) (346) (357) Earnings (loss) from continuing operations 574 500 575 Earnings (loss) from discontinued operations, net of taxes (15) (17) (46) Net earnings (loss) 559 483 529 Less net earnings (loss) attributable to noncontrolling interests 39 45 63 Net earnings (loss) attributable to Liberty Interactive Corporation shareholders $ 520 438 466 (1) Includes stock-based compensation of $83 million, $110 million and $84 million for the years ended December 31, 2014, 2013 and 2012, respectively. F-86 |
|
|
SUMMARY ATTRIBUTED FINANCIAL DATA (Continued) Ventures Group December 31, 2014 December 31, 2013 amounts in millions Summary balance sheet data: Cash and cash equivalents $ 1,884 307 Investments in available-for-sale securities and other cost investments $ 1,220 1,309 Investments in affiliates, accounted for using the equity method $ 1,258 894 Intangible assets not subject to amortization, net $ 259 — Long-term debt, including current portion $ 2,191 1,932 Deferred tax liabilities, including current portion $ 1,987 1,885 Attributed net assets (liabilities) $ 1,393 558 Years ended December 31, 2014 2013 2012 amounts in millions Summary operations data: Revenue $ 471 — — Cost of sales (306) — — Operating expenses (37) — — Selling, general and administrative expenses (1) (127) (19) (12) Depreciation and amortization (19) — — Operating income (loss) (18) (19) (12) Interest expense (75) (90) (144) Share of earnings (losses) of affiliates, net (12) (15) 19 Realized and unrealized gains (losses) on financial instruments, net (35) (10) (402) Gains (losses) on transactions, net 74 — 443 Other, net 22 25 47 Income tax benefit (expense) 48 163 79 Earnings (loss) from continuing operations 4 54 30 Earnings (loss) from discontinued operations, net of taxes 63 43 1,032 Net earnings (loss) 67 97 1,062 Less net earnings (loss) attributable to noncontrolling interests 50 34 (2) Net earnings (loss) attributable to Liberty Interactive Corporation shareholders $ 17 63 1,064 (1) Includes stock-based compensation of $25 million, $8 million and $7 million for the years ended December 31, 2014, 2013 and 2012, respectively. F-87 |
|
|
BALANCE SHEET INFORMATION December 31, 2014 (unaudited) Attributed (note 1) QVC Ventures Inter-group Consolidated Group Group eliminations Liberty amounts in millions Assets Current assets: Cash and cash equivalents $ 422 1,884 — 2,306 Trade and other receivables, net 1,196 36 — 1,232 Inventory, net 882 167 — 1,049 Short-term marketable securities 21 868 — 889 Other current assets 262 9 (199) 72 Total current assets 2,783 2,964 (199) 5,548 Investments in available-for-sale securities and other cost investments (note 2) 4 1,220 — 1,224 Investments in affiliates, accounted for using the equity method (note 3) 375 1,258 — 1,633 Property and equipment, net 1,026 67 — 1,093 Intangible assets not subject to amortization, net 7,634 259 — 7,893 Intangible assets subject to amortization, net 1,130 55 — 1,185 Other assets, at cost, net of accumulated amortization 60 5 — 65 Total assets $ 13,012 5,828 (199) 18,641 Liabilities and Equity Current liabilities: Intergroup payable (receivable) $ (5) 5 — — Accounts payable 629 106 — 735 Accrued liabilities 688 55 — 743 Current portion of debt (note 4) 9 937 — 946 Deferred tax liabilities — 1,171 (199) 972 Other current liabilities 269 74 — 343 Total current liabilities 1,590 2,348 (199) 3,739 Long-term debt (note 4) 5,851 1,254 — 7,105 Deferred income tax liabilities 1,033 816 — 1,849 Other liabilities 157 11 — 168 Total liabilities 8,631 4,429 (199) 12,861 Equity/Attributed net assets (liabilities) 4,280 1,393 — 5,673 Noncontrolling interests in equity of subsidiaries 101 6 — 107 Total liabilities and equity $ 13,012 5,828 (199) 18,641 F-88 |
|
|
BALANCE SHEET INFORMATION December 31, 2013 (unaudited) Attributed (note 1) QVC Ventures Inter-group Consolidated Group Group eliminations Liberty amounts in millions Assets Current assets: Cash and cash equivalents $ 595 307 — 902 Trade and other receivables, net 1,148 4 — 1,152 Inventory, net 1,123 — — 1,123 Short-term marketable securities — 412 — 412 Other current assets 354 — (170) 184 Current assets of discontinued operations 25 628 — 653 Total current assets 3,245 1,351 (170) 4,426 Investments in available-for-sale securities and other cost investments (note 2) 4 1,309 — 1,313 Investments in affiliates, accounted for using the equity method (note 3) 343 894 — 1,237 Property and equipment, net 1,208 — — 1,208 Intangible assets not subject to amortization, net 8,383 — — 8,383 Intangible assets subject to amortization, net 1,587 — — 1,587 Other assets, at cost, net of accumulated amortization 80 — — 80 Noncurrent assets of discontinued operations 12 6,430 — 6,442 Total assets $ 14,862 9,984 (170) 24,676 Liabilities and Equity Current liabilities: Intergroup payable (receivable) $ 221 (221) — — Accounts payable 606 — — 606 Accrued liabilities 883 20 — 903 Current portion of debt (note 4) 39 870 — 909 Deferred tax liabilities — 1,095 (170) 925 Other current liabilities 145 3 — 148 Current liabilities of discontinued operations 22 243 — 265 Total current liabilities 1,916 2,010 (170) 3,756 Long-term debt (note 4) 5,044 1,062 — 6,106 Deferred income tax liabilities 1,207 790 4 2,001 Other liabilities 191 — — 191 Noncurrent liabilities of discontinued operations 2 1,189 (4) 1,187 Total liabilities 8,360 5,051 (170) 13,241 Equity/Attributed net assets (liabilities) 6,378 558 — 6,936 Noncontrolling interests in equity of subsidiaries 124 4,375 — 4,499 Total liabilities and equity $ 14,862 9,984 (170) 24,676 F-89 |
|
|
STATEMENT OF OPERATIONS INFORMATION Year ended December 31, 2014 (unaudited) Attributed (note 1) QVC Ventures Consolidated Group Group Liberty amounts in millions Total revenue, net $ 10,028 471 10,499 Operating costs and expenses: Cost of retail sales (exclusive of depreciation shown separately below) 6,378 306 6,684 Operating 854 37 891 Selling, general and administrative, including stock-based compensation (note 5) 940 127 1,067 Depreciation and amortization 643 19 662 Impairment of intangible assets 7 — 7 8,822 489 9,311 Operating income (loss) 1,206 (18) 1,188 Other income (expense): Interest expense (312) (75) (387) Share of earnings (losses) of affiliates, net (note 3) 51 (12) 39 Realized and unrealized gains (losses) on financial instruments, net (22) (35) (57) Gains (losses) on transactions, net — 74 74 Other, net (43) 22 (21) (326) (26) (352) Earnings (loss) from continuing operations before income taxes 880 (44) 836 Income tax benefit (expense) (306) 48 (258) Net earnings (loss) from continuing operations 574 4 578 Net earnings (loss) from discontinued operations, net of taxes (15) 63 48 Net earnings (loss) 559 67 626 Less net earnings (loss) attributable to noncontrolling interests 39 50 89 Net earnings (loss) attributable to Liberty Interactive Corporation shareholders $ 520 17 537 F-90 |
|
|
STATEMENT OF OPERATIONS INFORMATION Year ended December 31, 2013 (unaudited) Attributed (note 1) QVC Ventures Consolidated Group Group Liberty amounts in millions Total revenue, net $ 10,219 — 10,219 Operating costs and expenses: Cost of retail sales (exclusive of depreciation shown separately below) 6,533 — 6,533 Operating 862 — 862 Selling, general and administrative, including stock-based compensation (note 5) 1,010 19 1,029 Depreciation and amortization 629 — 629 Impairment of intangible assets 30 — 30 9,064 19 9,083 Operating income (loss) 1,155 (19) 1,136 Other income (expense): Interest expense (290) (90) (380) Share of earnings (losses) of affiliates, net (note 3) 48 (15) 33 Realized and unrealized gains (losses) on financial instruments, net (12) (10) (22) Gains (losses) on transactions, net (1) — (1) Other, net (54) 25 (29) (309) (90) (399) Earnings (loss) from continuing operations before income taxes 846 (109) 737 Income tax benefit (expense) (346) 163 (183) Earnings (loss) from continuing operations, net of taxes 500 54 554 Earnings (loss) from discontinued operations, net of taxes (17) 43 26 Net earnings (loss) 483 97 580 Less net earnings (loss) attributable to noncontrolling interests 45 34 79 Net earnings (loss) attributable to Liberty Interactive Corporation shareholders $ 438 63 501 F-91 |
|
|
STATEMENT OF OPERATIONS INFORMATION Year ended December 31, 2012 (unaudited) Attributed (note 1) QVC Ventures Consolidated Group Group Liberty amounts in millions Total revenue, net $ 9,888 — 9,888 Operating costs and expenses: Cost of retail sales (exclusive of depreciation shown separately below) 6,307 — 6,307 Operating 819 — 819 Selling, general and administrative, including stock-based compensation (note 5) 943 12 955 Depreciation and amortization 591 — 591 Impairment of intangible assets 53 — 53 8,713 12 8,725 Operating income (loss) 1,175 (12) 1,163 Other income (expense): Interest expense (322) (144) (466) Share of earnings (losses) of affiliates, net (note 3) 28 19 47 Realized and unrealized gains (losses) on financial instruments, net 51 (402) (351) Gains (losses) on transactions, net — 443 443 Other, net — 47 47 (243) (37) (280) Earnings (loss) before income taxes 932 (49) 883 Income tax benefit (expense) (357) 79 (278) Earnings (loss) from continuing operations 575 30 605 Earnings (loss) from discontinued operations, net of taxes (46) 1,032 986 Net earnings (loss) 529 1,062 1,591 Less net earnings (loss) attributable to noncontrolling interests 63 (2) 61 Net earnings (loss) attributable to Liberty Interactive Corporation shareholders $ 466 1,064 1,530 F-92 |
|
|
STATEMENT OF CASH FLOWS INFORMATION Year ended December 31, 2014 (unaudited) Attributed (note 1) QVC Group Ventures Group Consolidated Liberty amounts in millions Cash flows from operating activities: Net earnings (loss) $ 559 67 626 Adjustments to reconcile net earnings to net cash provided by operating activities: (Earnings) loss from discontinued operations 15 (63) (48) Depreciation and amortization 643 19 662 Stock-based compensation 83 25 108 Cash payments for stock-based compensation (13) (2) (15) Excess tax benefit from stock-based compensation (20) (1) (21) Noncash interest expense 6 — 6 Share of (earnings) losses of affiliates, net (51) 12 (39) Cash receipts from returns on equity investments 22 23 45 Realized and unrealized (gains) losses on financial instruments, net 22 35 57 (Gains) losses on transactions, net — (74) (74) (Gains) losses on extinguishment of debt 48 — 48 Impairment of intangible assets 7 — 7 Deferred income tax expense (benefit) (160) 119 (41) Intergroup tax allocation 169 (169) — Intergroup tax payments (388) 388 — Other noncash charges (credits), net (3) 1 (2) Changes in operating assets and liabilities Current and other assets (80) (4) (84) Payables and other liabilities 345 60 405 Net cash provided (used) by operating activities 1,204 436 1,640 Cash flows from investing activities: Cash proceeds from dispositions — 163 163 Investment in and loans to cost and equity investees (4) (87) (91) Capital expended for property and equipment (226) (15) (241) Purchases of short term investments and other marketable securities (73) (791) (864) Sales of short term investments and other marketable securities 52 539 591 Other investing activities, net (30) 14 (16) Net cash provided (used) by investing activities (281) (177) (458) Cash flows from financing activities: Borrowings of debt 4,360 146 4,506 Repayments of debt (3,563) (186) (3,749) Intergroup receipts (payments), net (1,035) 1,035 — Repurchases of Liberty Interactive common stock (785) — (785) Taxes paid in lieu of shares issued for stock-based compensation (25) (1) (26) Excess tax benefit from stock-based compensation 20 1 21 Other financing activities, net (8) (25) (33) Net cash provided (used) by financing activities (1,036) 970 (66) Effect of foreign currency exchange rates on cash (46) — (46) Net cash provided (used) by discontinued operations: Cash provided (used) by operating activities (20) 293 273 Cash provided (used) by investing activities — (194) (194) Cash provided (used) by financing activities 3 368 371 Change in available cash held by discontinued operations 3 (119) (116) Net cash provided (used) by discontinued operations (14) 348 334 Net increase (decrease) in cash and cash equivalents (173) 1,577 1,404 Cash and cash equivalents at beginning of period 595 307 902 Cash and cash equivalents at end of period $ 422 1,884 2,306 F-93 |
|
|
STATEMENT OF CASH FLOWS INFORMATION Year ended December 31, 2013 (unaudited) Attributed (note 1) Consolidated QVC Group Ventures Group Liberty amounts in millions Cash flows from operating activities: Net earnings (loss) $ 483 97 580 Adjustments to reconcile net earnings to net cash provided by operating activities: (Earnings) loss from discontinued operations 17 (43) (26) Depreciation and amortization 629 — 629 Stock-based compensation 110 8 118 Cash payments for stock-based compensation (8) — (8) Excess tax benefit from stock-based compensation (13) — (13) Noncash interest expense 12 1 13 Share of losses (earnings) of affiliates, net (48) 15 (33) Cash receipts from return on equity investments 16 19 35 Realized and unrealized gains (losses) on financial instruments, net 12 10 22 (Gains) losses on transactions, net 1 — 1 (Gains) losses on extinguishment of debt 57 — 57 Impairment of intangible assets 30 — 30 Deferred income tax (benefit) expense (132) 110 (22) Intergroup tax allocation 272 (272) — Intergroup tax payments (52) 52 — Other noncash charges (credits), net (14) 11 (3) Changes in operating assets and liabilities Current and other assets (81) (3) (84) Payables and other current liabilities (306) 37 (269) Net cash provided (used) by operating activities 985 42 1,027 Cash flows from investing activities: Cash proceeds from dispositions 1 1,136 1,137 Investments in and loans to cost and equity investees (4) (380) (384) Capital expended for property and equipment (291) — (291) Cash paid for acquisitions, net of cash acquired (24) — (24) Purchases of short term and other marketable securities — (959) (959) Sales of short term investments and other marketable securities — 400 400 Other investing activities, net (38) (3) (41) Net cash provided (used) by investing activities (356) 194 (162) Cash flows from financing activities: Borrowings of debt 3,520 841 4,361 Repayments of debt (3,052) (2,363) (5,415) Repurchases of Liberty Interactive common stock (1,089) — (1,089) Taxes paid in lieu of shares issued for stock-based compensation (21) — (21) Excess tax benefit from stock-based compensation 13 — 13 Other financing activities, net (57) — (57) Net cash provided (used) by financing activities (686) (1,522) (2,208) Effect of foreign currency rates on cash (24) — (24) Net cash provided (used) by discontinued operations: Cash provided (used) by operating activities (13) 346 333 Cash provided (used) by investing activities (6) (192) (198) Cash provided (used) by financing activities (1) (171) (172) Change in available cash held by discontinued operations (2) 17 15 Net cash provided (used) by discontinued operations (22) — (22) Net increase (decrease) in cash and cash equivalents (103) (1,286) (1,389) Cash and cash equivalents at beginning of period 698 1,593 2,291 Cash and cash equivalents at end period $ 595 307 902 F-94 |
|
|
STATEMENT OF CASH FLOWS INFORMATION Year ended December 31, 2012 (unaudited) Attributed (note 1) Consolidated QVC Group Ventures Group Liberty amounts in millions Cash flows from operating activities: Net earnings (loss) $ 529 1,062 1,591 Adjustments to reconcile net earnings to net cash provided by operating activities: (Earnings) loss from discontinued operations 46 (1,032) (986) Depreciation and amortization 591 — 591 Stock-based compensation 84 7 91 Cash payments for stock-based compensation (12) — (12) Excess tax benefit from stock-based compensation (56) (8) (64) Noncash interest expense 9 — 9 Share of losses (earnings) of affiliates, net (28) (19) (47) Cash receipts from return on equity investments 11 34 45 Realized and unrealized gains (losses) on financial instruments, net (51) 402 351 (Gains) losses on transactions, net — (443) (443) Impairment of intangible assets 53 — 53 Deferred income tax (benefit) expense (177) 123 (54) Intergroup tax allocation 152 (152) — Intergroup tax payments (33) 33 — Other noncash charges (credits), net 1 1 2 Changes in operating assets and liabilities Current and other assets (77) (1) (78) Payables and other current liabilities 430 (32) 398 Net cash provided (used) by operating activities 1,472 (25) 1,447 Cash flows from investing activities: Cash proceeds from dispositions — 692 692 Proceeds (settlements) of financial instruments, net — (258) (258) Investments in and loans to cost and equity investees (59) (177) (236) Capital expended for property and equipment (333) — (333) Cash paid for acquisitions, net of cash acquired (83) — (83) Purchases of short term investments and other marketable securities — (58) (58) Sales of short term investments and other marketable securities 46 — 46 Other investing activities, net (29) (10) (39) Net cash provided (used) by investing activities (458) 189 (269) Cash flows from financing activities: Borrowings of debt 2,305 — 2,305 Repayments of debt (1,385) (115) (1,500) Intergroup receipts (payments), net 160 (160) — Reattribution of cash between groups (1,346) 1,346 — Repurchases of Liberty common stock (815) — (815) Proceeds from rights offering — 328 328 Taxes paid in lieu of shares issued for stock-based compensation (112) (16) (128) Excess tax benefit from stock-based compensation 56 8 64 Other financing activities, net (5) — (5) Net cash provided (used) by financing activities (1,142) 1,391 249 Effect of foreign currency rates on cash (20) — (20) Net cash provided (used) by discontinued operations: Cash provided (used) by operating activities (2) (13) (15) Cash provided (used) by investing activities (4) 426 422 Cash provided (used) by financing activities 6 (7) (1) Change in available cash held by discontinued operations — (368) (368) Net cash provided (used) by discontinued operations — 38 38 Net increase (decrease) in cash and cash equivalents (148) 1,593 1,445 Cash and cash equivalents at beginning of period 846 — 846 Cash and cash equivalents at end period $ 698 1,593 2,291 F-95 |
|
|
Notes to Attributed Financial Information (unaudited) (1) On August 9, 2012, Liberty completed the approved recapitalization of its common stock through the creation of the Liberty Interactive common stock and Liberty Ventures common stock as tracking stocks. In the recapitalization, each holder of Liberty Interactive Corporation common stock remained a holder of the same amount and series of Liberty Interactive common stock and received 0.05 of a share of the corresponding series of Liberty Ventures common stock, by means of a dividend, with cash issued in lieu of fractional shares of Liberty Ventures common stock. At the time of issuance of Liberty Ventures common stock, cash of $1,346 million was reattributed to the Ventures Group from the QVC Group. The QVC Group borrowed funds under QVC's credit facility in connection with the completion of the recapitalization to have the appropriate amount of cash available to be attributed to each Group. On October 3, 2014, Liberty reattributed from the QVC Group to the Ventures Group its Digital Commerce companies, which were valued at $1.5 billion, and approximately $1 billion in cash. In connection with the reattribution, each holder of Liberty Interactive common stock received 0.14217 of a share of the corresponding series of Liberty Ventures common stock for each share of Liberty Interactive common stock held as of the record date, with cash paid in lieu of fractional shares. The distribution date for the dividend was on October 20, 2014, and the Liberty Interactive common stock began trading ex-dividend on October 15, 2014. The reattribution of the Digital Commerce companies is presented on a prospective basis from the date of the reattribution in Liberty’s consolidated financial statements, with October 1, 2014 used as a proxy for the date of the reattribution. Accordingly, the financial results of the Digital Commerce companies are reflected in the QVC through the period ending September 30, 2014 and are reflected in the Ventures group for the period beginning October 1, 2014. Subsequent to the reattribution, the QVC Group is comprised of our consolidated subsidiary, QVC and our interest in HSN, Inc. Accordingly, the accompanying attributed financial information for the QVC Group includes the foregoing investment, as well as the assets, liabilities, revenue, expenses and cash flows of QVC. We have also attributed certain of our debt obligations (and related interest expense) to the QVC Group based upon a number of factors, including the cash flow available to the QVC Group and its ability to pay debt service and our assessment of the optimal capitalization for the QVC Group. The specific debt obligations attributed to each of the QVC Group and the Ventures Group are described in note 4 below. In addition, we have allocated certain corporate general and administrative expenses between the QVC Group and the Ventures Group as described in note 5 below. The QVC Group is primarily comprised of our merchandise-focused televised-shopping programs, Internet and mobile application businesses. Accordingly, we expect that businesses that we may acquire in the future that we believe are complementary to this strategy will also be attributed to the QVC Group. Subsequent to the reattribution, the Ventures Group consists of all of our businesses not included in the QVC Group including our Digital Commerce businesses and interests in equity method investments of Expedia, Inc., Interval Leisure Group, Inc., FTD and LendingTree and available-for-sale securities Time Warner, Time Warner Cable and AOL. Accordingly, the accompanying attributed financial information for the Ventures Group includes these investments, as well as the assets, liabilities, revenue, expenses and cash flows of the Digital Commerce businesses. In addition, we have attributed to the Ventures Group all of our senior exchangeable debentures (and related interest expense). See note 4 below for the debt obligations attributed to the Ventures Group. F-96 |
|
|
Any businesses that we may acquire in the future that we do not attribute to the QVC Group will be attributed to the Ventures Group. (2) Investments in available-for-sale securities, including non-strategic securities, and other cost investments are summarized as follows: December 31, 2014 December 31, 2013 amounts in millions QVC Group Other cost investments $ 4 4 Total QVC Group 4 4 Ventures Group Time Warner Inc. 375 306 Time Warner Cable Inc. 815 741 Other AFS investments 30 262 Total Ventures Group 1,220 1,309 Consolidated Liberty $ 1,224 1,313 (3) The following table presents information regarding certain equity method investments: Share of earnings (losses) December 31, 2014 Percentage Carrying Market Years ended December 31, ownership value value 2014 2013 2012 dollar amounts in millions QVC Group HSN, Inc. (2) 38 % $ 328 1,521 60 61 40 Other various 47 N/A (9) (13) (12) Total QVC Group 375 51 48 28 Ventures Group Expedia, Inc. (1)(2) 18 % 514 1,992 58 31 67 FTD 35 355 355 N/A N/A N/A Other various 389 N/A (70) (46) (48) Total Ventures Group 1,258 (12) (15) 19 Consolidated Liberty $ 1,633 39 33 47 (1) Liberty entered into a forward sales contract on 12 million shares of Expedia common stock in March 2012 at a per share forward price of $34.316. The forward contract was settled in October 2012 for total cash proceeds of $412 million and the 12 million shares of Expedia common stock, previously held as collateral, were released to the counterparty. In the fourth quarter when the forward contract settled, the difference between the fair value of the Expedia shares and the carrying value of the shares ($443 million) was recognized in the gain (loss) on dispositions, net line item in the statement of operations. Liberty owns an approximate 18% equity interest and 58% voting interest in Expedia. Liberty has entered into governance arrangements pursuant to which Mr. Barry Diller, Chairman of the Board and Senior Executive Officer of Expedia, may vote its interests of Expedia, subject to certain limitations. Additionally, through our governance arrangements with Mr. Diller, we have the right to appoint and have appointed 20% of the members of Expedia's board of directors, which is currently comprised of 10 members. Therefore, we determined based on these arrangements that we have significant influence through our arrangements with Expedia and have accounted for the investment as an equity method affiliate. F-97 |
|
|
(2) During the year ended December 31, 2014, Expedia, Inc. and HSN, Inc. paid dividends aggregating $15 million and $22 million, respectively, which were recorded as reductions to the investment balances. (4) Debt attributed to the Interactive Group and the Ventures Group is comprised of the following: December 31, 2014 Outstanding Carrying principal value amounts in millions QVC Group Corporate level notes and debentures 8.5% Senior Debentures due 2029 $ 287 285 8.25% Senior Debentures due 2030 504 501 1% Exchangeable Senior Debentures due 2043 400 444 Subsidiary level notes and facilities QVC 7.5% Senior Secured Notes due 2019 — — QVC 3.125% Senior Secured Notes due 2019 400 399 QVC 7.375% Senior Secured Notes due 2020 500 500 QVC 5.125% Senior Secured Notes due 2022 500 500 QVC 4.375% Senior Secured Notes due 2023 750 750 QVC 4.850% Senior Secured Notes due 2024 600 600 QVC 4.45% Senior Secured Notes due 2025 600 599 QVC 5.45% Senior Secured Notes due 2034 400 399 QVC 5.95% Senior Secured Notes due 2043 300 300 QVC Bank Credit Facilities 508 508 Other subsidiary debt 75 75 Total QVC Group 5,824 5,860 Ventures Group Corporate level debentures 4% Exchangeable Senior Debentures due 2029 438 294 3.75% Exchangeable Senior Debentures due 2030 438 291 3.5% Exchangeable Senior Debentures due 2031 355 325 0.75% Exchangeable Senior Debentures due 2043 850 1,220 Subsidiary level notes and facilities Other subsidiary debt 61 61 Total Ventures Group 2,142 2,191 Total consolidated Liberty debt $ 7,966 8,051 Less debt classified as current (946) Total long-term debt 7,105 (5) Cash compensation expense for our corporate employees will be allocated among the QVC Group and the Ventures Group based on the estimated percentage of time spent providing services for each group. On a semiannual basis estimated time spent will be determined through an interview process and a review of personnel duties unless transactions significantly change the composition of companies and investments in either respective group which would require a more timely reevaluation of estimated time spent. Other general and administrative expenses will be charged directly to the groups whenever possible and are otherwise allocated based on estimated usage or some other reasonably determined methodology. Amounts allocated from the QVC Group to the Ventures Group was determined to be $18 million, $11 million and $5 million for the years ended December 31, 2014, 2013 and 2012, respectively. We note that stock compensation related to each tracking stock group is F-98 |
|
|
determined based on actual options outstanding for each respective tracking stock group, therefore, as it relates to periods prior to the Split-Off, no stock compensation expense was recognized by the Ventures group. While we believe that this allocation method is reasonable and fair to each group, we may elect to change the allocation methodology or percentages used to allocate general and administrative expenses in the future. (6) We have accounted for income taxes for the QVC Group and the Ventures Group in the accompanying attributed financial information in a manner similar to a stand-alone company basis. To the extent this methodology differs from our tax sharing policy, differences have been reflected in the attributed net assets of the groups. QVC Group Income tax benefit (expense) consists of: Years ended December 31, 2014 2013 2012 amounts in millions Current: Federal $ (325) (370) (369) State and local (31) (26) (25) Foreign (110) (82) (140) $ (466) (478) (534) Deferred: Federal $ 143 195 151 State and local 12 (57) 19 Foreign 5 (6) 7 160 132 177 Income tax benefit (expense) $ (306) (346) (357) Income tax benefit (expense) differs from the amounts computed by applying the U.S. federal income tax rate of 35% as a result of the following: Years ended December 31, 2014 2013 2012 amounts in millions Computed expected tax benefit (expense) $ (308) (296) (326) State and local income taxes, net of federal income taxes (14) (24) (4) Foreign taxes, net of foreign tax credits (2) (7) 5 Sale of consolidated subsidiary 14 Change in valuation allowance affecting tax expense — (23) (8) Impairment of intangible assets not deductible for tax purposes (3) (2) (16) Dividends received deductions 4 5 3 Impact of change in state rate on deferred taxes 1 3 — Other, net 2 (2) (11) Income tax benefit (expense) $ (306) (346) (357) F-99 |
|
|
The tax effects of temporary differences that give rise to significant portions of the deferred income tax assets and deferred income tax liabilities are presented below: December 31, 2014 2013 amounts in millions Deferred tax assets: Net operating and capital loss carryforwards $ 40 58 Foreign tax credit carryforwards 88 129 Accrued stock compensation 18 26 Other accrued liabilities 139 79 Other future deductible amounts 193 134 Deferred tax assets 478 426 Valuation allowance (47) (48) Net deferred tax assets 431 378 Deferred tax liabilities: Intangible assets 1,242 1,417 Other deferred tax liabilities 23 — Deferred tax liabilities 1,265 1,417 Net deferred tax liabilities $ 834 1,039 The Company's deferred tax assets and liabilities are reported in the accompanying balance sheet information as follows: December 31, 2014 2013 amounts in millions Current deferred tax (assets) liabilities $ (199) (168) Long-term deferred tax liabilities 1,033 1,207 Net deferred tax liabilities $ 834 1,039 Ventures Group Income tax benefit (expense) consists of: Years ended December 31, 2014 2013 2012 amounts in millions Current: Federal $ 168 273 202 State and local (1) — (1) Foreign — — 1 $ 167 273 202 Deferred: Federal $ (84) (214) (132) State and local (35) 104 9 Foreign — — — (119) (110) (123) Income tax benefit (expense) $ 48 163 79 F-100 |
|
|
Income tax benefit (expense) differs from the amounts computed by applying the U.S. federal income tax rate of 35% as a result of the following: Years ended December 31, 2014 2013 2012 amounts in millions Computed expected tax benefit (expense) $ 15 38 17 State and local income taxes, net of federal income taxes 7 9 4 Foreign taxes, net of foreign tax credits — — — Impact of change in state rate on deferred taxes (29) 63 — Change in valuation allowance affecting tax expense (2) (4) — Dividends received deductions 6 4 10 Alternative energy tax credits 58 54 48 Other, net (7) (1) — Income tax benefit (expense) $ 48 163 79 The tax effects of temporary differences that give rise to significant portions of the deferred income tax assets and deferred income tax liabilities are presented below: December 31, 2014 2013 amounts in millions Deferred tax assets: Net operating and capital loss carryforwards $ 50 16 Other 39 14 Deferred tax assets 89 30 Valuation allowance (8) (4) Net deferred tax assets 81 26 Deferred tax liabilities: Investments 676 569 Intangible assets 43 — Discount on exchangeable debentures 1,022 965 Deferred gain on debt retirements 257 313 Other 70 64 Deferred tax liabilities 2,068 1,911 Net deferred tax liabilities $ 1,987 1,885 The Company's deferred tax assets and liabilities are reported in the accompanying balance sheet information as follows: December 31, 2014 2013 amounts in millions Current deferred tax liabilities $ 1,171 1,095 Long-term deferred tax liabilities 816 790 Net deferred tax liabilities $ 1,987 1,885 F-101 |
|
|
Intergroup payable (receivable) The intergroup balance, at December 31, 2014, is primarily a result of timing of tax benefits. (7) The Liberty Interactive Stock and the Liberty Ventures Stock have voting and conversion rights under our restated charter. Following is a summary of those rights. Holders of Series A common stock of each group is entitled to one vote per share, and holders of Series B common stock of each group are entitled to ten votes per share. Holders of Series C common stock of each group, if issued, are entitled to 1/100th of a vote per share in certain limited cases and will otherwise not be entitled to vote. In general, holders of Series A and Series B common stock will vote as a single class. In certain limited circumstances, the board may elect to seek the approval of the holders of only Series A and Series B Liberty Interactive Stock or the approval of the holders of only Series A and Series B Liberty Ventures Stock. At the option of the holder, each share of Series B common stock will be convertible into one share of Series A common stock of the same group. At the discretion of our board, the common stock related to one group may be converted into common stock of the same series that is related to the other group. F-102 |
|
|
This page has been intentionally left blank. |
|
|
This page has been intentionally left blank. |
|
|
Annual Report 2014 Corporate Data Board of directors John C. Malone Chairman of the Board Liberty Interactive Corporation Michael A. George President and CEO QVC, Inc. M. Ian G. Gilchrist Retired Investment Banker Gregory B. Maffei President and CEO Liberty Interactive Corporation Evan D. Malone, Ph.D. President NextFab Studio, LLC David E. Rapley Retired President and CEO Rapley Consulting, Inc. M. LaVoy Robison Director The Anschutz Foundation Larry E. Romrell Retired Executive Vice President Tele-Communications, Inc. Andrea L. Wong President, International Production Sony Pictures Television President, International Sony Pictures Entertainment executive committee Gregory B. Maffei John C. Malone compensation committee M. Ian G. Gilchrist (Chairman) David E. Rapley Andrea L. Wong audit committee M. LaVoy Robison (Chairman) M. Ian G. Gilchrist David E. Rapley Larry E. Romrell nominating & corporate governance committee David E. Rapley (Chairman) M. Ian G. Gilchrist Larry E. Romrell Andrea L. Wong senior officers John C. Malone Chairman of the Board Gregory B. Maffei President and CEO Richard N. Baer Senior Vice President and General Counsel Mark D. Carleton Senior Vice President Albert E. Rosenthaler Senior Vice President Christopher W. Shean Senior Vice President and CFO corporate secretarY Pamela L. Coe corporate Headquarters 12300 Liberty Boulevard Englewood, CO 80112 (720) 875-5300 stock information Series A and B Liberty Interactive Common Stock (QVCA/B) and Series A and B Liberty Ventures Common Stock (LVNTA/B) trade on the NASDAQ Global Select Market. cusip numBers QVCA – 53071M 104 QVCB – 53071M 203 LVNTA – 53071M 880 LVNTB – 53071M 872 transfer agent Liberty Interactive Corporation Shareholder Services c/o Computershare P.O. Box 43023 Providence, RI 02940-3023 Phone: (781) 575-4593 Toll free: (866) 367-6355 www.computershare.com Telecommunication Device for the Deaf (TDD) (800) 952-9245 investor relations Courtnee Ulrich Joe Hoelscher Shane Kleinstein Mindy Billinghurst investor@libertyinteractive.com (877) 772-1518 on tHe internet Visit Liberty Interactive Corporation’s website at www.libertyinteractive.com financial statements Liberty Interactive Corporation financial statements are filed with the Securities and Exchange Commission. Copies of these financial statements can be obtained from the Transfer Agent or through the Liberty Interactive Corporation website. |
|
|
liberty interaCtive Corporation 12300 Liberty Boulevard Englewood, CO 80112 www.libertyinteractive.com 720.875.5300 |