--CONFIDENTIAL --Disclaimer (Centerview Partners) This presentation has been prepared by Centerview Partners LLC (“Centerview”) for use solely by the Special Committee of the Board of Directors of HSN, Inc. (“Hero” or the “Company”) in connection with its evaluation of a proposed transaction involving the Company and for no other purpose. The information contained herein is based upon information supplied by Hero and publicly available information, and portions of the information contained herein may be based upon statements, estimates and forecasts provided by the Company. Centerview has relied upon the accuracy and completeness of the foregoing information, and have not assumed any responsibility for any independent verification of such information or for any independent evaluation or appraisal of any of the assets or liabilities (contingent or otherwise) of the Company or any other entity, or concerning the solvency or fair value of the Company or any other entity. With respect to financial forecasts, including with respect to estimates of potential synergies, Centerview has assumed that such forecasts have been reasonably prepared on bases reflecting the best currently available estimates and judgments of the management of the Company as to its financial performances, and at your direction Centerview has relied upon such forecasts, as provided by the Company’s management, with respect to the Company, including as to expected synergies. Centerview assumes no responsibility for and expresses no view as to such forecasts or the assumptions on which they are based. The information set forth herein is based upon economic, monetary, market and other conditions as in effect on, and the information made available to us as of, the date hereof, unless indicated otherwise and Centerview assumes no obligation to update or otherwise revise these materials. The financial analysis in this presentation is complex and is not necessarily susceptible to a partial analysis or summary description. In performing this financial analysis, Centerview has considered the results of its analysis as a whole and did not necessarily attribute a particular weight to any particular portion of the analysis considered. Furthermore, selecting any portion of Centerview’s analysis, without considering the analysis as a whole, would create an incomplete view of the process underlying its financial analysis. Centerview may have deemed various assumptions more or less probable than other assumptions, so the reference ranges resulting from any particular portion of the analysis described above should not be taken to be Centerview’s view of the actual value of the Company. These materials and the information contained herein are confidential, were not prepared with a view toward public disclosure, and may not be disclosed publicly or made available to third parties without the prior written consent of Centerview. These materials and any other advice, written or oral, rendered by Centerview are intended solely for the benefit and use of the Special Committee of the Board of Directors of the Company (in its capacity as such) in its consideration of the proposed transaction, and are not for the benefit of, and do not convey any rights or remedies for any holder of securities of the Company or any other person. Centerview will not be responsible for and has not provided any tax, accounting, actuarial, legal or other specialist advice. These materials are not intended to provide the sole basis for evaluating the proposed transaction, and this presentation does not represent a fairness opinion, recommendation, valuation or opinion of any kind, and is necessarily incomplete and should be viewed solely in conjunction with the oral presentation provided by Centerview. 1
--CONFIDENTIAL --Disclaimer (Goldman Sachs) These materials have been prepared and are provided by Goldman Sachs on a confidential basis solely for the information and assistance of the Special Committee of the Board of Directors (the "Special Committee") of Hero (the "Company") in connection with its consideration of the matters referred to herein. These materials and Goldman Sachs’ presentation relating to these materials (the “Confidential Information”) may not be disclosed to any third party or circulated or referred to publicly or used for or relied upon for any other purpose without the prior written consent of Goldman Sachs. The Confidential Information was not prepared with a view to public disclosure or to conform to any disclosure standards under any state, federal or international securities laws or other laws, rules or regulations, and Goldman Sachs does not take any responsibility for the use of the Confidential Information by persons other than those set forth above. Notwithstanding anything in this Confidential Information to the contrary, the Company may disclose to any person the US federal income and state income tax treatment and tax structure of any transaction described herein and all materials of any kind (including tax opinions and other tax analyses) that are provided to the Company relating to such tax treatment and tax structure, without Goldman Sachs imposing any limitation of any kind. The Confidential Information has been prepared by the Investment Banking Division of Goldman Sachs and is not a product of its research department. Goldman Sachs and its affiliates are engaged in advisory, underwriting and financing, principal investing, sales and trading, research, investment management and other financial and non-financial activities and services for various persons and entities. Goldman Sachs and its affiliates and employees, and funds or other entities they manage or in which they invest or have other economic interests or with which they co-invest, may at any time purchase, sell, hold or vote long or short positions and investments in securities, derivatives, loans, commodities, currencies, credit default swaps and other financial instruments of the Company, any other party to any transaction and any of their respective affiliates or any currency or commodity that may be involved in any transaction. Goldman Sachs’ investment banking division maintains regular, ordinary course client service dialogues with clients and potential clients to review events, opportunities, and conditions in particular sectors and industries and, in that connection, Goldman Sachs may make reference to the Company, but Goldman Sachs will not disclose any confidential information received from the Company. The Confidential Information has been prepared based on historical financial information, forecasts and other information obtained by Goldman Sachs from publicly available sources, the management of the Company or other sources (approved for our use by the Company in the case of information from management and non-public information). In preparing the Confidential Information, Goldman Sachs has relied upon and assumed, without assuming any responsibility for independent verification, the accuracy and completeness of all of the financial, legal, regulatory, tax, accounting and other information provided to, discussed with or reviewed by us, and Goldman Sachs does not assume any liability for any such information. Goldman Sachs does not provide accounting, tax, legal or regulatory advice. Goldman Sachs has not made an independent evaluation or appraisal of the assets and liabilities (including any contingent, derivative or other off-balance sheet assets and liabilities) of the Company or any other party to any transaction or any of their respective affiliates and has no obligation to evaluate the solvency of the Company or any other party to any transaction under any state or federal laws relating to bankruptcy, insolvency or similar matters. The analyses contained in the Confidential Information do not purport to be appraisals nor do they necessarily reflect the prices at which businesses or securities actually may be sold or purchased. Goldman Sachs’ role in any due diligence review is limited solely to performing such a review as it shall deem necessary to support its own advice and analysis and shall not be on behalf of the Company. Analyses based upon forecasts of future results are not necessarily indicative of actual future results, which may be significantly more or less favorable than suggested by these analyses, and Goldman Sachs does not assume responsibility if future results are materially different from those forecast. The Confidential Information does not address the underlying business decision of the Company to engage in any transaction, or the relative merits of any transaction or strategic alternative referred to herein as compared to any other transaction or alternative that may be available to the Company. The Confidential Information is necessarily based on economic, monetary, market and other conditions as in effect on, and the information made available to Goldman Sachs as of, the date of such Confidential Information and Goldman Sachs assumes no responsibility for updating or revising the Confidential Information based on circumstances, developments or events occurring after such date. The Confidential Information does not constitute any opinion, nor does the Confidential Information constitute a recommendation to the Special Committee, any security holder of the Company or any other person as to how to vote or act with respect to any transaction or any other matter. The Confidential Information, including this disclaimer, is subject to, and governed by, any written agreement between the Company, the Board and/or any committee thereof, on the one hand, and Goldman Sachs, on the other hand. 2
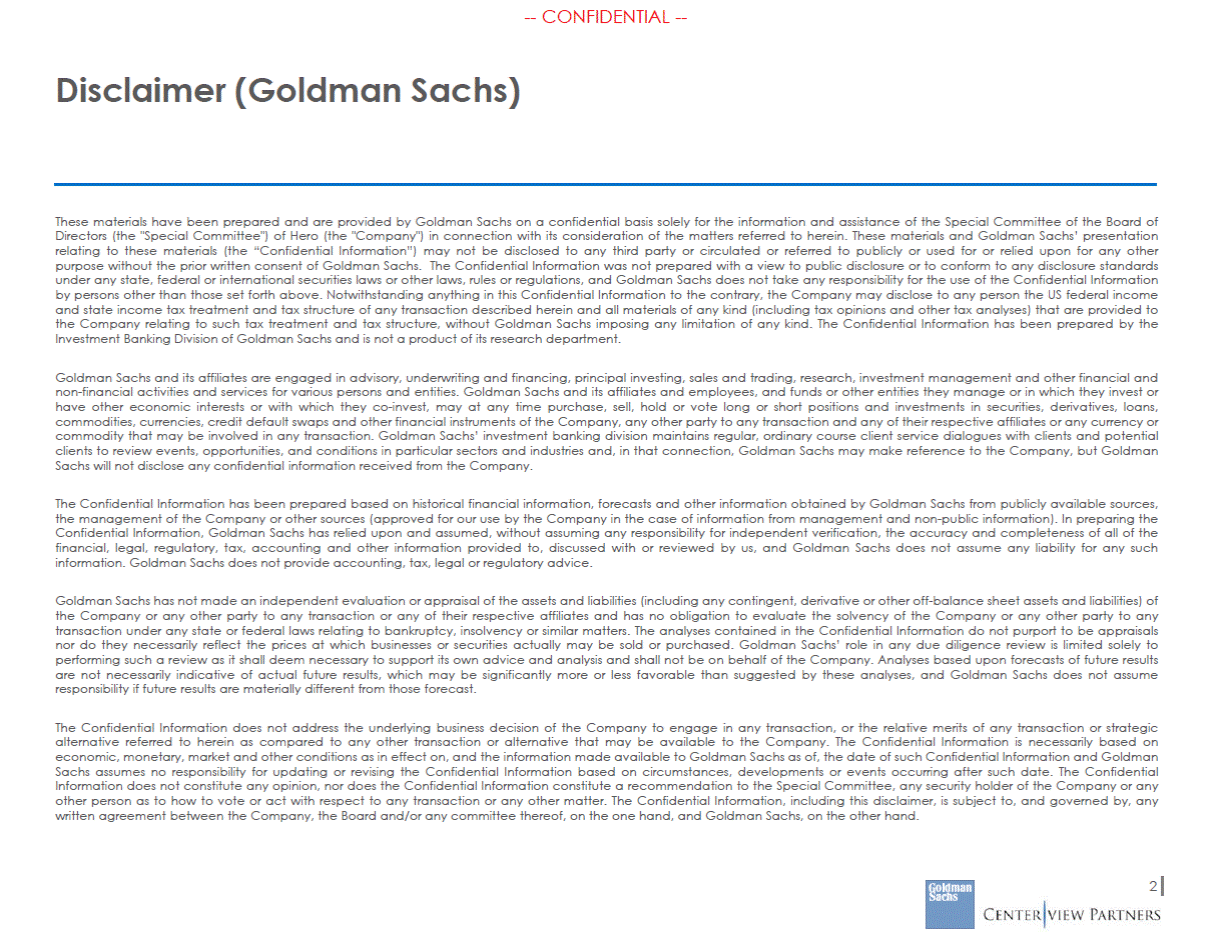
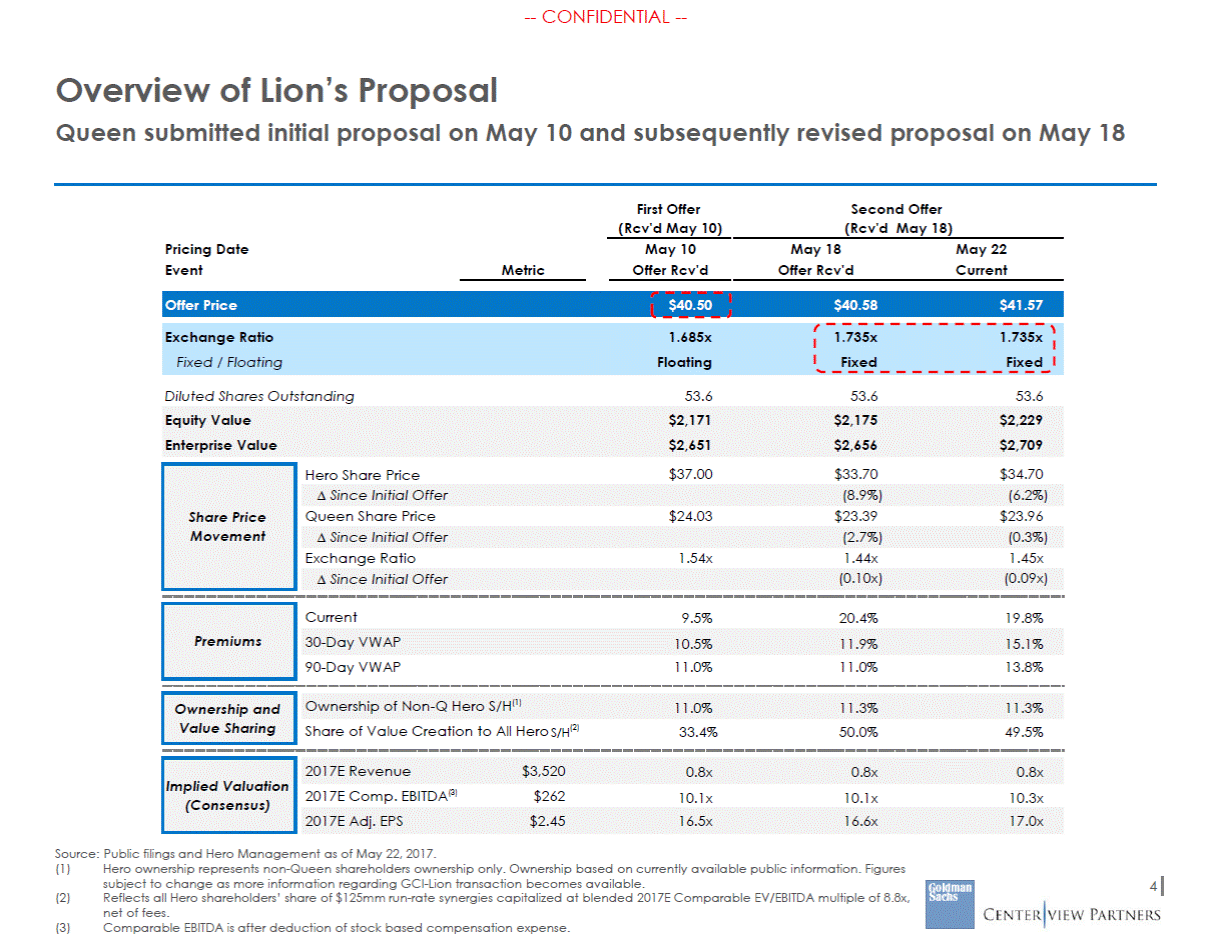
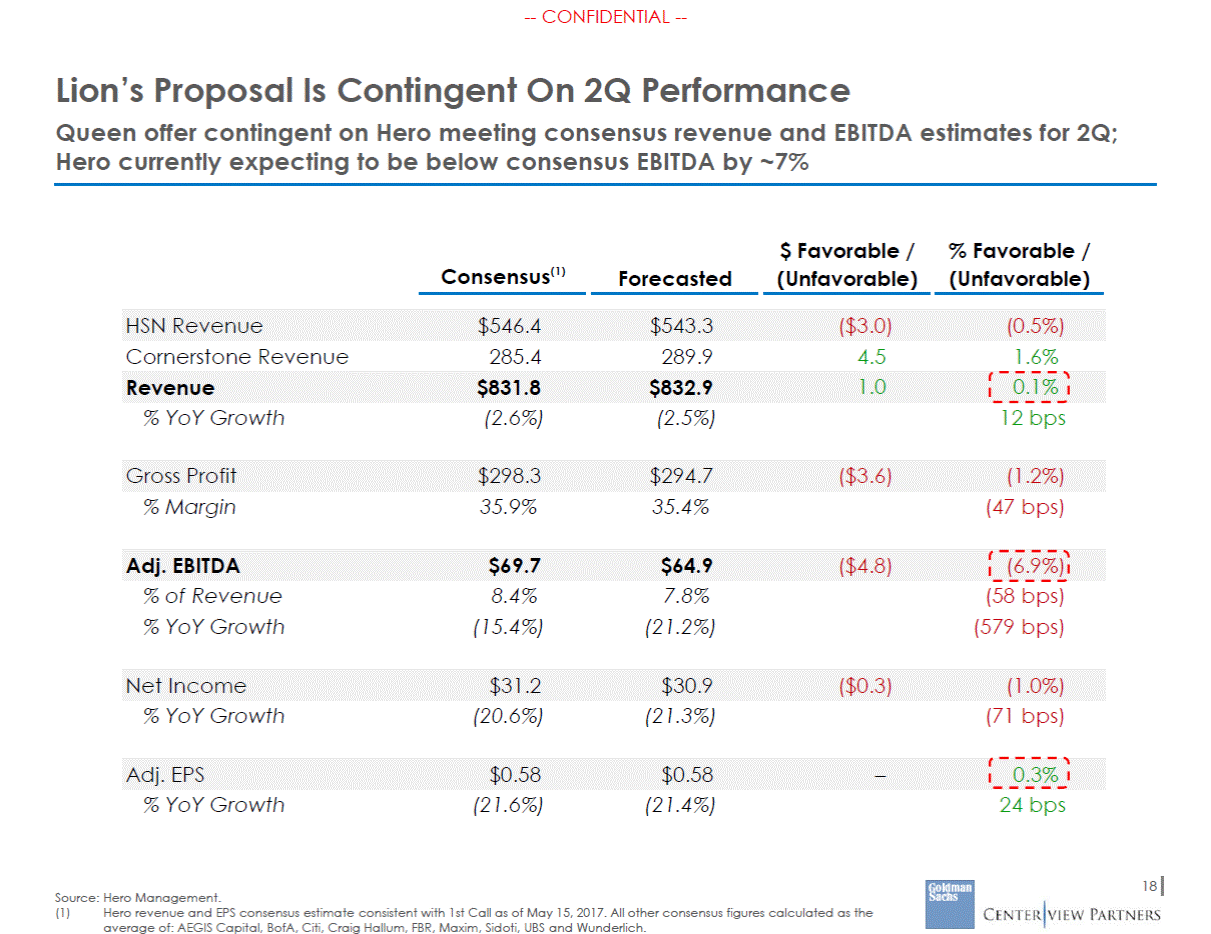
--CONFIDENTIAL --Situation Update On April 4, 2017, Lion Interactive announced an agreement for Lion Ventures Group to acquire GCI and split-off combined company (“GCI Lion”) from Lion Interactive/Queen (would result in Queen becoming an asset-based stock) — Transaction contemplates reattribution of several assets and liabilities to Queen to allow full separation On April 26, 2017, Hero announced the resignation of CEO Mindy Grossman and released preliminary financial results On May 3 and May 9, respectively, Hero released a disappointing 1Q earnings report and Queen reported better-than-expected earnings — Hero reported revenue below consensus and continued challenges in the retail environment; stock dropped (5)% — Queen reported strong EBITDA and EPS performance and improvement in U.S. business; stock rose 11% On May 10, 2017, after market close, Queen submitted a proposal to acquire Hero for $40.50 per share in an all-stock transaction, representing a premium of ~10% to Hero’s closing price on that day — Queen offered Queen A shares (1 vote per share) as consideration as opposed to Queen B shares (10 votes per share) — Offer was for a fixed dollar value per share, rather than a fixed exchange ratio Queen submitted a revised proposal on May 18, 2017, which offered a fixed exchange ratio of 1.735x Queen A shares per Hero share — Implied offer price of $41.57 and premium of ~20% as of May 22; will fluctuate daily with market movements — Proposal implies that Hero’s non-Queen shareholders would own ~11% of the pro forma company — Offer conditioned on Hero meeting consensus estimates for revenue and EBITDA in 2Q (Hero expected to miss consensus EBITDA by ~7% based on latest Management estimates) 3 Source: Public filings and Hero Management as of May 22, 2017.
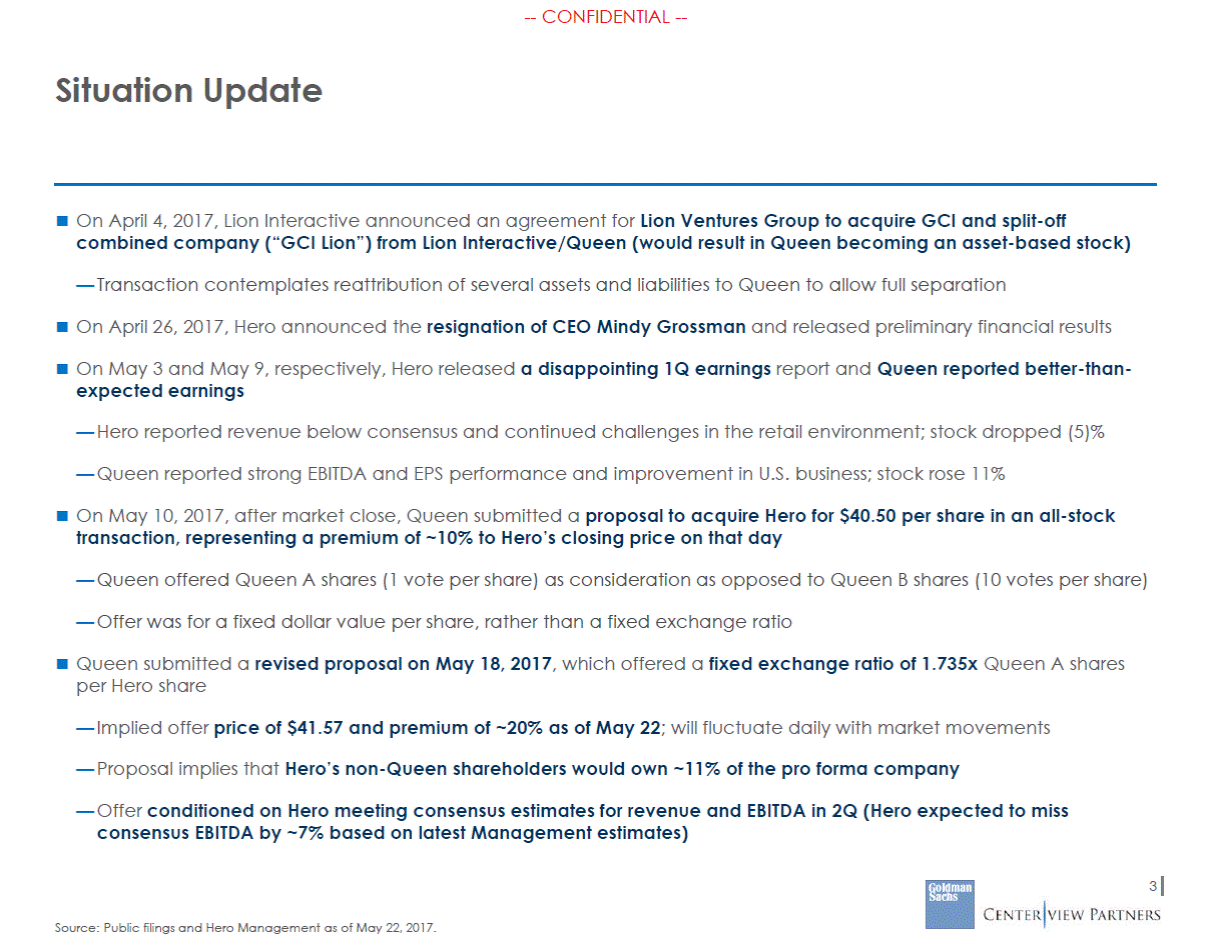
--CONFIDENTIAL --Overview of Lion’s Proposal Queen submitted initial proposal on May 10 and subsequently revised proposal on May 18 First Offer (Rcv'd May 10) Second Offer (Rcv'd May 18) Pricing Date Event May 10 Offer Rcv'd May 18 Offer Rcv'd May 22 Current Metric Diluted Shares Outstanding 53.6 53.6 53.6 Current 9.5% 20.4% 19.8% 90-Day VWAP 11.0% 11.0% 13.8% Source: Public filings and Hero Management as of May 22, 2017. (1) Hero ownership represents non-Queen shareholders ownership only. Ownership based on currently available public information. Figures subject to change as more information regarding GCI-Lion transaction becomes available. Reflects all Hero shareholders’ share of $125mm run-rate synergies capitalized at blended 2017E Comparable EV/EBITDA multiple of 8.8x, net of fees. Comparable EBITDA is after deduction of stock based compensation expense. 4 (2) (3) Implied Valuation (Consensus) 2017E Revenue$3,5200.8x0.8x0.8x 2017E Comp. EBITDA(3)$26210.1x10.1x10.3x 2017E Adj. EPS$2.4516.5x16.6x17.0x Ownership and Value Sharing Ownership of Non-Q Hero S/H(1)11.0%11.3%11.3% Share of Value Creation to All Hero S/H(2) 33.4%50.0%49.5% 30-Day VWAP10.5%11.9%15.1% Premiums Equity Value$2,171$2,175$2,229 Enterprise Value$2,651$2,656$2,709 Share Price Movement Hero Share Price$37.00$33.70$34.70 Queen Share Price$24.03$23.39$23.96 Exchange Ratio1.54x1.44x1.45x Since Initial Offer(0.10x)(0.09x) Since Initial Offer(2.7%)(0.3%) Since Initial Offer(8.9%)(6.2%) Exchange Ratio1.685x1.735x1.735x Fixed / FloatingFloatingFixedFixed Offer Price$40.50$40.58$41.57
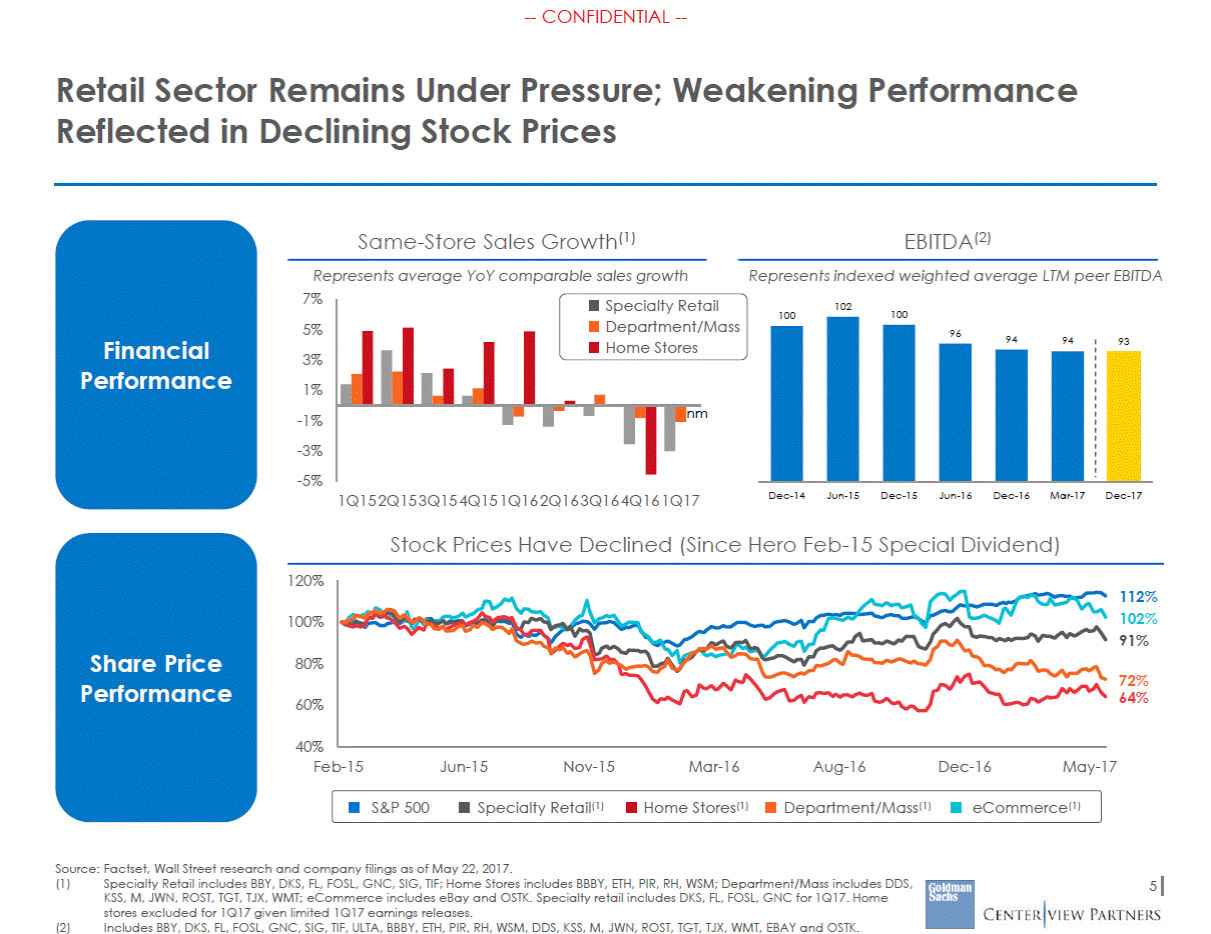
--CONFIDENTIAL --Retail Sector Remains Under Pressure; Weakening Performance Reflected in Declining Stock Prices Same-Store Sales Growth(1) Represents average YoY comparable sales growth EBITDA(2) Represents indexed weighted average LTM peer EBITDA 7% 5% 3% 1% -1% -3% -5% Specialty Retail Department/Mass Home Stores 102 100 100 Financial Performance nm Dec-14 Jun-15 Dec-15 Jun-16 Dec-16 Mar-17 Dec-17 1Q15 2Q15 3Q15 4Q15 1Q16 2Q16 3Q16 4Q16 1Q17 Stock Prices Have Declined (Since Hero Feb-15 Special Dividend) 120% 112% 102% 91% 100% Share Price Performance 80% 72% 64% 60% 40% Feb-15 Jun-15 Nov-15 Mar-16 Aug-16 Dec-16 May-17 S&P 500 Specialty Retail(1) Home Stores(1) Department/Mass(1) eCommerce(1) Source: Factset, Wall Street research and company filings as of May 22, 2017. (1) Specialty Retail includes BBY, DKS, FL, FOSL, GNC, SIG, TIF; Home Stores includes BBBY, ETH, PIR, RH, WSM; Department/Mass includes DDS, KSS, M, JWN, ROST, TGT, TJX, WMT; eCommerce includes eBay and OSTK. Specialty retail includes DKS, FL, FOSL, GNC for 1Q17. Home stores excluded for 1Q17 given limited 1Q17 earnings releases. Includes BBY, DKS, FL, FOSL, GNC, SIG, TIF, ULTA, BBBY, ETH, PIR, RH, WSM, DDS, KSS, M, JWN, ROST, TGT, TJX, WMT, EBAY and OSTK. 5 (2) 96 94 94 93
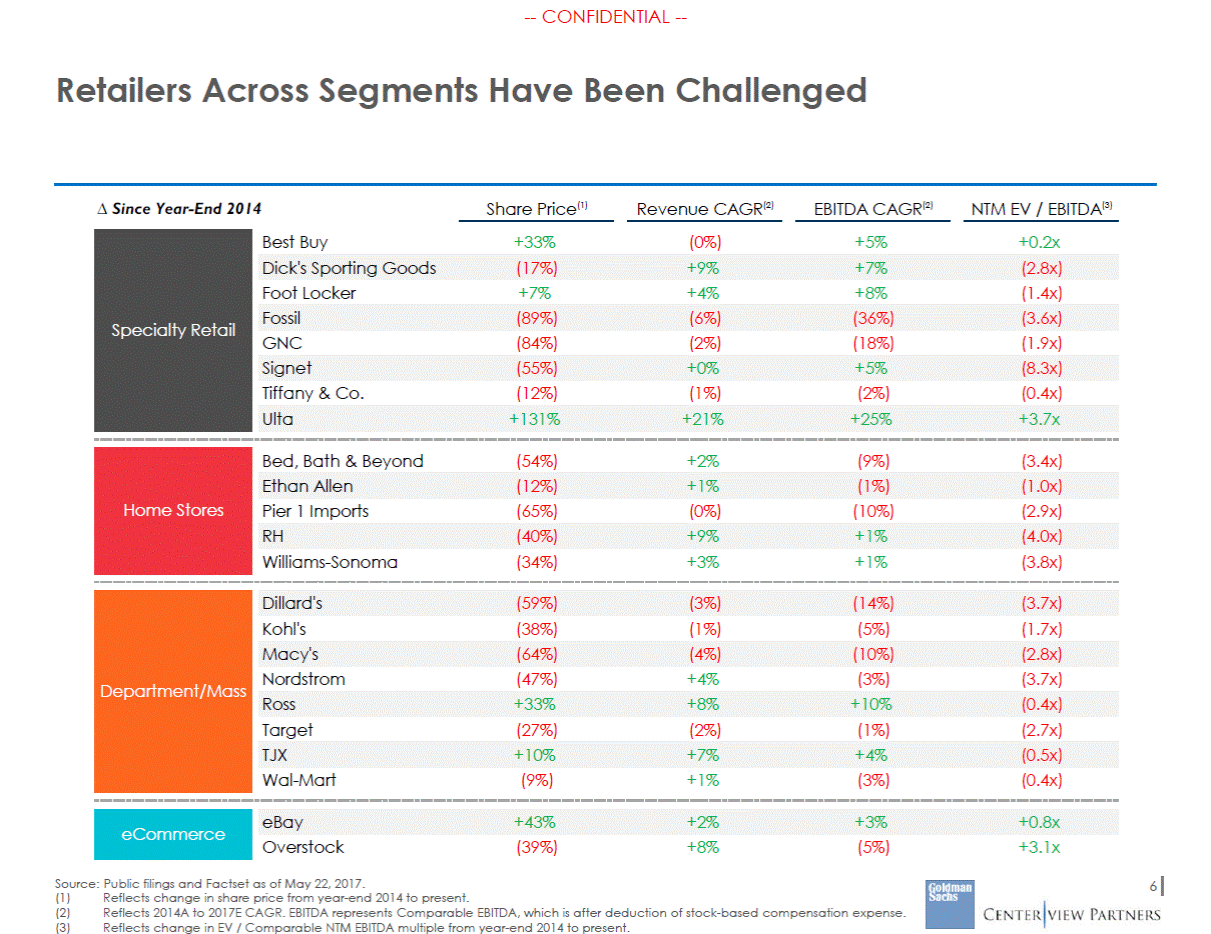
--CONFIDENTIAL --Retailers Across Segments Have Been Challenged Since Year-End 2014 Share Price(1) Revenue CAGR(2) EBITDA CAGR(2) NTM EV / EBITDA(3) Best Buy +33% (0%) +5% +0.2x Foot Locker +7% +4% +8% (1.4x) GNC (84%) (2%) (18%) (1.9x) Tiffany & Co. (12%) (1%) (2%) (0.4x) Bed, Bath & Beyond (54%) +2% (9%) (3.4x) Pier 1 Imports (65%) (0%) (10%) (2.9x) Williams-Sonoma (34%) +3% +1% (3.8x) Kohl's (38%) (1%) (5%) (1.7x) Nordstrom (47%) +4% (3%) (3.7x) Target (27%) (2%) (1%) (2.7x) Wal-Mart (9%) +1% (3%) (0.4x) Overstock (39%) +8% (5%) +3.1x Source: Public filings and Factset as of May 22, 2017. 6 (1) (2) (3) Reflects change in share price from year-end 2014 to present. Reflects 2014A to 2017E CAGR. EBITDA represents Comparable EBITDA, which is after deduction of stock-based compensation expense. Reflects change in EV / Comparable NTM EBITDA multiple from year-end 2014 to present. eBay +43% +2% +3% +0.8x eCommerce TJX +10% +7% +4% (0.5x) Ross +33% +8% +10% (0.4x) Macy's (64%) (4%) (10%) (2.8x) Dillard's (59%) (3%) (14%) (3.7x) Department/Mass RH (40%) +9% +1% (4.0x) Ethan Allen (12%) +1% (1%) (1.0x) Home Stores Ulta +131% +21% +25% +3.7x Signet (55%) +0% +5% (8.3x) Fossil (89%) (6%) (36%) (3.6x) Dick's Sporting Goods (17%) +9% +7% (2.8x) Specialty Retail
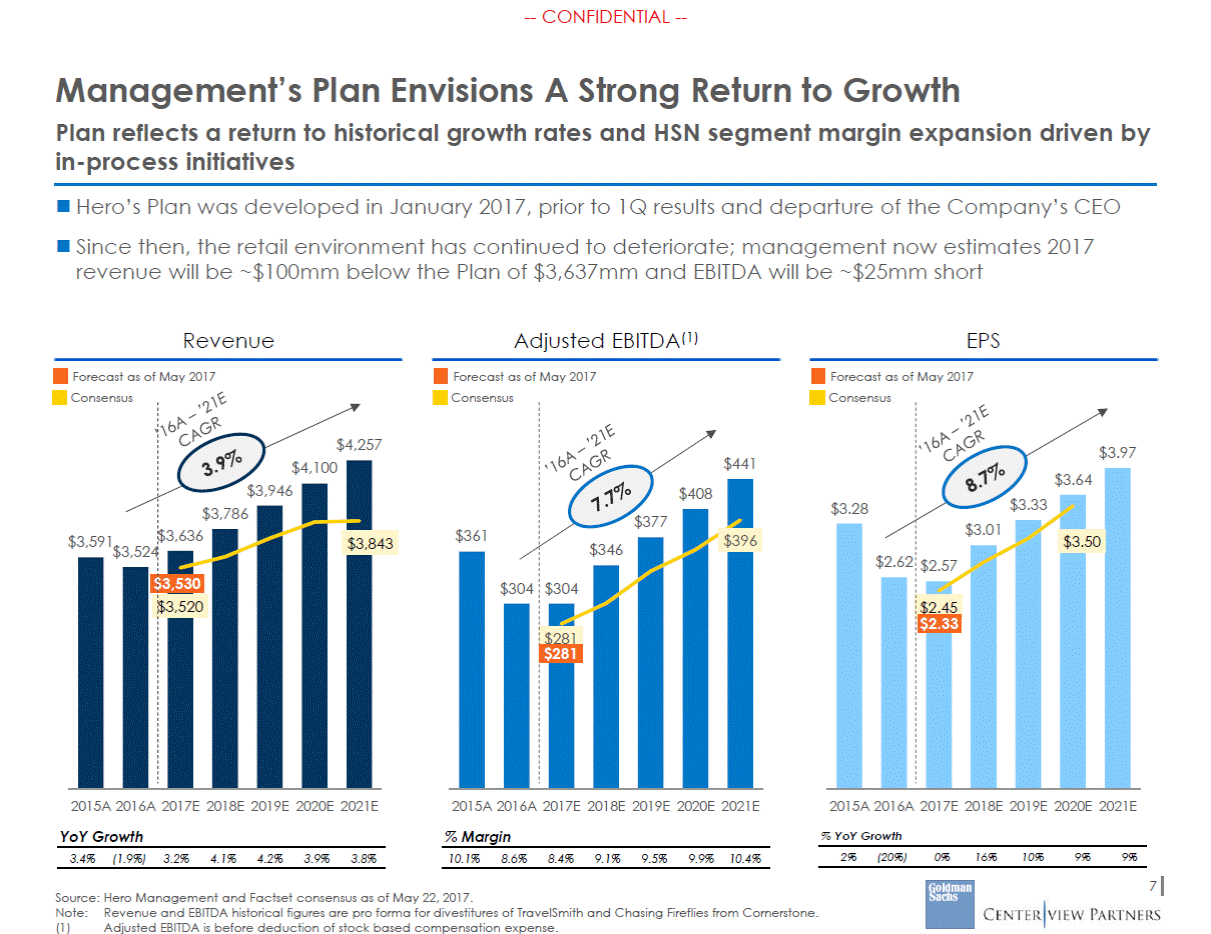
--CONFIDENTIAL --Management’s Plan Envisions A Strong Return to Growth Plan reflects a return to historical growth rates and HSN segment margin expansion driven by in-process initiatives Hero’s Plan was developed in January 2017, prior to 1Q results and departure of the Company’s CEO Since then, the retail environment has continued to deteriorate; management now estimates 2017 revenue will be ~$100mm below the Plan of $3,637mm and EBITDA will be ~$25mm short Revenue Forecast as of May 2017 Adjusted EBITDA(1) Forecast as of May 2017 EPS Forecast as of May 2017 Consensus Consensus Consensus $4,257 $3.97 $441 $3.28 $361 $346 $3,524 2015A 2016A 2017E 2018E 2019E 2020E 2021E 2015A 2016A 2017E 2018E 2019E 2020E 2021E 2015A 2016A 2017E 2018E 2019E 2020E 2021E YoY Growth % Margin % YoY Growth 2% (20%) 0% 16% 10% 9% 9% 3.4% (1.9%) 3.2% 4.1% 4.2% 3.9% 3.8% 10.1% 8.6% 8.4% 9.1% 9.5% 9.9% 10.4% 7 Source: Hero Management and Factset consensus as of May 22, 2017. Note:Revenue and EBITDA historical figures are pro forma for divestitures of TravelSmith and Chasing Fireflies from Cornerstone. (1) Adjusted EBITDA is before deduction of stock based compensation expense. $408 $377 $396 $304 $304 $281 $281 $3.64 $3.33 $3.01 $3.50 $2.62 $2.57 $2.45 $2.33 $4,100 $3,946 $3,786 $3,843 $3,591$3,636 $3,530 $3,520
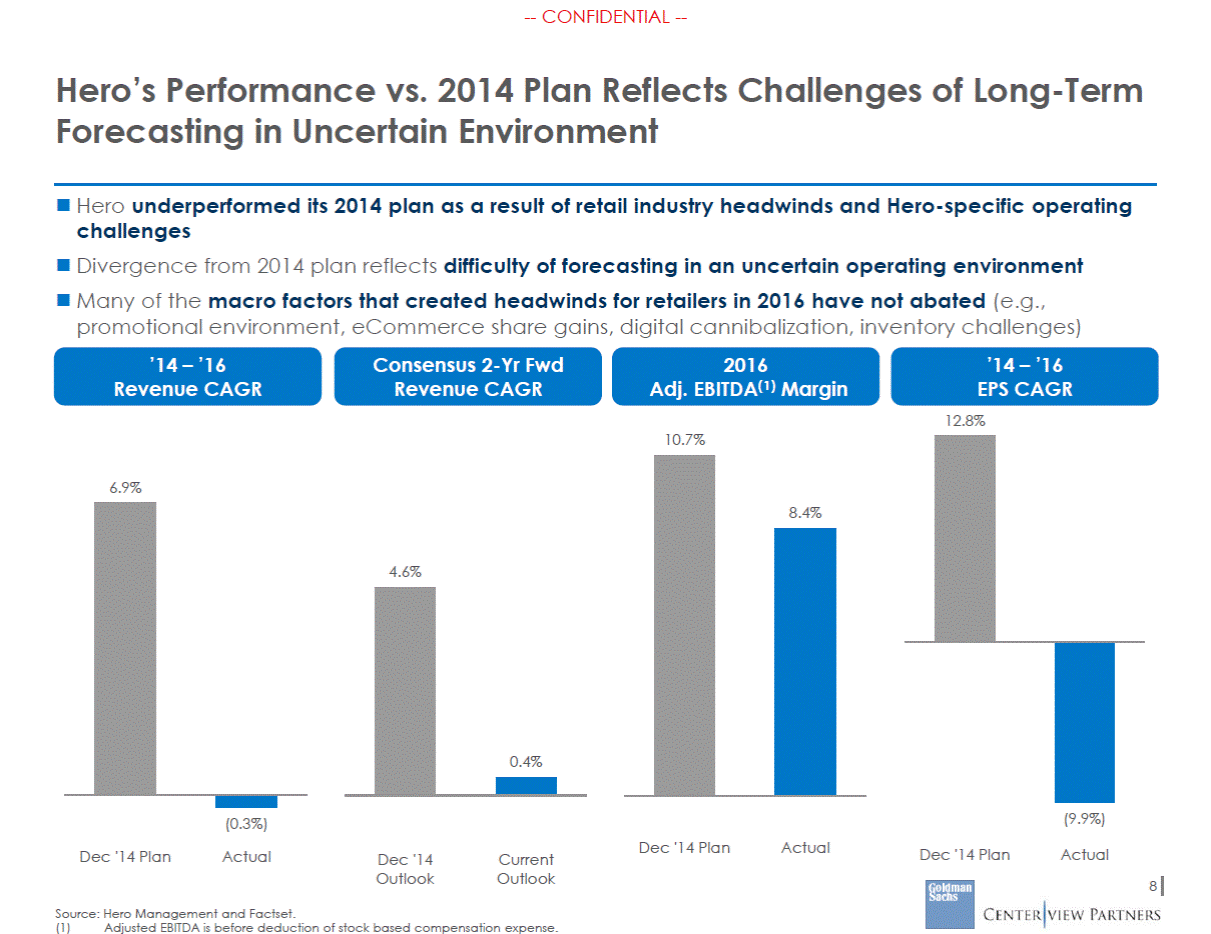
--CONFIDENTIAL --Hero’s Performance vs. 2014 Plan Reflects Challenges of Long-Term Forecasting in Uncertain Environment Hero underperformed its 2014 plan as a result of retail industry headwinds and Hero-specific operating challenges Divergence from 2014 plan reflects difficulty of forecasting in an uncertain operating environment Many of the macro factors that created headwinds for retailers in 2016 have not abated (e.g., promotional environment, eCommerce share gains, digital cannibalization, inventory challenges) ’14 – ’16 Revenue CAGR Consensus 2-Yr Fwd Revenue CAGR 2016 Adj. EBITDA(1) Margin ’14 – ’16 EPS CAGR 12.8% 10.7% 6.9% 4.6% (9.9%) (0.3%) Dec '14 Plan Actual Dec '14 Plan Actual Dec '14 Plan Actual Dec '14 Outlook Current Outlook 8 Source: Hero Management and Factset. (1) Adjusted EBITDA is before deduction of stock based compensation expense. 0.4% 8.4%
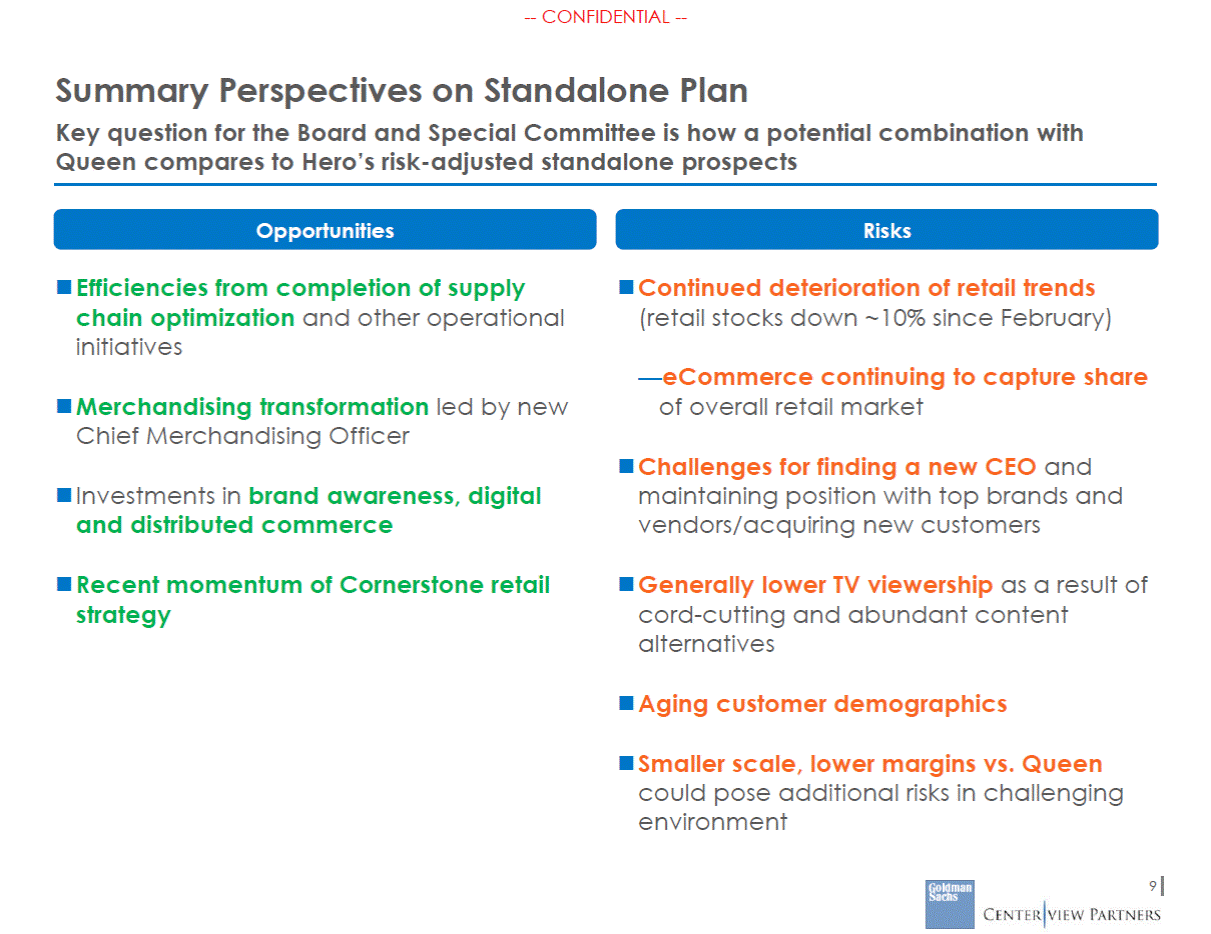
--CONFIDENTIAL --Summary Perspectives on Standalone Plan Key question for the Board and Special Committee is how a potential combination with Queen compares to Hero’s risk-adjusted standalone prospects Opportunities Risks Efficiencies from completion of supply chain optimization and other operational initiatives Continued deterioration of retail trends (retail stocks down ~10% since February) —eCommerce continuing to capture share of overall retail market Merchandising transformation led by new Chief Merchandising Officer Challenges for finding a new CEO and maintaining position with top brands and vendors/acquiring new customers Investments in brand awareness, digital and distributed commerce Recent momentum of Cornerstone retail strategy Generally lower TV viewership as a result of cord-cutting and abundant content alternatives Aging customer demographics Smaller scale, lower margins vs. Queen could pose additional risks in challenging environment 9
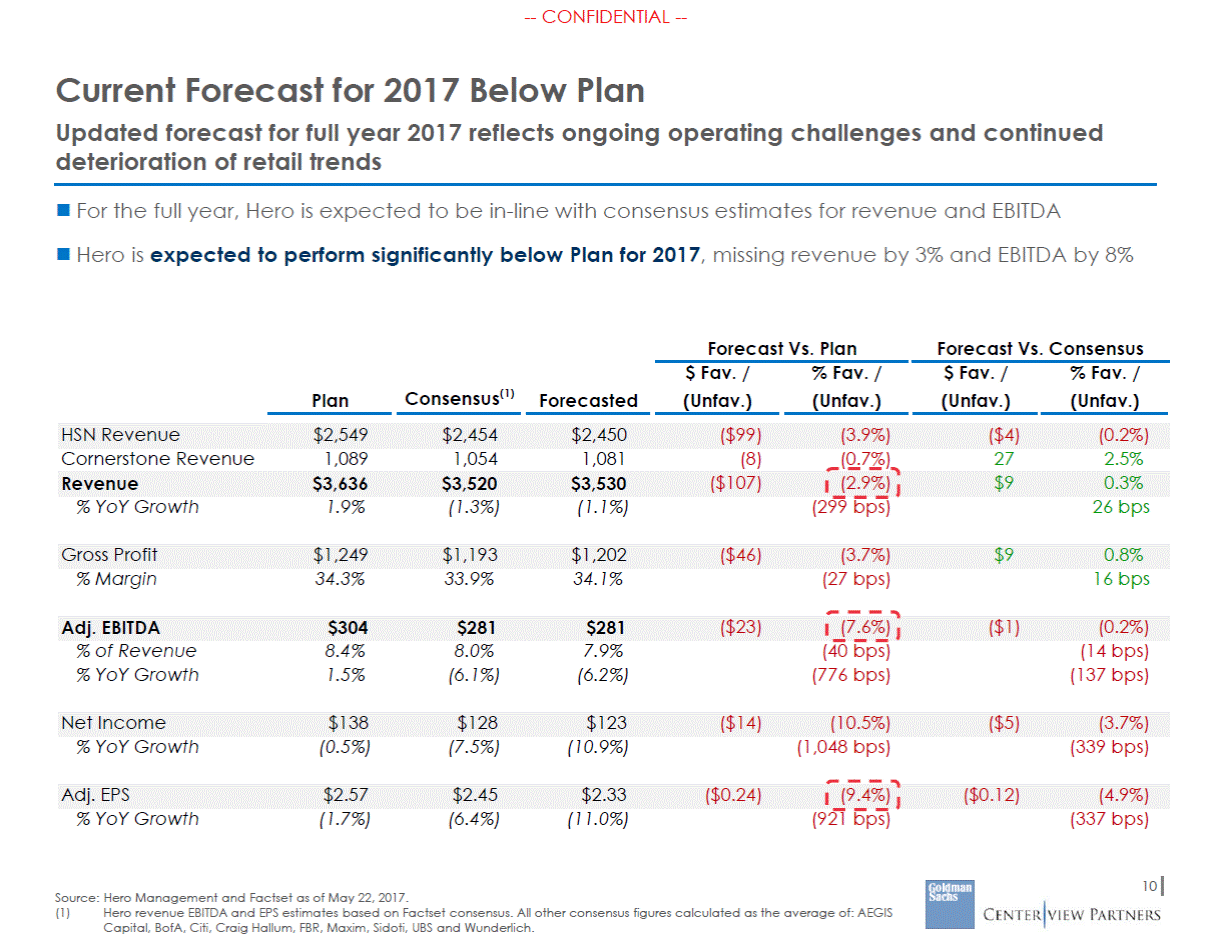
--CONFIDENTIAL --Current Forecast for 2017 Below Plan Updated forecast for full year 2017 reflects ongoing operating challenges and continued deterioration of retail trends For the full year, Hero is expected to be in-line with consensus estimates for revenue and EBITDA Hero is expected to perform significantly below Plan for 2017, missing revenue by 3% and EBITDA by 8% Forecast Vs. Plan Forecast Vs. Consensus $ Fav. / (Unfav.) % Fav. / (Unfav.) $ Fav. / (Unfav.) % Fav. / (Unfav.) Consensus(1) Plan Forecasted Cornerstone Revenue 1,089 1,054 1,081 (8) (0.7%) 27 2.5% % YoY Growth 1.9% (1.3%) (1.1%) (299 bps) 26 bps % Margin 34.3% 33.9% 34.1% (27 bps) 16 bps % of Revenue % YoY Growth 8.4% 1.5% 8.0% (6.1%) 7.9% (6.2%) (40 bps) (776 bps) (14 bps) (137 bps) % YoY Growth (0.5%) (7.5%) (10.9%) (1,048 bps) (339 bps) % YoY Growth (1.7%) (6.4%) (11.0%) (921 bps) (337 bps) 10 Source: Hero Management and Factset as of May 22, 2017. (1) Hero revenue EBITDA and EPS estimates based on Factset consensus. All other consensus figures calculated as the average of: AEGIS Capital, BofA, Citi, Craig Hallum, FBR, Maxim, Sidoti, UBS and Wunderlich. Adj. EPS$2.57$2.45$2.33($0.24)(9.4%)($0.12)(4.9%) Net Income$138$128$123($14)(10.5%)($5)(3.7%) Adj. EBITDA$304$281$281($23)(7.6%)($1)(0.2%) Gross Profit$1,249$1,193$1,202($46)(3.7%)$90.8% Revenue$3,636$3,520$3,530($107)(2.9%)$90.3% HSN Revenue$2,549$2,454$2,450($99)(3.9%)($4)(0.2%)
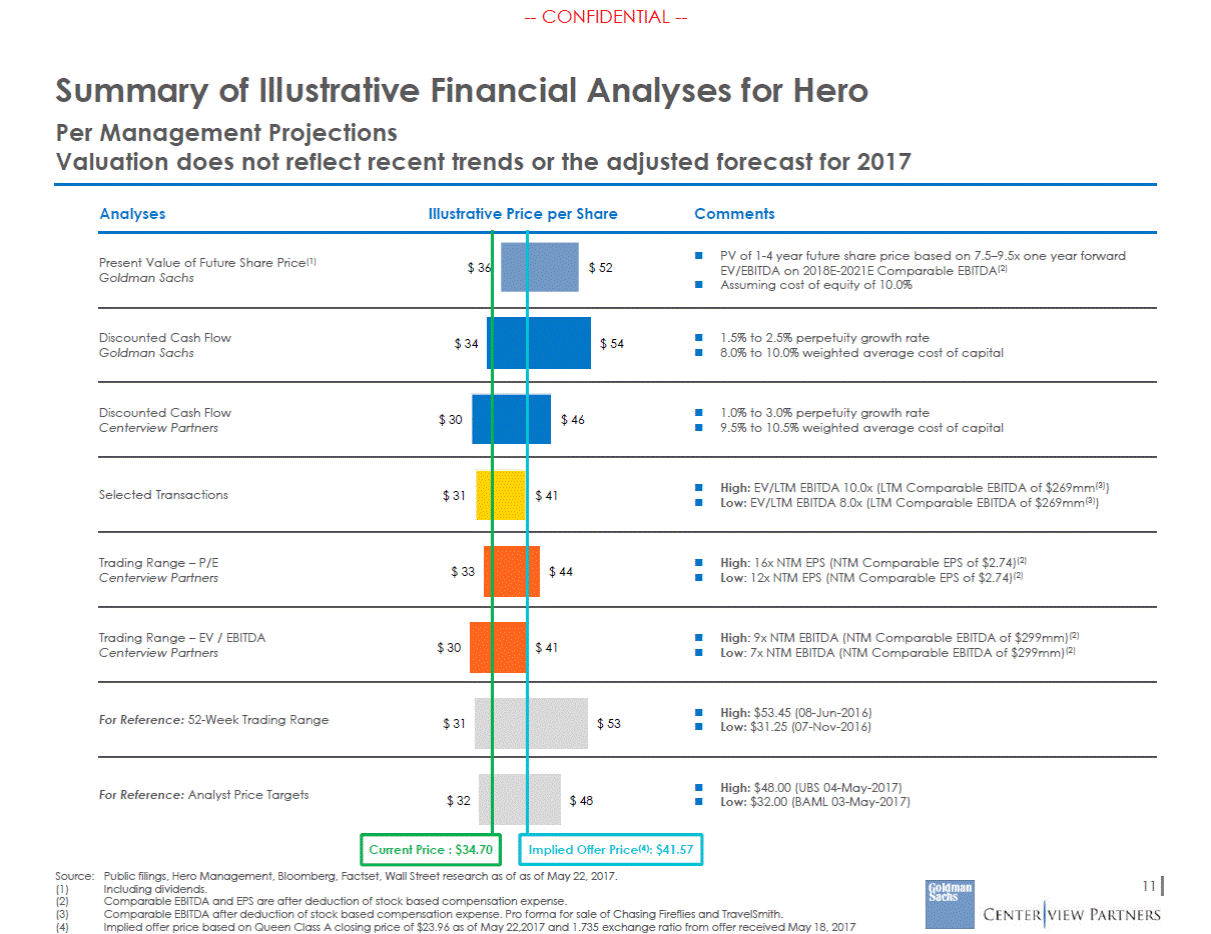
--CONFIDENTIAL --Summary of Illustrative Financial Analyses for Hero Per Management Projections Valuation does not reflect recent trends or the adjusted forecast for 2017 Analyses Illustrative Price per Share Comments $ 52 EV/EBITDA on 2018E-2021E Comparable EBITDA(2) 8.0% to 10.0% weighted average cost of capital 9.5% to 10.5% weighted average cost of capital Low: EV/LTM EBITDA 8.0x (LTM Comparable EBITDA of $269mm(3)) $ 44 Low: 12x NTM EPS (NTM Comparable EPS of $2.74)(2) $ 30 Centerview Partners $ 53 Low: $31.25 (07-Nov-2016) $ 48 Low: $32.00 (BAML 03-May-2017) Implied Offer Price(4): $41.57 Current Price : $34.70 Source: (1) (2) (3) (4) Public filings, Hero Management, Bloomberg, Factset, Wall Street research as of as of May 22, 2017. Including dividends. Comparable EBITDA and EPS are after deduction of stock based compensation expense. Comparable EBITDA after deduction of stock based compensation expense. Pro forma for sale of Chasing Fireflies and TravelSmith. Implied offer price based on Queen Class A closing price of $23.96 as of May 22,2017 and 1.735 exchange ratio from offer received May 18, 2017 11 Present Value of Future Share Price(1) $ 36 Goldman Sachs PV of 1-4 year future share price based on 7.5–9.5x one year forward Assuming cost of equity of 10.0% Discounted Cash Flow$ 34 Goldman Sachs $ 54 1.5% to 2.5% perpetuity growth rate Discounted Cash Flow$ 30 Centerview Partners $ 46 1.0% to 3.0% perpetuity growth rate (3) $ 41 High: EV/LTM EBITDA 10.0x (LTM Comparable EBITDA of $269mm ) Selected Transactions$ 31 Trading Range – P/E Centerview Partners$ 33 High: 16x NTM EPS (NTM Comparable EPS of $2.74)(2) High: 9x NTM EBITDA (NTM Comparable EBITDA of $299mm)(2) $ 41 Low: 7x NTM EBITDA (NTM Comparable EBITDA of $299mm)(2) Trading Range – EV / EBITDA For Reference: 52-Week Trading Range$ 31 High: $53.45 (08-Jun-2016) For Reference: Analyst Price Targets$ 32 High: $48.00 (UBS 04-May-2017)
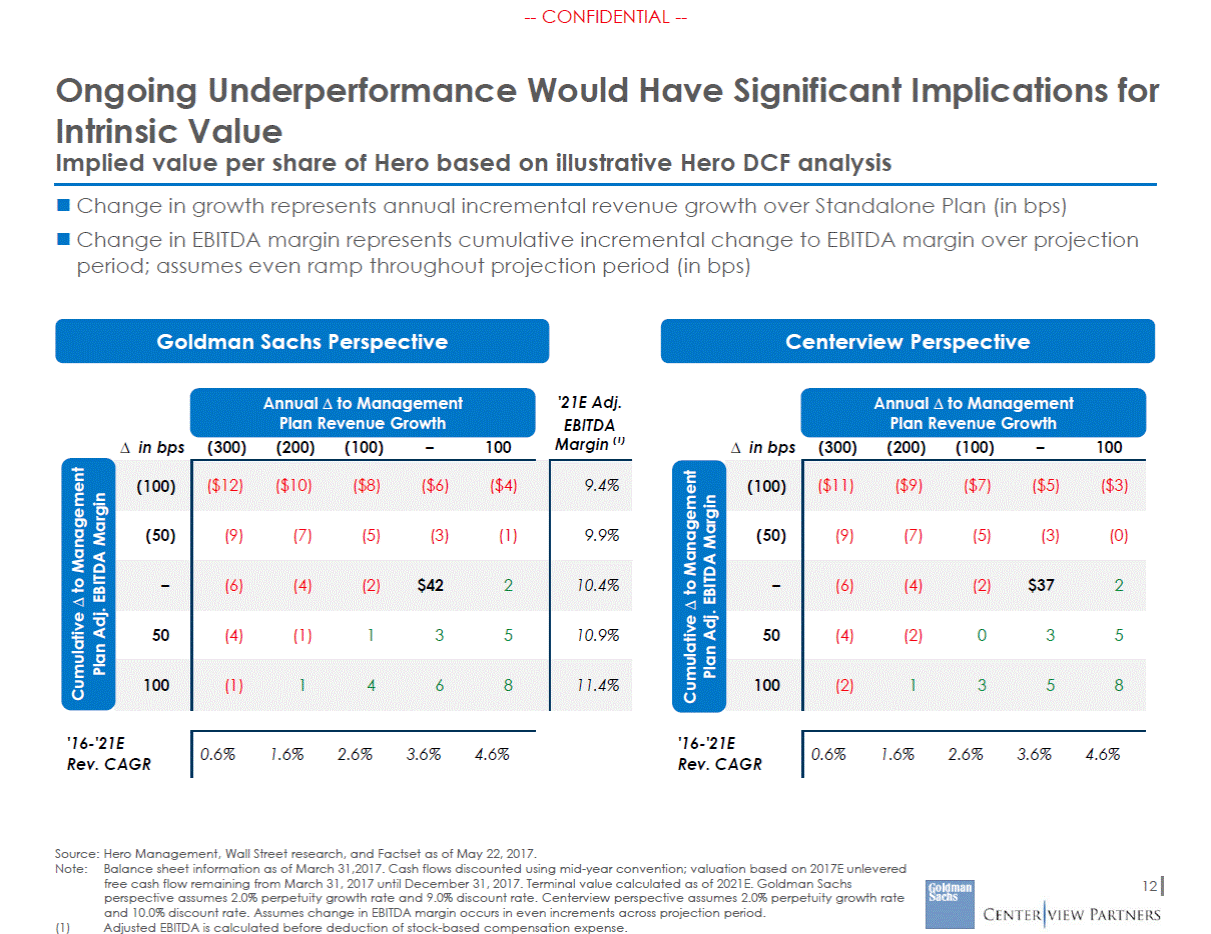
--CONFIDENTIAL --Ongoing Underperformance Would Have Significant Implications for Intrinsic Value Implied value per share of Hero based on illustrative Hero DCF analysis Change in growth represents annual incremental revenue growth over Standalone Plan (in bps) Change in EBITDA margin represents cumulative incremental change to EBITDA margin over projection period; assumes even ramp throughout projection period (in bps) Goldman Sachs Perspective Centerview Perspective '21E Adj. EBITDA Margin (1) Annual to Management Plan Revenue Growth Annual to Management Plan Revenue Growth in bps (300) (200) (100) – 100 in bps (300) (200) (100) – 100 '16-'21E Rev. CAGR '16-'21E Rev. CAGR Source: Hero Management, Wall Street research, and Factset as of May 22, 2017. Note:Balance sheet information as of March 31,2017. Cash flows discounted using mid-year convention; valuation based on 2017E unlevered free cash flow remaining from March 31, 2017 until December 31, 2017. Terminal value calculated as of 2021E. Goldman Sachs perspective assumes 2.0% perpetuity growth rate and 9.0% discount rate. Centerview perspective assumes 2.0% perpetuity growth rate and 10.0% discount rate. Assumes change in EBITDA margin occurs in even increments across projection period. 12 (1) Adjusted EBITDA is calculated before deduction of stock-based compensation expense. Cumulative to Management Plan Adj. EBITDA Margin Cumulative to Management Plan Adj. EBITDA Margin 0.6%1.6%2.6%3.6%4.6% 0.6%1.6%2.6%3.6%4.6% (100) ($12)($10)($8)($6)($4) 9.4% (50) (9)(7)(5)(3)(1) 9.9% – (6)(4)(2)$422 10.4% 50 (4)(1)135 10.9% 100 (1)1468 11.4% (100) ($11)($9)($7)($5)($3) (50) (9)(7)(5)(3)(0) – (6)(4)(2)$372 50 (4)(2)035 100 (2)1358
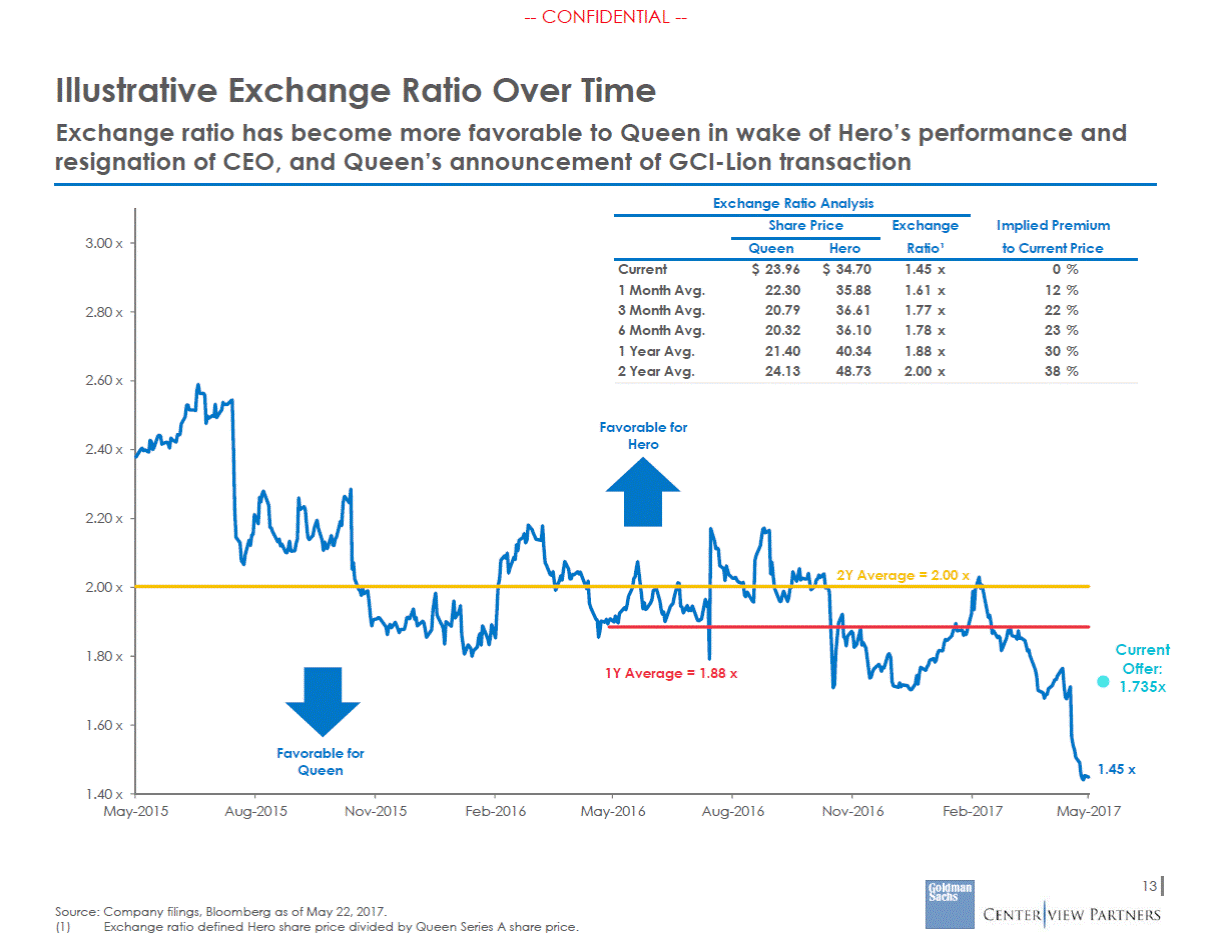
--CONFIDENTIAL --Illustrative Exchange Ratio Over Time Exchange ratio has become more favorable to Queen in wake of Hero’s performance and resignation of CEO, and Queen’s announcement of GCI-Lion transaction Exchange Ratio Analysis ium ce 3.00 x 2.80 x 2.60 x 2.40 x 2.20 x 2.00 x Current Offer: 1.735x 1.80 x 1.60 x 1.45 x 1.40 x May-2015 Aug-2015 Nov-2015 Feb-2016 May-2016 Aug-2016 Nov-2016 Feb-2017 May-2017 13 Source: Company filings, Bloomberg as of May 22, 2017. (1) Exchange ratio defined Hero share price divided by Queen Series A share price. Share PriceExchangeImplied Prem QueenHeroRatio¹to Current Pri Current$ 23.96$ 34.701.45 x0 % 1 Month Avg.22.3035.881.61 x12 % 3 Month Avg.20.7936.611.77 x22 % 6 Month Avg.20.3236.101.78 x23 % 1 Year Avg.21.4040.341.88 x30 % 2 Year Avg.24.1348.732.00 x38 % Favorable for Hero 2Y Average = 2.00 x 1Y Average = 1.88 x Favorable for Queen
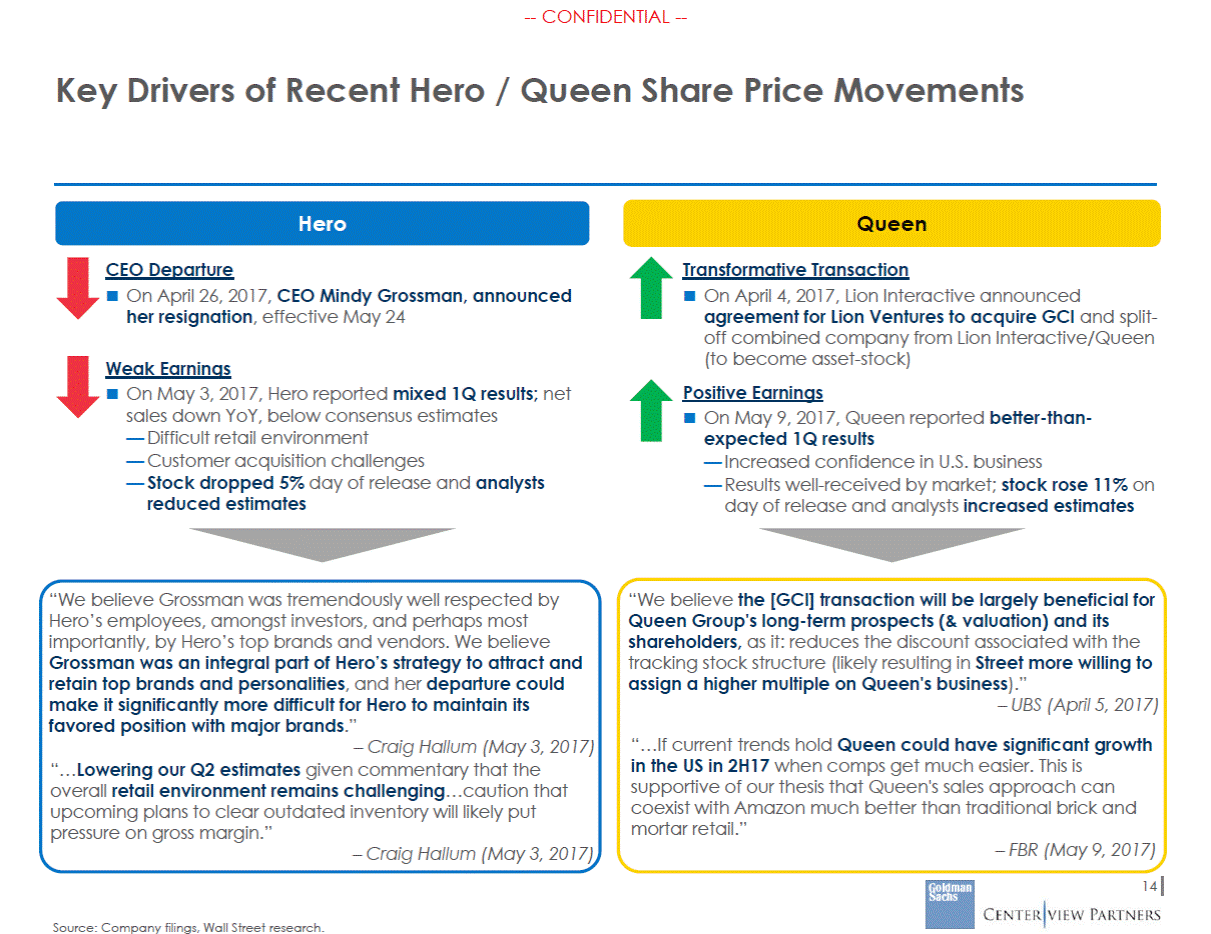
--CONFIDENTIAL --Key Drivers of Recent Hero / Queen Share Price Movements Hero Queen CEO Departure Transformative Transaction On April 26, 2017, CEO Mindy Grossman, announced her resignation, effective May 24 On April 4, 2017, Lion Interactive announced agreement for Lion Ventures to acquire GCI and split-off combined company from Lion Interactive/Queen (to become asset-stock) Positive Earnings Weak Earnings On May 3, 2017, Hero reported mixed 1Q results; net sales down YoY, below consensus estimates — Difficult retail environment — Customer acquisition challenges — Stock dropped 5% day of release and analysts reduced estimates On May 9, 2017, Queen reported better-than-expected 1Q results — Increased confidence in U.S. business — Results well-received by market; stock rose 11% on day of release and analysts increased estimates “We believe Grossman was tremendously well respected by Hero’s employees, amongst investors, and perhaps most importantly, by Hero’s top brands and vendors. We believe Grossman was an integral part of Hero’s strategy to attract and retain top brands and personalities, and her departure could make it significantly more difficult for Hero to maintain its favored position with major brands.” – Craig Hallum (May 3, 2017) “…Lowering our Q2 estimates given commentary that the overall retail environment remains challenging…caution that upcoming plans to clear outdated inventory will likely put pressure on gross margin.” – Craig Hallum (May 3, 2017) “We believe the [GCI] transaction will be largely beneficial for Queen Group's long-term prospects (& valuation) and its shareholders, as it: reduces the discount associated with the tracking stock structure (likely resulting in Street more willing to assign a higher multiple on Queen's business).” – UBS (April 5, 2017) “…If current trends hold Queen could have significant growth in the US in 2H17 when comps get much easier. This is supportive of our thesis that Queen's sales approach can coexist with Amazon much better than traditional brick and mortar retail.” – FBR (May 9, 2017) 14 Source: Company filings, Wall Street research.
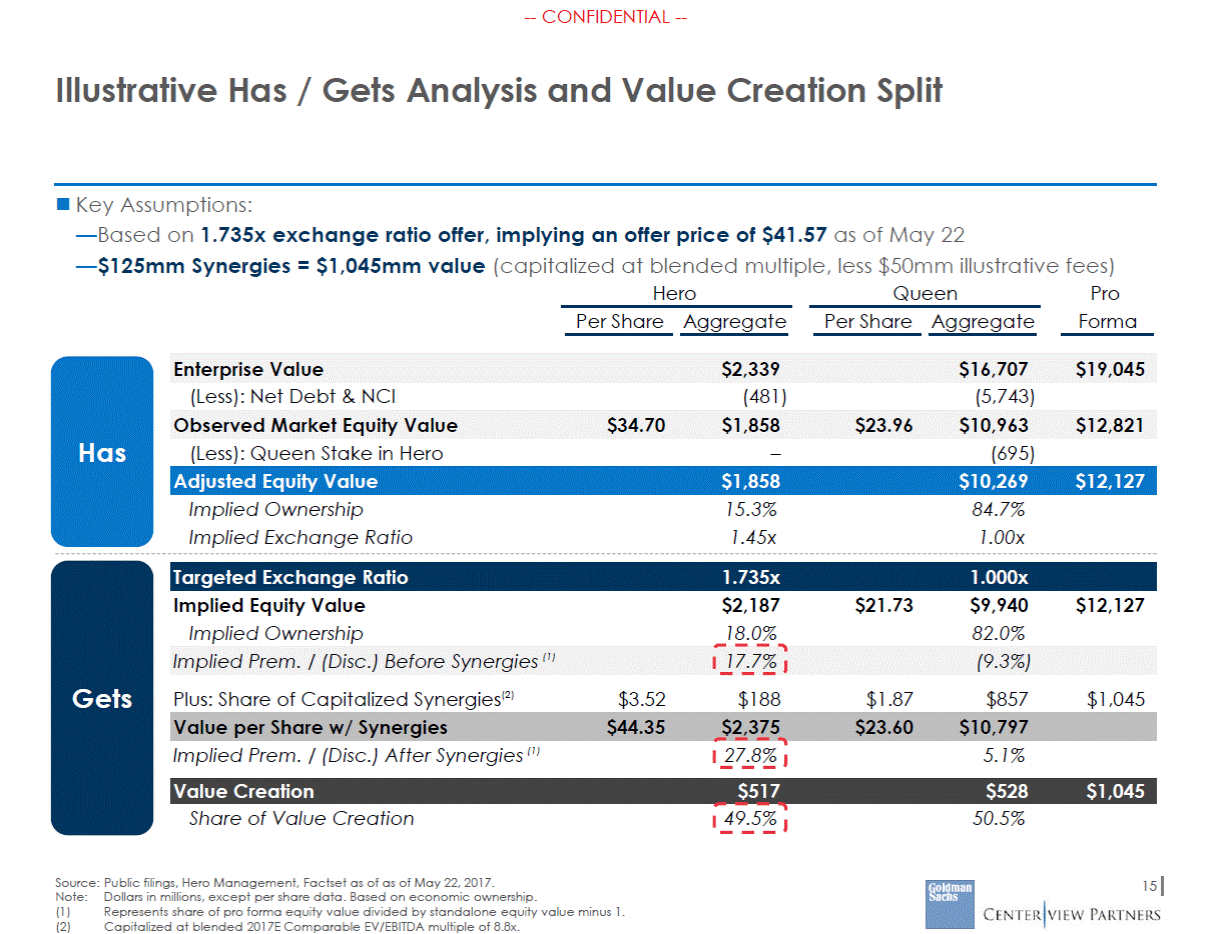
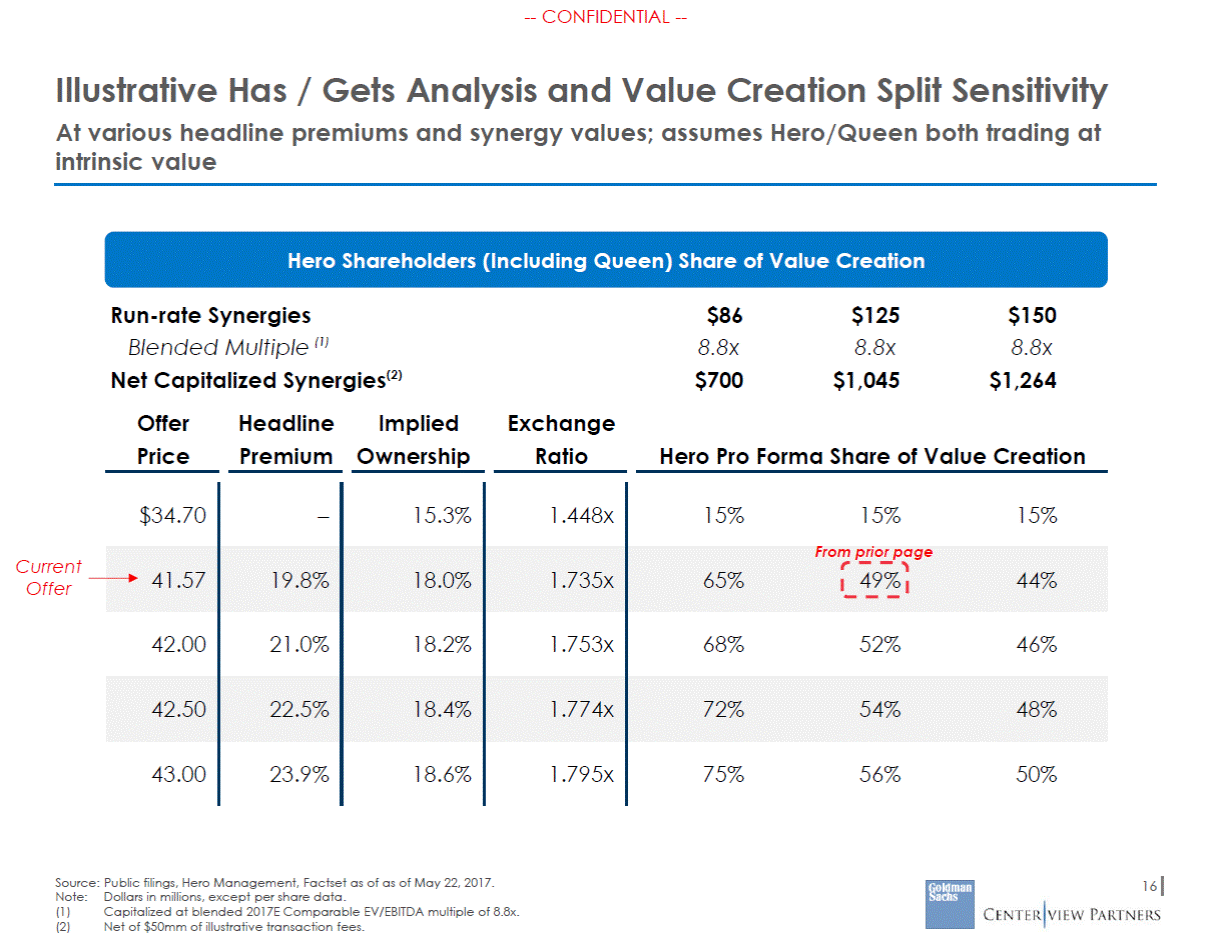
--CONFIDENTIAL --Illustrative Has / Gets Analysis and Value Creation Split Key Assumptions: —Based on 1.735x exchange ratio offer, implying an offer price of $41.57 as of May 22 —$125mm Synergies = $1,045mm value (capitalized at blended multiple, less $50mm illustrative fees) Hero Queen Pro Forma Per Share Aggregate Per Share Aggregate (Less): Net Debt & NCI (481) (5,743) Has (Less): Queen Stake in Hero – (695) Implied Ownership Implied Exchange Ratio 15.3% 1.45x 84.7% 1.00x Implied Equity Value Implied Ownership $2,187 18.0% $21.73 $9,940 82.0% $12,127 Gets Plus: Share of Capitalized Synergies(2) $3.52 $188 $1.87 $857 $1,045 Implied Prem. / (Disc.) After Synergies (1) 27.8% 5.1% Share of Value Creation 49.5% 50.5% Source: Public filings, Hero Management, Factset as of as of May 22, 2017. 15 Note: (1) (2) Dollars in millions, except per share data. Based on economic ownership. Represents share of pro forma equity value divided by standalone equity value minus 1. Capitalized at blended 2017E Comparable EV/EBITDA multiple of 8.8x. Value Creation $517 $528 $1,045 Value per Share w/ Synergies $44.35 $2,375 $23.60 $10,797 Implied Prem. / (Disc.) Before Synergies (1) 17.7% (9.3%) Targeted Exchange Ratio 1.735x 1.000x Adjusted Equity Value $1,858 $10,269 $12,127 Observed Market Equity Value $34.70 $1,858 $23.96 $10,963 $12,821 Enterprise Value $2,339 $16,707 $19,045
--CONFIDENTIAL --Illustrative Has / Gets Analysis and Value Creation Split Sensitivity At various headline premiums and synergy values; assumes Hero/Queen both trading at intrinsic value Hero Shareholders (Including Queen) Share of Value Creation Run-rate Synergies Blended Multiple (1) Net Capitalized Synergies(2) $86 8.8x $700 $125 8.8x $1,045 $150 8.8x $1,264 Offer Price Headline Premium Implied Ownership Exchange Ratio Hero Pro Forma Share of Value Creation Current Offer Source: Public filings, Hero Management, Factset as of as of May 22, 2017. 16 Note: (1) (2) Dollars in millions, except per share data. Capitalized at blended 2017E Comparable EV/EBITDA multiple of 8.8x. Net of $50mm of illustrative transaction fees. $34.70 – 15.3% 1.448x 15%15%15% 41.57 19.8% 18.0% 1.735x From prior page 65%49%44% 42.00 21.0% 18.2% 1.753x 68%52%46% 42.50 22.5% 18.4% 1.774x 72%54%48% 43.00 23.9% 18.6% 1.795x 75%56%50%
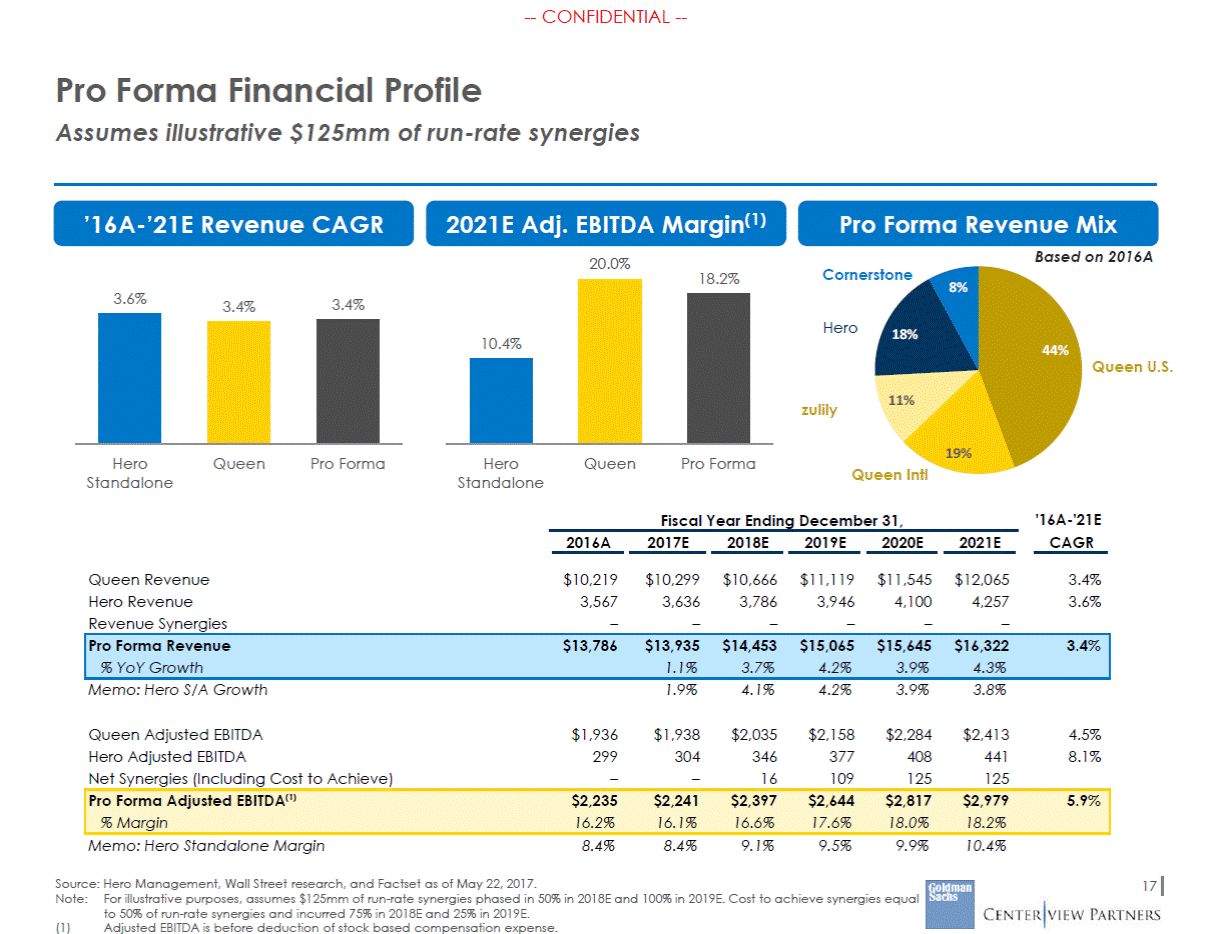
--CONFIDENTIAL --Pro Forma Financial Profile Assumes illustrative $125mm of run-rate synergies ’16A-’21E Revenue CAGR 2021E Adj. EBITDA Margin(1) 20.0% Pro Forma Revenue Mix Based on 2016A Cornerstone 18.2% 8% 3.6% 3.4% 3.4% Hero 18% 44% Queen U.S. 11% zulily 19% Hero Standalone Queen Pro Forma Hero Standalone Queen Pro Forma Queen Intl Fiscal Year Ending December 31, '16A-'21E CAGR 2016A 2017E 2018E 2019E 2020E 2021E Queen Revenue Hero Revenue Revenue Synergies $10,219 3,567 – $10,299 3,636 – $10,666 3,786 – $11,119 3,946 – $11,545 4,100 – $12,065 4,257 – 3.4% 3.6% Memo: Hero S/A Growth 1.9% 4.1% 4.2% 3.9% 3.8% Queen Adjusted EBITDA Hero Adjusted EBITDA Net Synergies (Including Cost to Achieve) $1,936 299 – $1,938 304 – $2,035 346 16 $2,158 377 109 $2,284 408 125 $2,413 441 125 4.5% 8.1% Memo: Hero Standalone Margin 8.4% 8.4% 9.1% 9.5% 9.9% 10.4% Source: Hero Management, Wall Street research, and Factset as of May 22, 2017. Note:For illustrative purposes, assumes $125mm of run-rate synergies phased in 50% in 2018E and 100% in 2019E. Cost to achieve synergies equal to 50% of run-rate synergies and incurred 75% in 2018E and 25% in 2019E. 17 (1) Adjusted EBITDA is before deduction of stock based compensation expense. Pro Forma Adjusted EBITDA(1) $2,235$2,241$2,397$2,644$2,817$2,9795.9% % Margin16.2%16.1%16.6%17.6%18.0%18.2% Pro Forma Revenue$13,786$13,935$14,453$15,065$15,645$16,3223.4% % YoY Growth1.1%3.7%4.2%3.9%4.3% 10.4%
--CONFIDENTIAL --Lion’s Proposal Is Contingent On 2Q Performance Queen offer contingent on Hero meeting consensus revenue and EBITDA estimates for 2Q; Hero currently expecting to be below consensus EBITDA by ~7% $ Favorable / (Unfavorable) % Favorable / (Unfavorable) Consensus(1) Forecasted Cornerstone Revenue 285.4 289.9 4.5 1.6% % YoY Growth (2.6%) (2.5%) 12 bps % Margin 35.9% 35.4% (47 bps) % of Revenue % YoY Growth 8.4% (15.4%) 7.8% (21.2%) (58 bps) (579 bps) % YoY Growth (20.6%) (21.3%) (71 bps) % YoY Growth (21.6%) (21.4%) 24 bps 18 Source: Hero Management. (1) Hero revenue and EPS consensus estimate consistent with 1st Call as of May 15, 2017. All other consensus figures calculated as the average of: AEGIS Capital, BofA, Citi, Craig Hallum, FBR, Maxim, Sidoti, UBS and Wunderlich. Adj. EPS $0.58 $0.58 – 0.3% Net Income $31.2 $30.9 ($0.3) (1.0%) Adj. EBITDA $69.7 $64.9 ($4.8) (6.9%) Gross Profit $298.3 $294.7 ($3.6) (1.2%) Revenue $831.8 $832.9 1.0 0.1% HSN Revenue $546.4 $543.3 ($3.0) (0.5%)
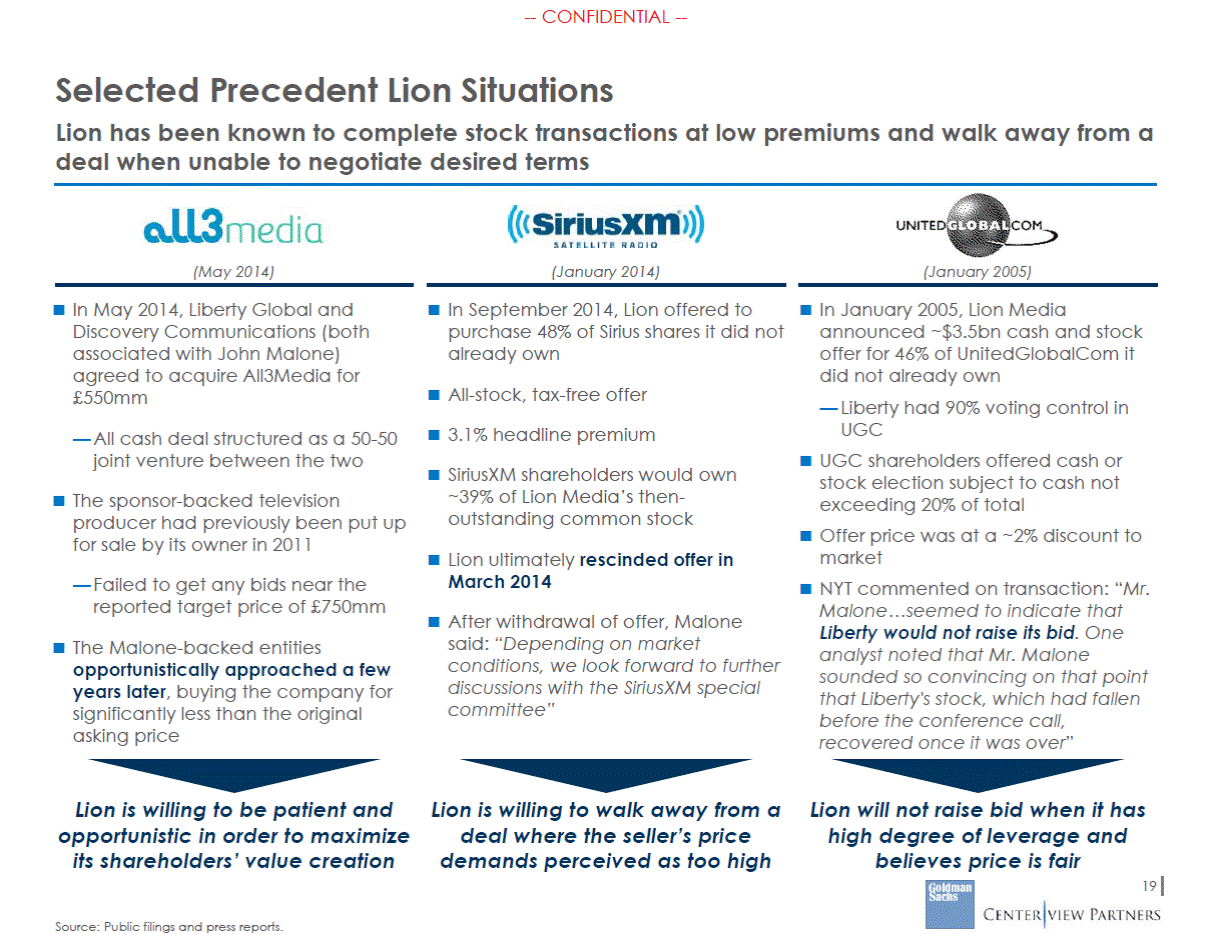
--CONFIDENTIAL --Selected Precedent Lion Situations Lion has been known to complete stock transactions at low premiums and walk away from a deal when unable to negotiate desired terms (May 2014) (January 2014) (January 2005) In May 2014, Liberty Global and Discovery Communications (both associated with John Malone) agreed to acquire All3Media for £550mm In September 2014, Lion offered to purchase 48% of Sirius shares it did not already own In January 2005, Lion Media announced ~$3.5bn cash and stock offer for 46% of UnitedGlobalCom it did not already own — Liberty had 90% voting control in UGC UGC shareholders offered cash or stock election subject to cash not exceeding 20% of total Offer price was at a ~2% discount to market NYT commented on transaction: “Mr. Malone…seemed to indicate that Liberty would not raise its bid. One analyst noted that Mr. Malone sounded so convincing on that point that Liberty's stock, which had fallen before the conference call, recovered once it was over” All-stock, tax-free offer 3.1% headline premium — All cash deal structured as a 50-50 joint venture between the two SiriusXM shareholders would own ~39% of Lion Media’s then-outstanding common stock The sponsor-backed television producer had previously been put up for sale by its owner in 2011 Lion ultimately rescinded offer in March 2014 — Failed to get any bids near the reported target price of £750mm After withdrawal of offer, Malone said: “Depending on market conditions, we look forward to further discussions with the SiriusXM special committee” The Malone-backed entities opportunistically approached a few years later, buying the company for significantly less than the original asking price Lion is willing to be patient and opportunistic in order to maximize its shareholders’ value creation Lion is willing to walk away from a deal where the seller’s price demands perceived as too high Lion will not raise bid when it has high degree of leverage and believes price is fair 19 Source: Public filings and press reports.
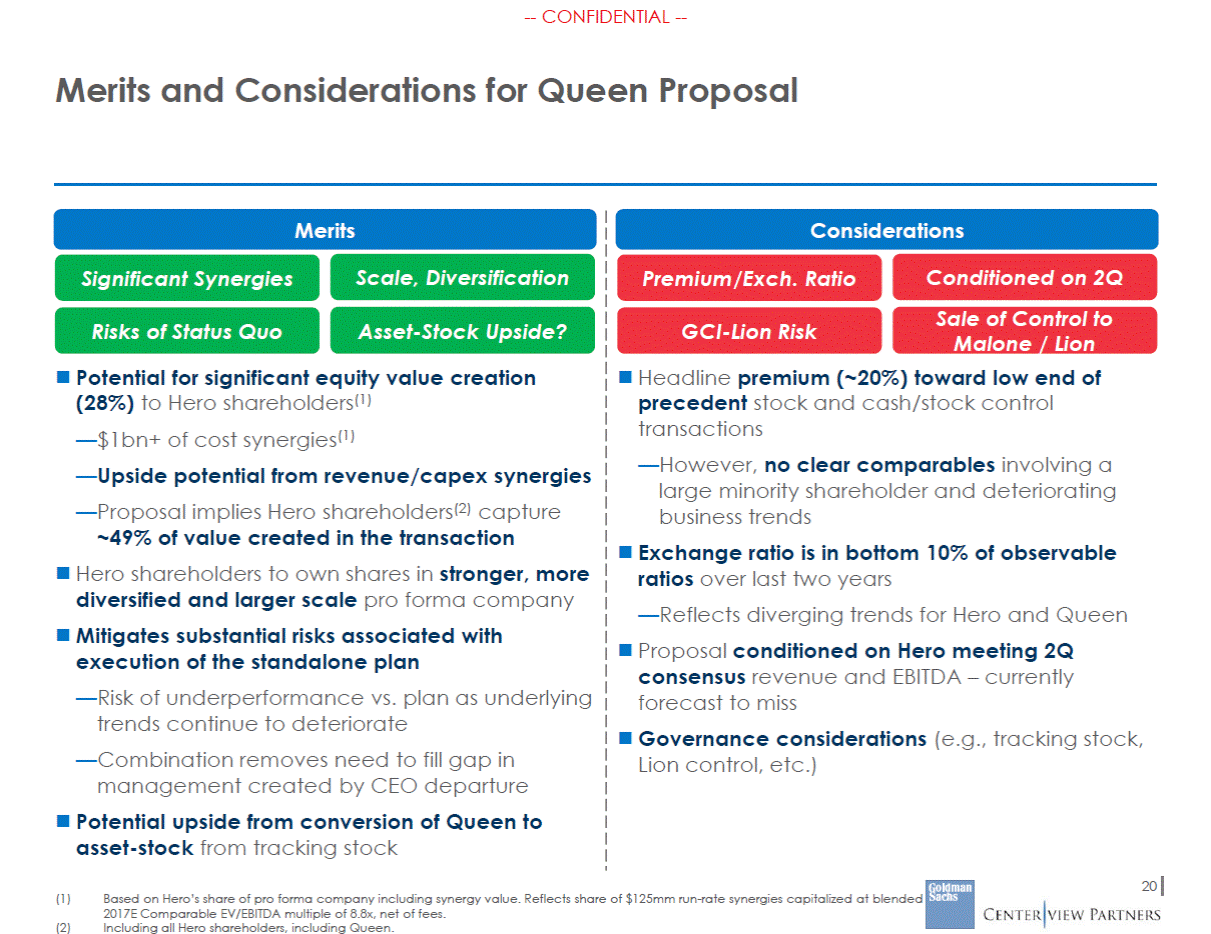
--CONFIDENTIAL --Merits and Considerations for Queen Proposal Merits Considerations Scale, Diversification Conditioned on 2Q Sale of Control to Malone / Lion Significant Synergies Premium/Exch. Ratio Risks of Status Quo Asset-Stock Upside? GCI-Lion Risk Potential for significant equity value creation (28%) to Hero shareholders(1) —$1bn+ of cost synergies(1) —Upside potential from revenue/capex synergies —Proposal implies Hero shareholders(2) capture ~49% of value created in the transaction Hero shareholders to own shares in stronger, more diversified and larger scale pro forma company Mitigates substantial risks associated with execution of the standalone plan —Risk of underperformance vs. plan as underlying trends continue to deteriorate —Combination removes need to fill gap in management created by CEO departure Potential upside from conversion of Queen to asset-stock from tracking stock Headline premium (~20%) toward low end of precedent stock and cash/stock control transactions —However, no clear comparables involving a large minority shareholder and deteriorating business trends Exchange ratio is in bottom 10% of observable ratios over last two years —Reflects diverging trends for Hero and Queen Proposal conditioned on Hero meeting 2Q consensus revenue and EBITDA – currently forecast to miss Governance considerations (e.g., tracking stock, Lion control, etc.) 20 (1) Based on Hero’s share of pro forma company including synergy value. Reflects share of $125mm run-rate synergies capitalized at blended 2017E Comparable EV/EBITDA multiple of 8.8x, net of fees. Including all Hero shareholders, including Queen. (2)
--CONFIDENTIAL --Other Key Transaction Considerations Goal would be to maximize speed and certainty with focused, two-way diligence process Diligence and contract negotiation may take 3-4 weeks, subject to Queen focus Hero and its advisors are prepared to conduct (limited) diligence on Queen Diligence to include data rooms for both entities, in-person management meetings, functional area diligence calls, etc. Process could target transaction announcement in late-June Due Diligence and Timetable Speed is critical to minimize the risks of leaks that could potentially distract the organization and damage customer / supplier relationships Elimination of contingency on 2Q results – diligence / engagement will disrupt CEO search process and monopolize management bandwidth Merger agreement could provide that certain representations (e.g., absence of a material adverse effect) are made only at signing and not at closing – this is an atypical approach Seek a tight covenant governing Queen’s obligations to obtain regulatory approval (e.g., “hell-or-high-water”) Seek flexibility to provide appropriate employee retention arrangements Protection of Hero Business Some options for consideration —“Majority of the minority” approval as a closing condition —Collar structures (unusual in fixed exchange ratio deals) —Contract protections related to GCI transaction —CVR / contingent payment related to GCI transaction Deal Mechanics / Enhancements to Consider 21
