--CONFIDENTIAL --Disclaimer (Centerview Partners) This presentation has been prepared by Centerview Partners LLC (“Centerview”) for use solely by the Special Committee of the Board of Directors of HSN, Inc. (“Hero” or the “Company”) in connection with its evaluation of a proposed transaction involving the Company and for no other purpose. The information contained herein is based upon information supplied by Hero and publicly available information, and portions of the information contained herein may be based upon statements, estimates and forecasts provided by the Company. Centerview has relied upon the accuracy and completeness of the foregoing information, and have not assumed any responsibility for any independent verification of such information or for any independent evaluation or appraisal of any of the assets or liabilities (contingent or otherwise) of the Company or any other entity, or concerning the solvency or fair value of the Company or any other entity. With respect to financial forecasts, including with respect to estimates of potential synergies, Centerview has assumed that such forecasts have been reasonably prepared on bases reflecting the best currently available estimates and judgments of the management of the Company as to its financial performances, and at your direction Centerview has relied upon such forecasts, as provided by the Company’s management, with respect to the Company, including as to expected synergies. Centerview assumes no responsibility for and expresses no view as to such forecasts or the assumptions on which they are based. The information set forth herein is based upon economic, monetary, market and other conditions as in effect on, and the information made available to us as of, the date hereof, unless indicated otherwise and Centerview assumes no obligation to update or otherwise revise these materials. The financial analysis in this presentation is complex and is not necessarily susceptible to a partial analysis or summary description. In performing this financial analysis, Centerview has considered the results of its analysis as a whole and did not necessarily attribute a particular weight to any particular portion of the analysis considered. Furthermore, selecting any portion of Centerview’s analysis, without considering the analysis as a whole, would create an incomplete view of the process underlying its financial analysis. Centerview may have deemed various assumptions more or less probable than other assumptions, so the reference ranges resulting from any particular portion of the analysis described above should not be taken to be Centerview’s view of the actual value of the Company. These materials and the information contained herein are confidential, were not prepared with a view toward public disclosure, and may not be disclosed publicly or made available to third parties without the prior written consent of Centerview. These materials and any other advice, written or oral, rendered by Centerview are intended solely for the benefit and use of the Special Committee of the Board of Directors of the Company (in its capacity as such) in its consideration of the proposed transaction, and are not for the benefit of, and do not convey any rights or remedies for any holder of securities of the Company or any other person. Centerview will not be responsible for and has not provided any tax, accounting, actuarial, legal or other specialist advice. These materials are not intended to provide the sole basis for evaluating the proposed transaction, and this presentation does not represent a fairness opinion, recommendation, valuation or opinion of any kind, and is necessarily incomplete and should be viewed solely in conjunction with the oral presentation provided by Centerview. 1
--CONFIDENTIAL --Disclaimer (Goldman Sachs) These materials have been prepared and are provided by Goldman Sachs on a confidential basis solely for the information and assistance of the Special Committee of the Board of Directors (the "Special Committee") of Hero (the "Company") in connection with its consideration of the matters referred to herein. These materials and Goldman Sachs’ presentation relating to these materials (the “Confidential Information”) may not be disclosed to any third party or circulated or referred to publicly or used for or relied upon for any other purpose without the prior written consent of Goldman Sachs. The Confidential Information was not prepared with a view to public disclosure or to conform to any disclosure standards under any state, federal or international securities laws or other laws, rules or regulations, and Goldman Sachs does not take any responsibility for the use of the Confidential Information by persons other than those set forth above. Notwithstanding anything in this Confidential Information to the contrary, the Company may disclose to any person the US federal income and state income tax treatment and tax structure of any transaction described herein and all materials of any kind (including tax opinions and other tax analyses) that are provided to the Company relating to such tax treatment and tax structure, without Goldman Sachs imposing any limitation of any kind. The Confidential Information has been prepared by the Investment Banking Division of Goldman Sachs and is not a product of its research department. Goldman Sachs and its affiliates are engaged in advisory, underwriting and financing, principal investing, sales and trading, research, investment management and other financial and non-financial activities and services for various persons and entities. Goldman Sachs and its affiliates and employees, and funds or other entities they manage or in which they invest or have other economic interests or with which they co-invest, may at any time purchase, sell, hold or vote long or short positions and investments in securities, derivatives, loans, commodities, currencies, credit default swaps and other financial instruments of the Company, any other party to any transaction and any of their respective affiliates or any currency or commodity that may be involved in any transaction. Goldman Sachs’ investment banking division maintains regular, ordinary course client service dialogues with clients and potential clients to review events, opportunities, and conditions in particular sectors and industries and, in that connection, Goldman Sachs may make reference to the Company, but Goldman Sachs will not disclose any confidential information received from the Company. The Confidential Information has been prepared based on historical financial information, forecasts and other information obtained by Goldman Sachs from publicly available sources, the management of the Company or other sources (approved for our use by the Company in the case of information from management and non-public information). In preparing the Confidential Information, Goldman Sachs has relied upon and assumed, without assuming any responsibility for independent verification, the accuracy and completeness of all of the financial, legal, regulatory, tax, accounting and other information provided to, discussed with or reviewed by us, and Goldman Sachs does not assume any liability for any such information. Goldman Sachs does not provide accounting, tax, legal or regulatory advice. Goldman Sachs has not made an independent evaluation or appraisal of the assets and liabilities (including any contingent, derivative or other off-balance sheet assets and liabilities) of the Company or any other party to any transaction or any of their respective affiliates and has no obligation to evaluate the solvency of the Company or any other party to any transaction under any state or federal laws relating to bankruptcy, insolvency or similar matters. The analyses contained in the Confidential Information do not purport to be appraisals nor do they necessarily reflect the prices at which businesses or securities actually may be sold or purchased. Goldman Sachs’ role in any due diligence review is limited solely to performing such a review as it shall deem necessary to support its own advice and analysis and shall not be on behalf of the Company. Analyses based upon forecasts of future results are not necessarily indicative of actual future results, which may be significantly more or less favorable than suggested by these analyses, and Goldman Sachs does not assume responsibility if future results are materially different from those forecast. The Confidential Information does not address the underlying business decision of the Company to engage in any transaction, or the relative merits of any transaction or strategic alternative referred to herein as compared to any other transaction or alternative that may be available to the Company. The Confidential Information is necessarily based on economic, monetary, market and other conditions as in effect on, and the information made available to Goldman Sachs as of, the date of such Confidential Information and Goldman Sachs assumes no responsibility for updating or revising the Confidential Information based on circumstances, developments or events occurring after such date. The Confidential Information does not constitute any opinion, nor does the Confidential Information constitute a recommendation to the Special Committee, any security holder of the Company or any other person as to how to vote or act with respect to any transaction or any other matter. The Confidential Information, including this disclaimer, is subject to, and governed by, any written agreement between the Company, the Board and/or any committee thereof, on the one hand, and Goldman Sachs, on the other hand. 2
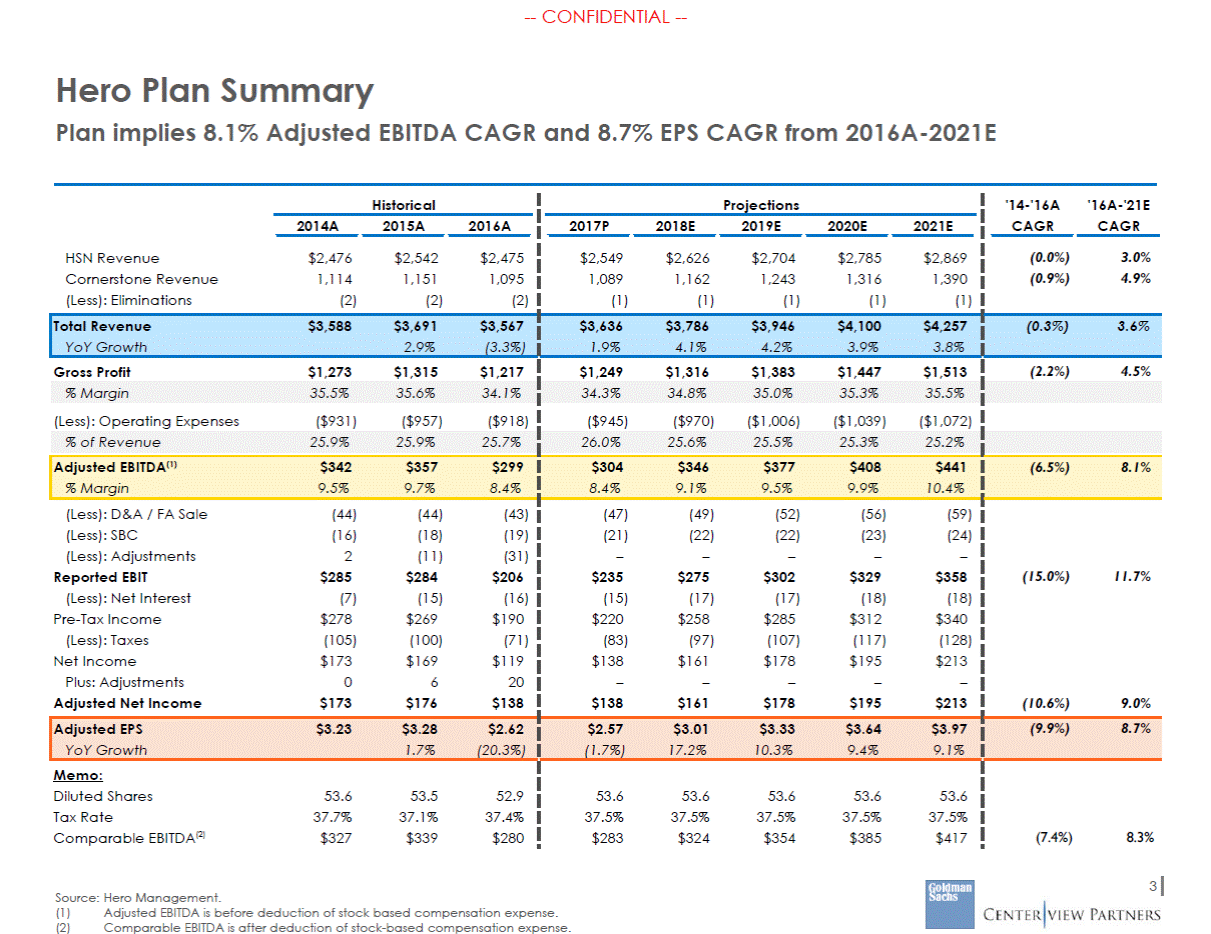
--CONFIDENTIAL --Hero Plan Summary Plan implies 8.1% Adjusted EBITDA CAGR and 8.7% EPS CAGR from 2016A-2021E 3 Source: Hero Management. (1) (2) Adjusted EBITDA is before deduction of stock based compensation expense. Comparable EBITDA is after deduction of stock-based compensation expense. Historical 2014A2015A2016A HSN Revenue$2,476$2,542$2,475 Cornerstone Revenue1,1141,1511,095 (Less): Eliminations(2)(2)(2) Projections 2017P2018E2019E2020E2021E $2,549$2,626$2,704$2,785$2,869 1,0891,1621,2431,3161,390 (1)(1)(1)(1)(1) '14-'16A'16A-'21E CAGRCAGR (0.0%)3.0% (0.9%)4.9% Total Revenue$3,588$3,691$3,567 YoY Growth2.9%(3.3%) $3,636$3,786$3,946$4,100$4,257 1.9%4.1%4.2%3.9%3.8% (0.3%)3.6% Gross Profit$1,273$1,315$1,217 $1,249$1,316$1,383$1,447$1,513 (2.2%)4.5% % Margin35.5%35.6%34.1% 34.3%34.8%35.0%35.3%35.5% (Less): Operating Expenses($931)($957)($918) ($945)($970)($1,006)($1,039)($1,072) % of Revenue25.9%25.9%25.7% 26.0%25.6%25.5%25.3%25.2% Adjusted EBITDA(1)$342$357$299 % Margin9.5%9.7%8.4% $304$346$377$408$441 8.4%9.1%9.5%9.9%10.4% (6.5%)8.1% (Less): D&A / FA Sale (44) (44) (43) (Less): SBC (16) (18) (19) (Less): Adjustments 2 (11) (31) Reported EBIT$285$284$206 (Less): Net Interest(7) (15)(16) Pre-Tax Income$278$269$190 (Less): Taxes (105) (100)(71) Net Income$173$169$119 Plus: Adjustments 0 6 20 Adjusted Net Income$173$176$138 (47)(49)(52)(56)(59) (21)(22)(22)(23)(24) ––––– $235$275$302$329$358 (15)(17)(17)(18)(18) $220$258$285$312$340 (83) (97) (107) (117)(128) $138$161$178$195$213 ––––– $138$161$178$195$213 (15.0%)11.7% (10.6%)9.0% Adjusted EPS$3.23$3.28$2.62 YoY Growth1.7%(20.3%) $2.57$3.01$3.33$3.64$3.97 (1.7%)17.2%10.3%9.4%9.1% (9.9%)8.7% Memo: Diluted Shares53.653.552.9 Tax Rate37.7%37.1%37.4% Comparable EBITDA(2) $327$339 $280 53.653.653.653.653.6 37.5%37.5%37.5%37.5%37.5% $283$324$354$385$417 (7.4%)8.3%
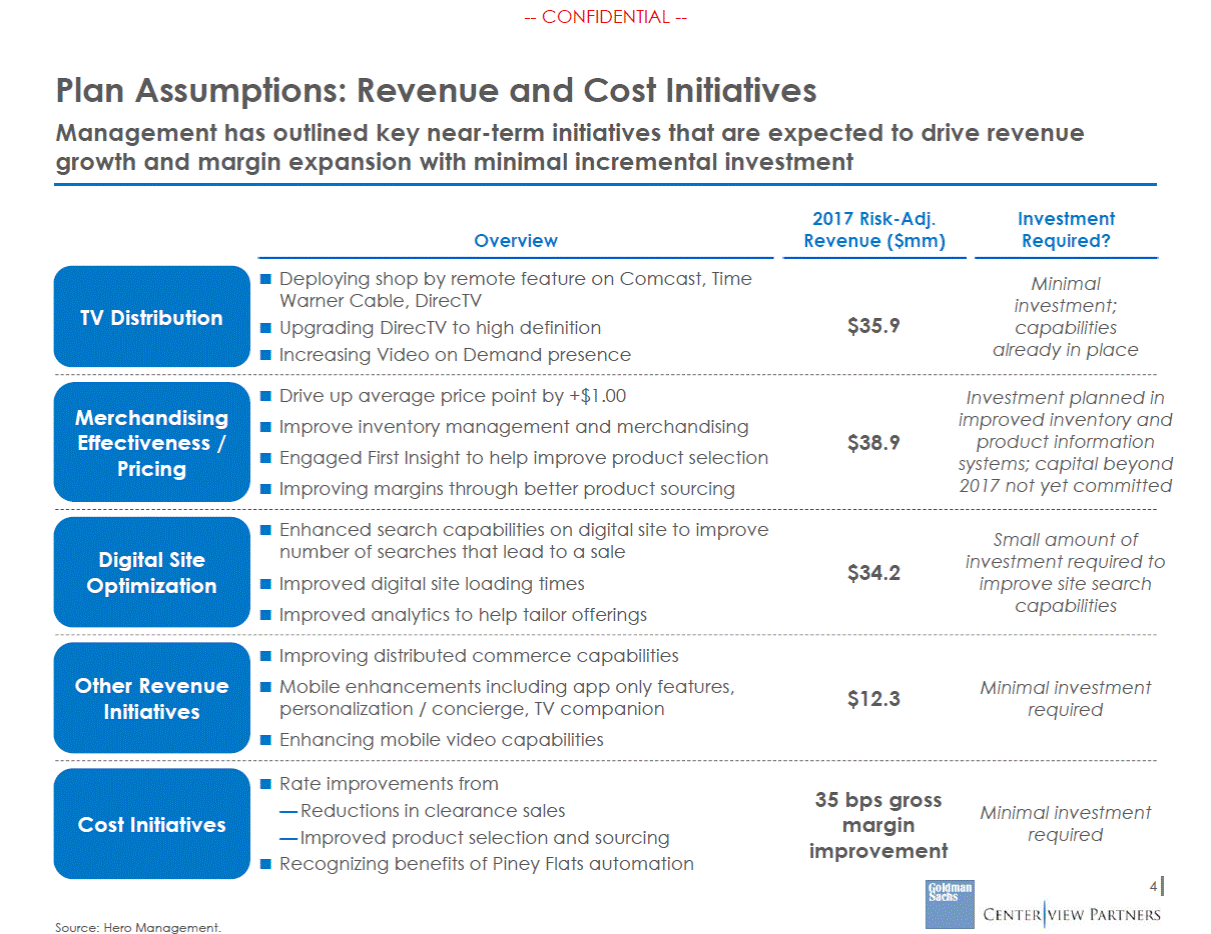
--CONFIDENTIAL --Plan Assumptions: Revenue and Cost Initiatives Management has outlined key near-term initiatives that are expected to drive revenue growth and margin expansion with minimal incremental investment 2017 Risk-Adj. Revenue ($mm) Investment Required? Overview Deploying shop by remote feature on Comcast, Time Warner Cable, DirecTV Upgrading DirecTV to high definition Increasing Video on Demand presence Minimal investment; capabilities already in place TV Distribution $35.9 Drive up average price point by +$1.00 Improve inventory management and merchandising Engaged First Insight to help improve product selection Improving margins through better product sourcing Investment planned in improved inventory and product information systems; capital beyond 2017 not yet committed Merchandising Effectiveness / Pricing $38.9 Enhanced search capabilities on digital site to improve number of searches that lead to a sale Improved digital site loading times Improved analytics to help tailor offerings Small amount of investment required to improve site search capabilities Digital Site Optimization $34.2 Improving distributed commerce capabilities Mobile enhancements including app only features, personalization / concierge, TV companion Enhancing mobile video capabilities Other Revenue Initiatives Minimal investment required $12.3 Rate improvements from — Reductions in clearance sales — Improved product selection and sourcing Recognizing benefits of Piney Flats automation 35 bps gross margin improvement Minimal investment required Cost Initiatives 4 Source: Hero Management.
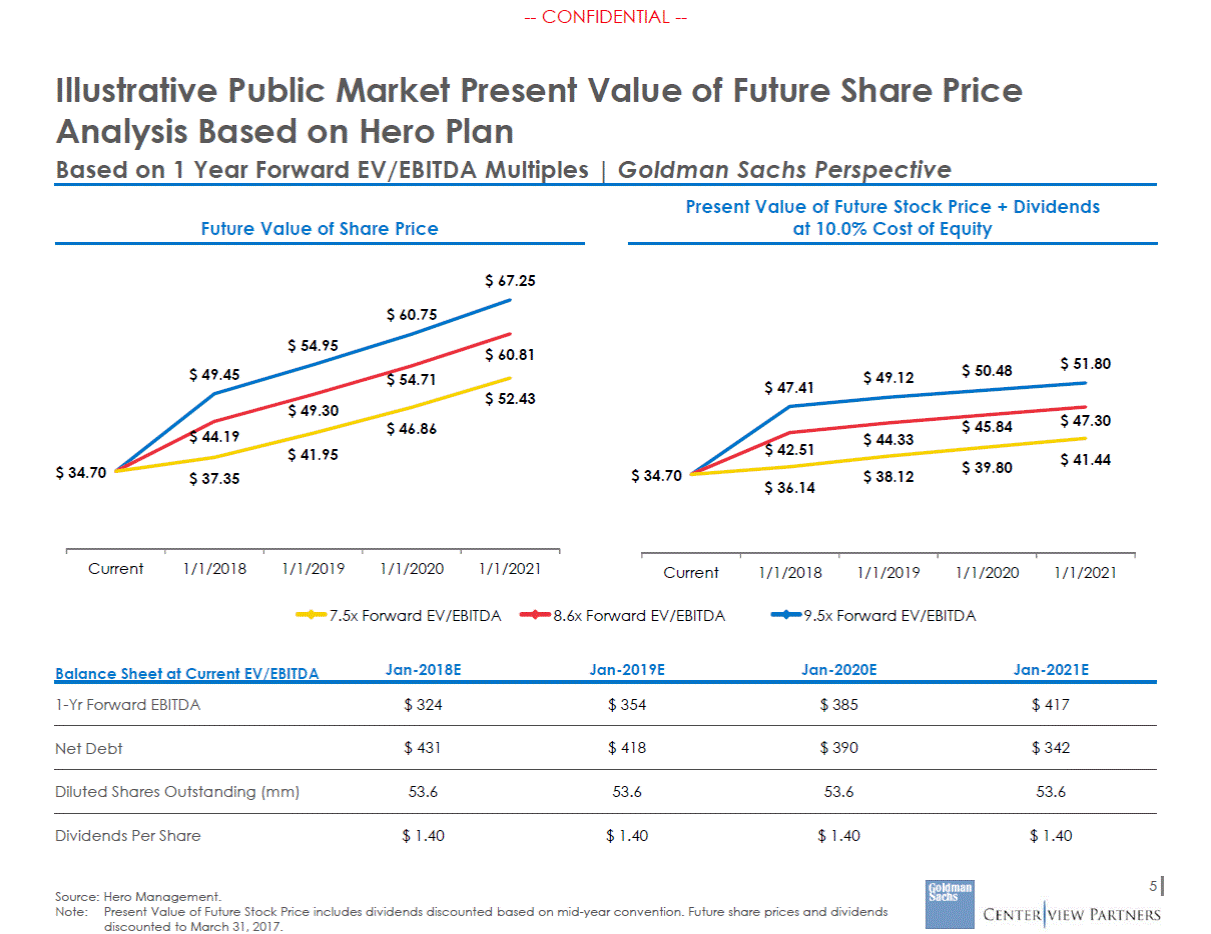
--CONFIDENTIAL --Illustrative Public Market Present Value of Future Share Price Analysis Based on Hero Plan Based on 1 Year Forward EV/EBITDA Multiples | Goldman Sachs Perspective Present Value of Future Stock Price + Dividends at 10.0% Cost of Equity Future Value of Share Price $ 67.25 $ 60.75 $ 54.95 $ 60.81 $ 51.80 $ 50.48 $ 49.45 $ 49.12 $ 54.71 $ 47.41 $ 52.43 $ 49.30 $ 47.30 $ 45.84 $ 46.86 $ 44.19 $ 44.33 $ 42.51 $ 41.95 $ 41.44 $ 39.80 $ 34.70 $ 34.70 $ 37.35 $ 38.12 $ 36.14 Current 1/1/2018 1/1/2019 1/1/2020 1/1/2021 Current 1/1/2018 1/1/2019 1/1/2020 1/1/2021 7.5x Forward EV/EBITDA 8.6x Forward EV/EBITDA 9.5x Forward EV/EBITDA Balance Sheet at Current EV/EBITDA Jan-2018E Jan-2019E Jan-2020E Jan-2021E 1-Yr Forward EBITDA $ 324 $ 354 $ 385 $ 417 Net Debt $ 431 $ 418 $ 390 $ 342 Diluted Shares Outstanding (mm) 53.6 53.6 53.6 53.6 $ 1.40 $ 1.40 $ 1.40 $ 1.40 Dividends Per Share 5 Source: Hero Management. Note:Present Value of Future Stock Price includes dividends discounted based on mid-year convention. Future share prices and dividends discounted to March 31, 2017.
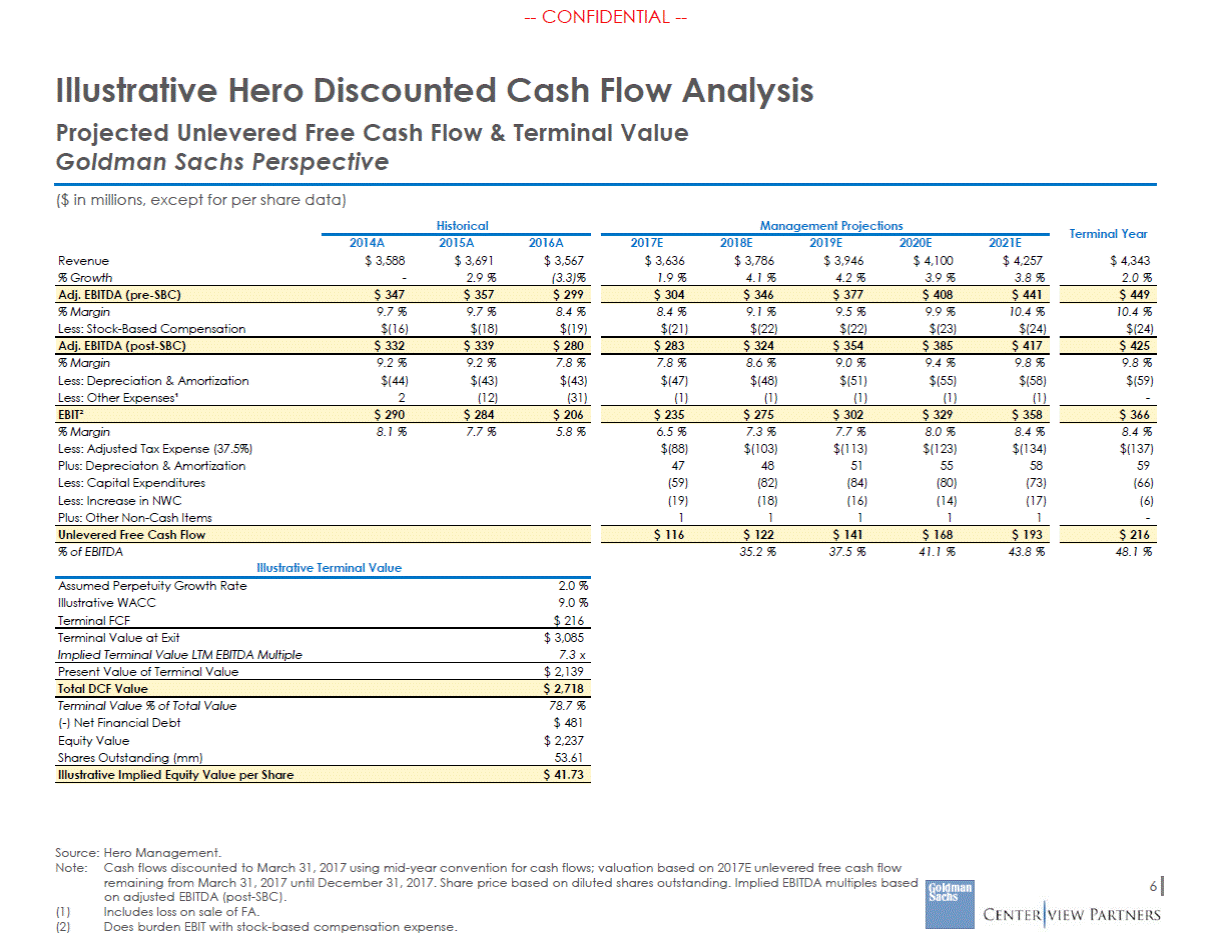
--CONFIDENTIAL --Illustrative Hero Discounted Cash Flow Analysis Projected Unlevered Free Cash Flow & Terminal Value Goldman Sachs Perspective ($ in millions, except for per share data) Historical Management Projections Terminal Year 2014A $ 3,588 - 2015A $ 3,691 2.9 % 2016A $ 3,567 (3.3)% 2017E $ 3,636 1.9 % 2018E $ 3,786 4.1 % 2019E $ 3,946 4.2 % 2020E $ 4,100 3.9 % 2021E $ 4,257 3.8 % Revenue % Growth $ 4,343 2.0 % % Margin Less: Stock-Based Compensation 9.7 % $(16) 9.7 % $(18) 8.4 % $(19) 8.4 % $(21) 9.1 % $(22) 9.5 % $(22) 9.9 % $(23) 10.4 % $(24) 10.4 % $(24) % Margin Less: Depreciation & Amortization Less: Other Expenses¹ 9.2 % $(44) 2 9.2 % $(43) (12) 7.8 % $(43) (31) 7.8 % $(47) (1) 8.6 % $(48) (1) 9.0 % $(51) (1) 9.4 % $(55) (1) 9.8 % $(58) (1) 9.8 % $(59) - % Margin Less: Adjusted Tax Expense (37.5%) Plus: Depreciaton & Amortization Less: Capital Expenditures Less: Increase in NWC Plus: Other Non-Cash Items 8.1 % 7.7 % 5.8 % 6.5 % $(88) 47 (59) (19) 1 7.3 % $(103) 48 (82) (18) 1 7.7 % $(113) 51 (84) (16) 1 8.0 % $(123) 55 (80) (14) 1 8.4 % $(134) 58 (73) (17) 1 8.4 % $(137) 59 (66) (6) - % of EBITDA 35.2 % 37.5 % 41.1 % 43.8 % 48.1 % Illustrative Terminal Value Assumed Perpetuity Growth Rate Illustrative WACC Terminal FCF 2.0 % 9.0 % $ 216 Terminal Value at Exit Implied Terminal Value LTM EBITDA Multiple $ 3,085 7.3 x Present Value of Terminal Value $ 2,139 Terminal Value % of Total Value (-) Net Financial Debt Equity Value Shares Outstanding (mm) 78.7 % $ 481 $ 2,237 53.61 Source: Hero Management. Note: Cash flows discounted to March 31, 2017 using mid-year convention for cash flows; valuation based on 2017E unlevered free cash flow remaining from March 31, 2017 until December 31, 2017. Share price based on diluted shares outstanding. Implied EBITDA multiples based on adjusted EBITDA (post-SBC). Includes loss on sale of FA. Does burden EBIT with stock-based compensation expense. 6 (1) (2) Illustrative Implied Equity Value per Share $ 41.73 Total DCF Value $ 2,718 $ 216 $ 116 $ 122 $ 141 $ 168 $ 193 Unlevered Free Cash Flow $ 366 $ 235 $ 275 $ 302 $ 329 $ 358 EBIT² $ 290 $ 284 $ 206 $ 425 $ 283 $ 324 $ 354 $ 385 $ 417 Adj. EBITDA (post-SBC) $ 332 $ 339 $ 280 $ 449 $ 304 $ 346 $ 377 $ 408 $ 441 Adj. EBITDA (pre-SBC) $ 347 $ 357 $ 299
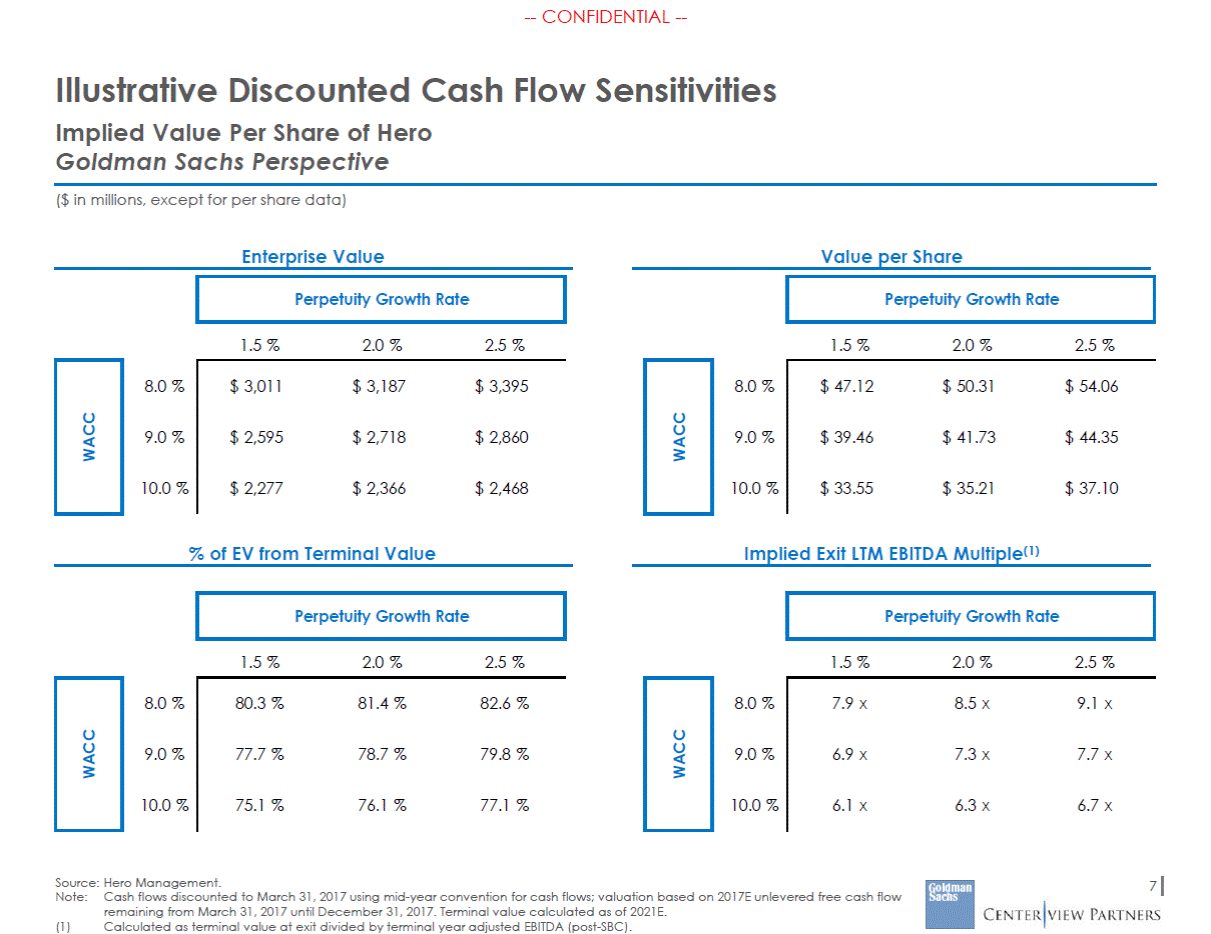
--CONFIDENTIAL --Illustrative Discounted Cash Flow Implied Value Per Share of Hero Goldman Sachs Perspective Sensitivities ($ in millions, except for per share data) Enterprise Value Value per Share 1.5 % 2.0 % 2.5 % 1.5 % 2.0 % 2.5 % 8.0 % 8.0 % 9.0 % 9.0 % 10.0 % 10.0 % Implied Exit LTM EBITDA Multiple(1) % of EV from Terminal Value 1.5 % 2.0 % 2.5 % 1.5 % 2.0 % 2.5 % 8.0 % 8.0 % 9.0 % 9.0 % 10.0 % 10.0 % Source: Hero Management. Note:Cash flows discounted to March 31, 2017 using mid-year convention for cash flows; valuation based on 2017E unlevered free cash flow remaining from March 31, 2017 until December 31, 2017. Terminal value calculated as of 2021E. 7 (1) Calculated as terminal value at exit divided by terminal year adjusted EBITDA (post-SBC). 7.9 x 8.5 x 9.1 x 6.9 x 7.3 x 7.7 x 6.1 x 6.3 x 6.7 x WACC 80.3 % 81.4 % 82.6 % 77.7 % 78.7 % 79.8 % 75.1 % 76.1 % 77.1 % WACC Perpetuity Growth Rate Perpetuity Growth Rate $ 47.12 $ 50.31 $ 54.06 $ 39.46 $ 41.73 $ 44.35 $ 33.55 $ 35.21 $ 37.10 WACC $ 3,011 $ 3,187 $ 3,395 $ 2,595 $ 2,718 $ 2,860 $ 2,277 $ 2,366 $ 2,468 WACC Perpetuity Growth Rate Perpetuity Growth Rate
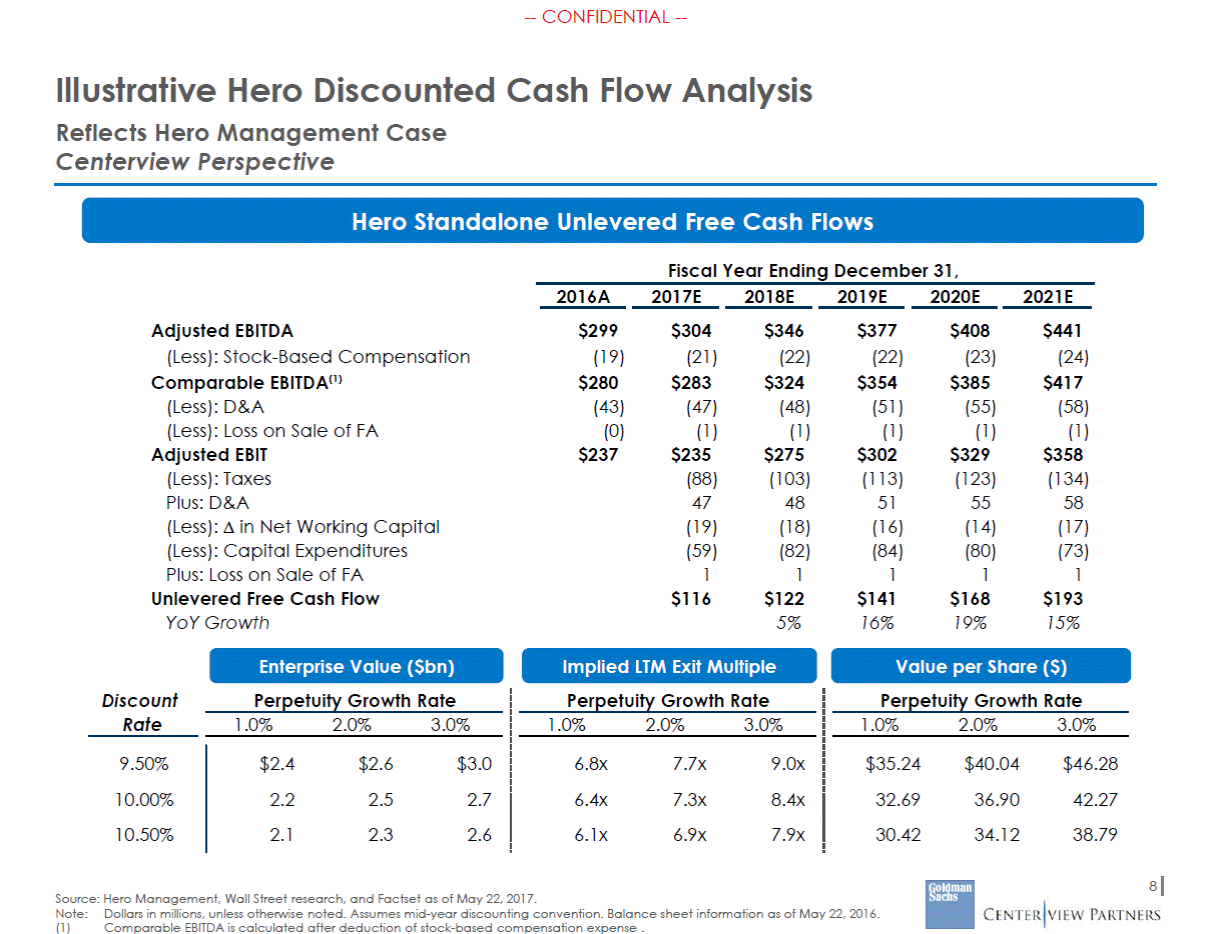
--CONFIDENTIAL --Illustrative Hero Discounted Cash Flow Analysis Reflects Hero Management Case Centerview Perspective Hero Standalone Unlevered Free Cash Flows Fiscal Year Ending December 31, 2016A 2017E 2018E 2019E 2020E 2021E Adjusted EBITDA (Less): Stock-Based Compensation Comparable EBITDA(1) (Less): D&A (Less): Loss on Sale of FA Adjusted EBIT (Less): Taxes Plus: D&A (Less): in Net Working Capital (Less): Capital Expenditures Plus: Loss on Sale of FA Unlevered Free Cash Flow YoY Growth $299 (19) $280 (43) (0) $237 $304 (21) $283 (47) (1) $235 (88) 47 (19) (59) 1 $116 $346 (22) $324 (48) (1) $275 (103) 48 (18) (82) 1 $122 5% $377 (22) $354 (51) (1) $302 (113) 51 (16) (84) 1 $141 16% $408 (23) $385 (55) (1) $329 (123) 55 (14) (80) 1 $168 19% $441 (24) $417 (58) (1) $358 (134) 58 (17) (73) 1 $193 15% Enterprise Value ($bn) Perpetuity Growth Rate Implied LTM Exit Multiple Perpetuity Growth Rate Value per Share ($) Perpetuity Growth Rate Discount Rate 1.0% 2.0% 3.0% 1.0% 2.0% 3.0% 1.0% 2.0% 3.0% 9.50% 10.00% 10.50% $2.4 2.2 2.1 $2.6 2.5 2.3 $3.0 2.7 2.6 6.8x 6.4x 6.1x 7.7x 7.3x 6.9x 9.0x 8.4x 7.9x $35.24 32.69 30.42 $40.04 36.90 34.12 $46.28 42.27 38.79 8 Source: Hero Management, Wall Street research, and Factset as of May 22, 2017. Note:Dollars in millions, unless otherwise noted. Assumes mid-year discounting convention. Balance sheet information as of May 22, 2016. (1) Comparable EBITDA is calculated after deduction of stock-based compensation expense .
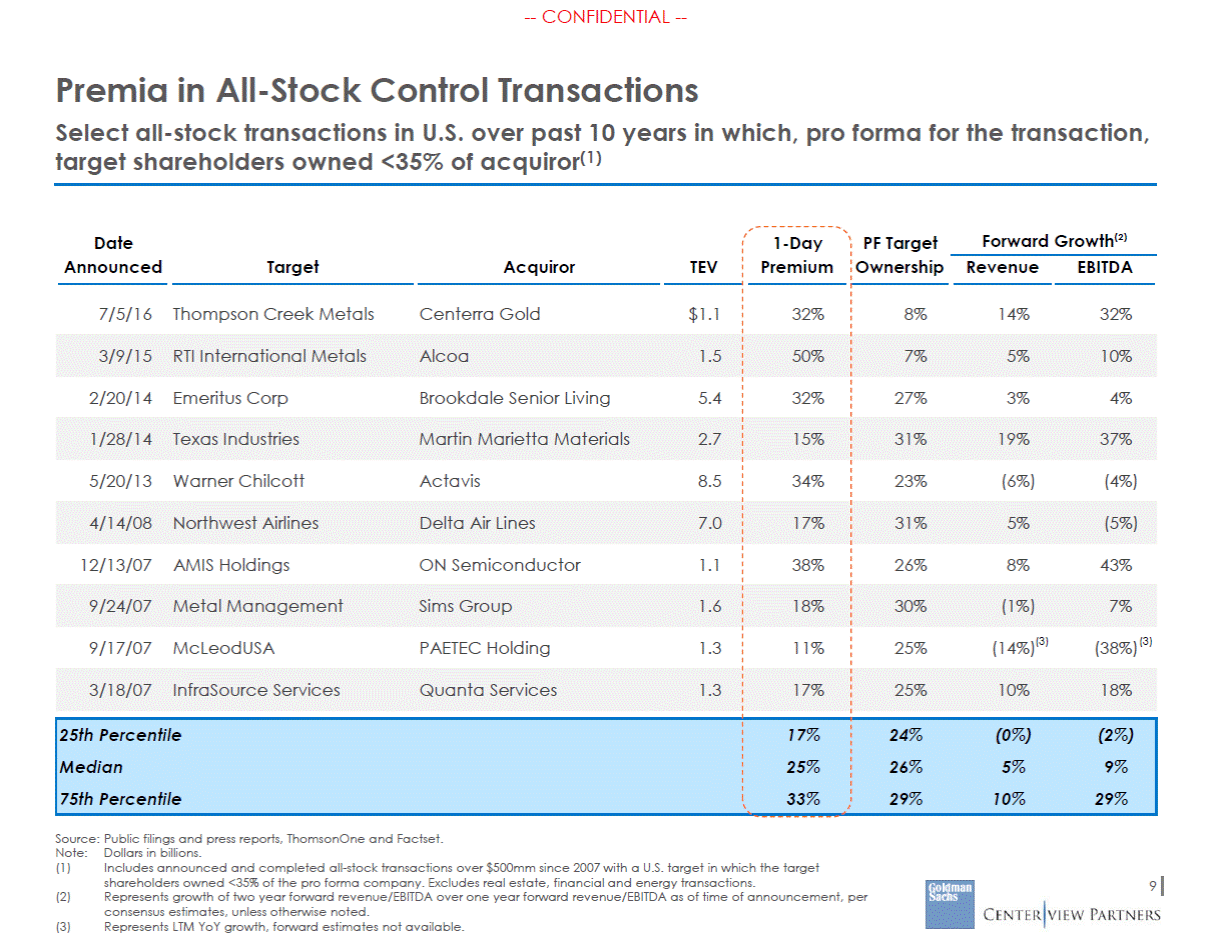
--CONFIDENTIAL --Premia in All-Stock Control Transactions Select all-stock transactions in U.S. over past 10 years in which, pro forma for the transaction, target shareholders owned <35% of acquiror(1) Forward Growth(2) Date Announced 1-Day Premium PF Target Ownership Target Acquiror TEV Revenue EBITDA 7/5/16 Thompson Creek Metals Centerra Gold $1.1 32% 8% 14% 32% 2/20/14 Emeritus Corp Brookdale Senior Living 5.4 32% 27% 3% 4% 5/20/13 Warner Chilcott Actavis 8.5 34% 23% (6%) (4%) 12/13/07 AMIS Holdings ON Semiconductor 1.1 38% 26% 8% 43% (14%)(3) (38%)(3) 9/17/07 McLeodUSA PAETEC Holding 1.3 11% 25% Source: Public filings and press reports, ThomsonOne and Factset. Note: (1) Dollars in billions. Includes announced and completed all-stock transactions over $500mm since 2007 with a U.S. target in which the target shareholders owned <35% of the pro forma company. Excludes real estate, financial and energy transactions. Represents growth of two year forward revenue/EBITDA over one year forward revenue/EBITDA as of time of announcement, per consensus estimates, unless otherwise noted. Represents LTM YoY growth, forward estimates not available. 9 (2) (3) 25th Percentile 17% 24% (0%) (2%) Median 25% 26% 5% 9% 75th Percentile 33% 29% 10% 29% 3/18/07 InfraSource Services Quanta Services 1.3 17% 25% 10% 18% 9/24/07 Metal Management Sims Group 1.6 18% 30% (1%) 7% 4/14/08 Northwest Airlines Delta Air Lines 7.0 17% 31% 5% (5%) 1/28/14 Texas Industries Martin Marietta Materials 2.7 15% 31% 19% 37% 3/9/15 RTI International Metals Alcoa 1.5 50% 7% 5% 10%
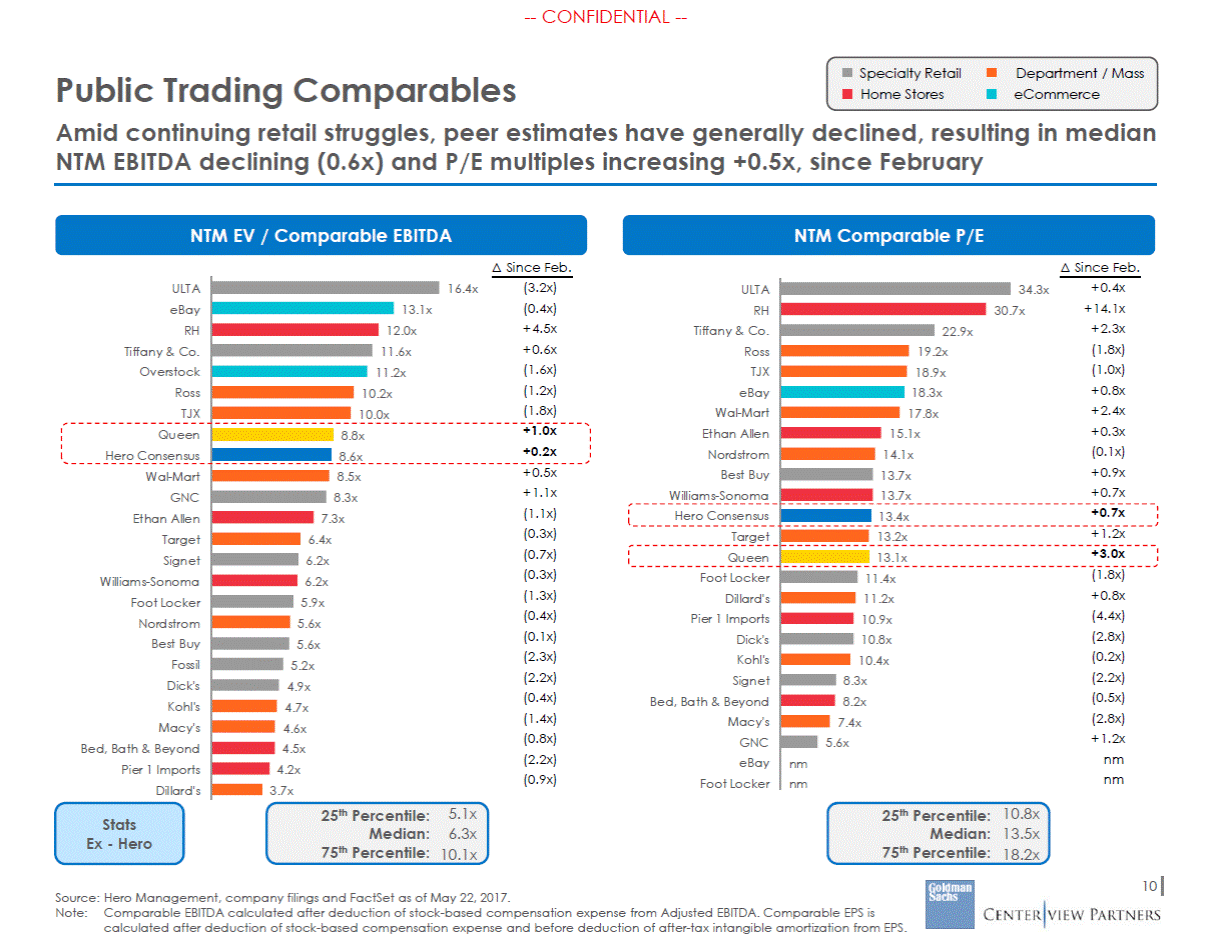
--CONFIDENTIAL --Specialty Retail Home Stores Department / Mass eCommerce Public Trading Comparables Amid continuing retail struggles, peer estimates have generally declined, resulting in median NTM EBITDA declining (0.6x) and P/E multiples increasing +0.5x, since February NTM EV / Comparable EBITDA NTM Comparable P/E Since Feb. Since Feb. (3.2x) (0.4x) +4.5x +0.6x (1.6x) (1.2x) (1.8x) ULT A eBay RH Tiffany & Co. Overstock Ross TJX 16.4x 13.1x 12.0x 11.6x 11.2x 10.2x 10.0x +1.0x Queen Hero Consensus 8.8x +0.5x 8.5x 8.3x +1.1x (1.1x) (0.3x) (0.7x) (0.3x) (1.3x) (0.4x) (0.1x) (2.3x) (2.2x) (0.4x) (1.4x) (0.8x) (2.2x) (0.9x) 7.3x 6.4x 6.2x 6.2x 5.9x 5.6x 5.6x 5.2x 4.9x 4.7x 4.6x 4.5x (0.5x) 8.2x 4.2x 3.7x 5.1x 6.3x 10.1x 10.8x 13.5x 18.2x 25th Percentile: Median: 75th Percentile: 25th Percentile: Median: 75th Percentile: Stats Ex - Hero 10 Source: Hero Management, company filings and FactSet as of May 22, 2017. Note:Comparable EBITDA calculated after deduction of stock-based compensation expense from Adjusted EBITDA. Comparable EPS is calculated after deduction of stock-based compensation expense and before deduction of after-tax intangible amortization from EPS. ULT A RH Tiffany & Co. Ross TJX eBay Wal-Mart Et han Allen Nordstrom Best Buy Williams-Sonoma 34.3x+0.4x 30.7x+ 14.1x 22.9x+2.3x 19.2x(1.8x) 18.9x(1.0x) 18.3x+0.8x 17.8x+2.4x 15.1x+0.3x 14.1x(0.1x) 13.7x+0.9x 13.7x+0.7x Hero Consensus 13.4x+0.7x Target 13.2x+1.2x Queen Foot Locker Dillard's Pier 1 Imports Dick's Kohl's Signet Bed, Ba th & Beyond Macy's GNC eBay Foot Locker 13.1x+3.0x 11.4x(1.8x) 11.2x+0.8x 10.9x(4.4x) 10.8x(2.8x) 10.4x(0.2x) 8.3x(2.2x) 7.4x(2.8x) 5.6x+1.2x nmnm nmnm 8.6x+0.2x Wal-Mart GNC Et han Allen Target Signet Williams-Sonoma Foot Locker Nordstrom Best Buy Fossil Dick's Kohl's Macy's Bed, Ba th & Beyond Pier 1 Imports Dillard's
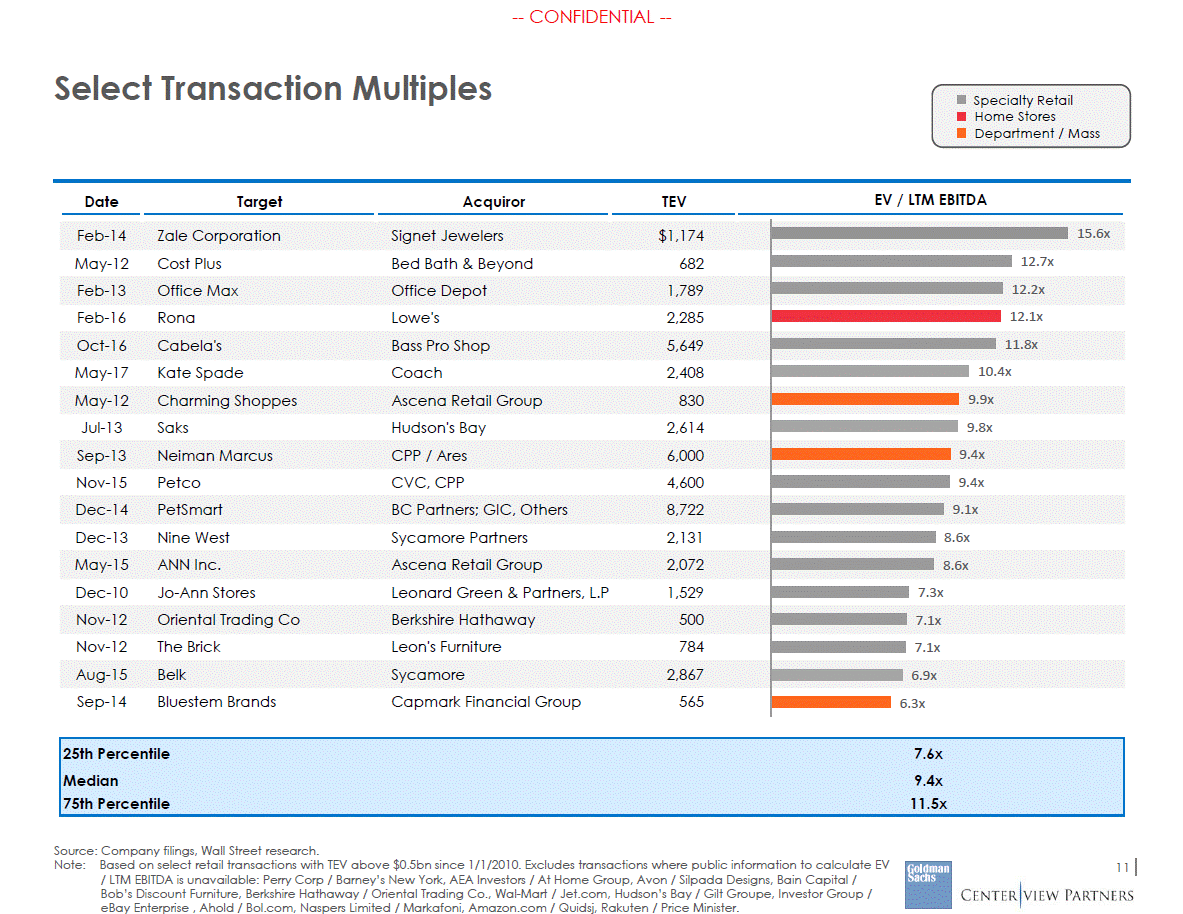
--CONFIDENTIAL --Select Transaction Multiples Specialty Retail Home Stores Department / Mass EV / LTM EBITDA Date Target Acquiror TEV Source: Company filings, Wall Street research. Note: Based on select retail transactions with TEV above $0.5bn since 1/1/2010. Excludes transactions where public information to calculate EV / LTM EBITDA is unavailable: Perry Corp / Barney’s New York, AEA Investors / At Home Group, Avon / Silpada Designs, Bain Capital / Bob’s Discount Furniture, Berkshire Hathaway / Oriental Trading Co., Wal-Mart / Jet.com, Hudson’s Bay / Gilt Groupe, Investor Group / eBay Enterprise , Ahold / Bol.com, Naspers Limited / Markafoni, Amazon.com / Quidsj, Rakuten / Price Minister. 11 25th Percentile7.6x Median9.4x 75th Percentile11.5x Feb-14Zale CorporationSignet Jewelers$1,174 15.6x May-12Cost PlusBed Bath & Beyond682 12.7x Feb-13Office MaxOffice Depot1,789 12.2x Feb-16RonaLowe's2,285 12.1x Oct-16Cabela'sBass Pro Shop5,649 11.8x May-17Kate SpadeCoach2,408 10.4x May-12Charming ShoppesAscena Retail Group830 9.9x Jul-13SaksHudson's Bay2,614 9.8x Sep-13Neiman MarcusCPP / Ares6,000 9.4x Nov-15PetcoCVC, CPP4,600 9.4x Dec-14PetSmartBC Partners; GIC, Others8,722 9.1x Dec-13Nine WestSycamore Partners2,131 8.6x May-15ANN Inc.Ascena Retail Group2,072 8.6x Dec-10Jo-Ann StoresLeonard Green & Partners, L.P1,529 7.3x Nov-12Oriental Trading CoBerkshire Hathaway500 7.1x Nov-12The BrickLeon's Furniture784 7.1x Aug-15BelkSycamore2,867 6.9x Sep-14Bluestem BrandsCapmark Financial Group565 6.3x
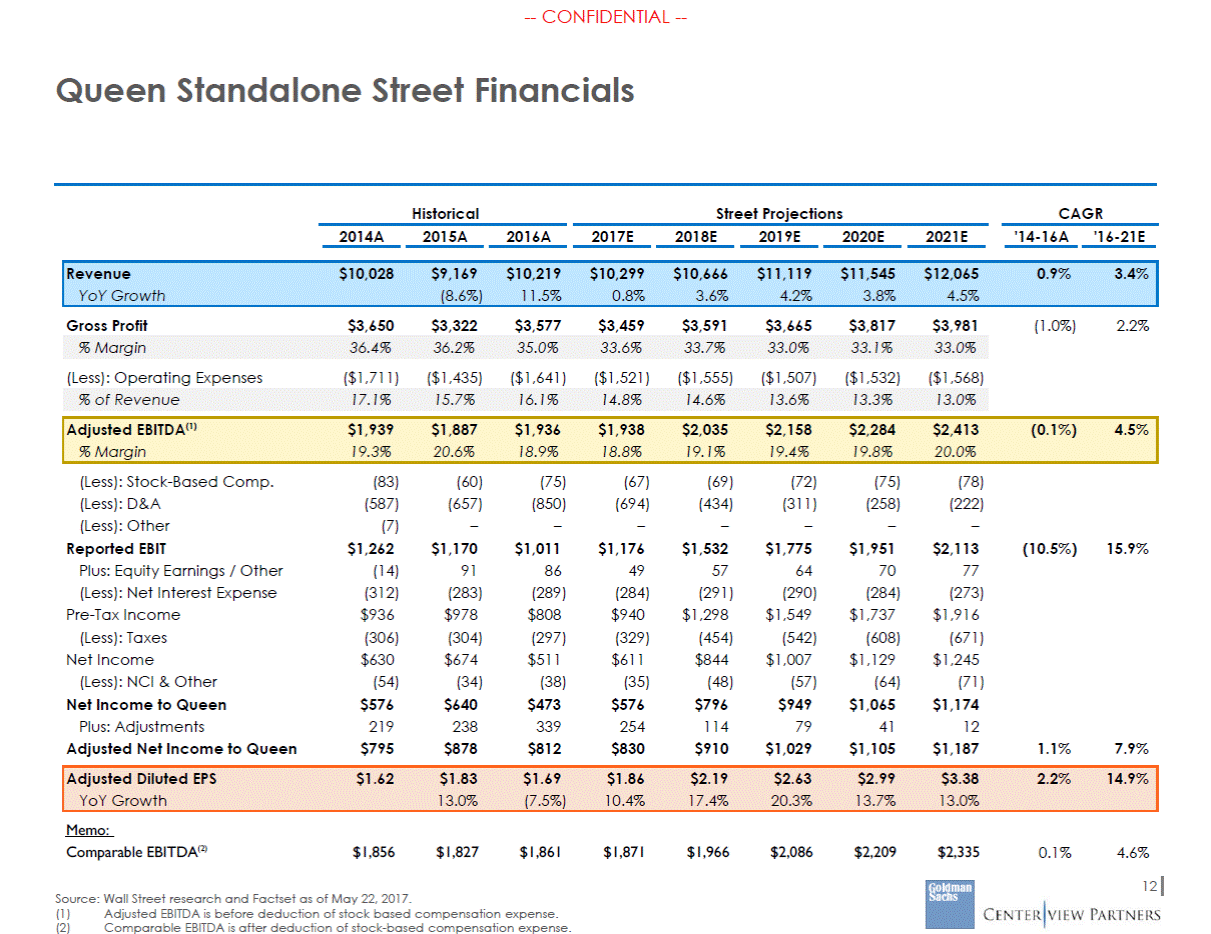
--CONFIDENTIAL --Queen Standalone Street Financials Historical Street Projections CAGR 2014A 2015A 2016A 2017E 2018E 2019E 2020E 2021E '14-16A '16-21E Gross Profit $3,650 $3,322 $3,577 $3,459 $3,591 $3,665 $3,817 $3,981 (1.0%) 2.2% (Less): Operating Expenses ($1,711) ($1,435) ($1,641) ($1,521) ($1,555) ($1,507) ($1,532) ($1,568) (Less): Stock-Based Comp. (Less): D&A (Less): Other Reported EBIT Plus: Equity Earnings / Other (Less): Net Interest Expense Pre-Tax Income (Less): Taxes Net Income (Less): NCI & Other Net Income to Queen Plus: Adjustments Adjusted Net Income to Queen (83) (587) (7) $1,262 (14) (312) $936 (306) $630 (54) $576 219 $795 (60) (657) – $1,170 91 (283) $978 (304) $674 (34) $640 238 $878 (75) (850) – $1,011 86 (289) $808 (297) $511 (38) $473 339 $812 (67) (694) – $1,176 49 (284) $940 (329) $611 (35) $576 254 $830 (69) (434) – $1,532 57 (291) $1,298 (454) $844 (48) $796 114 $910 (72) (311) – $1,775 64 (290) $1,549 (542) $1,007 (57) $949 79 $1,029 (75) (258) – $1,951 70 (284) $1,737 (608) $1,129 (64) $1,065 41 $1,105 (78) (222) – $2,113 77 (273) $1,916 (671) $1,245 (71) $1,174 12 $1,187 (10.5%) 15.9% 1.1% 7.9% Memo: Comparable EBITDA(2) $1,856 $1,827 $1,861 $1,871 $1,966 $2,086 $2,209 $2,335 0.1% 4.6% 12 Source: Wall Street research and Factset as of May 22, 2017. (1) (2) Adjusted EBITDA is before deduction of stock based compensation expense. Comparable EBITDA is after deduction of stock-based compensation expense. Adjusted Diluted EPS$1.62$1.83$1.69$1.86$2.19$2.63$2.99$3.382.2%14.9% YoY Growth13.0%(7.5%)10.4%17.4%20.3%13.7%13.0% Adjusted EBITDA(1)$1,939$1,887$1,936$1,938$2,035$2,158$2,284$2,413(0.1%)4.5% % Margin19.3%20.6%18.9%18.8%19.1%19.4%19.8%20.0% % of Revenue17.1%15.7%16.1%14.8%14.6%13.6%13.3%13.0% % Margin36.4%36.2%35.0%33.6%33.7%33.0%33.1%33.0% Revenue$10,028$9,169$10,219$10,299$10,666$11,119$11,545$12,0650.9%3.4% YoY Growth(8.6%)11.5%0.8%3.6%4.2%3.8%4.5%
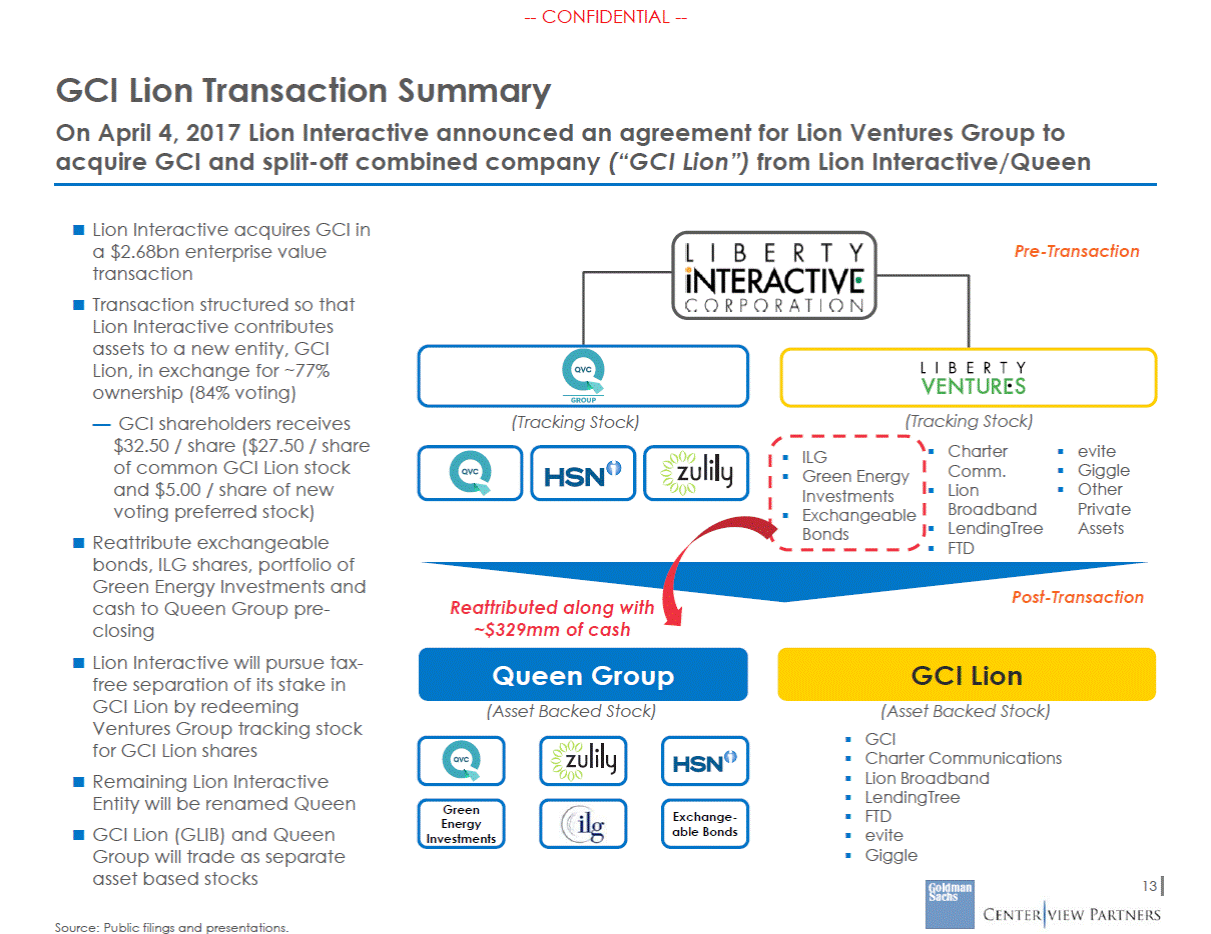
--CONFIDENTIAL --GCI Lion Transaction Summary On April 4, 2017 Lion Interactive announced an agreement for Lion Ventures Group to acquire GCI and split-off combined company (“GCI Lion”) from Lion Interactive/Queen Lion Interactive acquires GCI in a $2.68bn enterprise value transaction Transaction structured so that Lion Interactive contributes assets to a new entity, GCI Lion, in exchange for ~77% ownership (84% voting) — GCI shareholders receives $32.50 / share ($27.50 / share of common GCI Lion stock and $5.00 / share of new voting preferred stock) Reattribute exchangeable bonds, ILG shares, portfolio of Green Energy Investments and cash to Queen Group pre-closing Lion Interactive will pursue tax-free separation of its stake in GCI Lion by redeeming Ventures Group tracking stock for GCI Lion shares Remaining Lion Interactive Entity will be renamed Queen GCI Lion (GLIB) and Queen Group will trade as separate asset based stocks Pre-Transaction Lion Interactive (Tracking Stock) (Tracking Stock) evite Giggle Other Private Assets Charter Comm. Lion Broadband LendingTree FTD ILG Green Energy Investments Exchangeable Bonds Post-Transaction Reattributed along with ~$329mm of cash Queen Group (Asset Backed Stock) GCI Lion (Asset Backed Stock) GCI Charter Communications Lion Broadband LendingTree FTD evite Giggle Green Energy Investments Exchange-able Bonds 13 Source: Public filings and presentations.
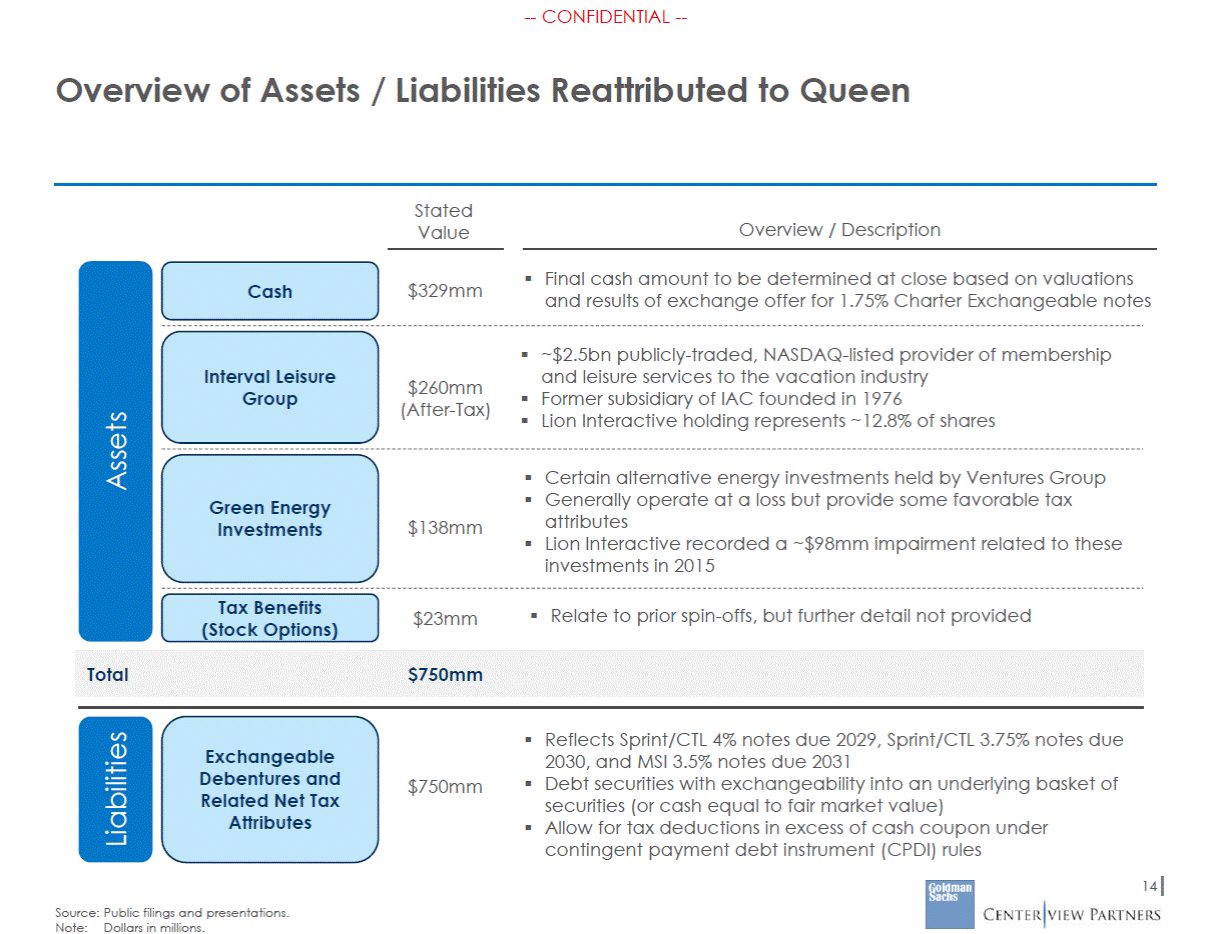
--CONFIDENTIAL --Overview of Assets / Liabilities Reattributed to Queen Stated Value Overview / Description Final cash amount to be determined at close based on valuations and results of exchange offer for 1.75% Charter Exchangeable notes $329mm Cash ~$2.5bn publicly-traded, NASDAQ-listed provider of membership and leisure services to the vacation industry Former subsidiary of IAC founded in 1976 Lion Interactive holding represents ~12.8% of shares Interval Leisure Group $260mm (After-Tax) Certain alternative energy investments held by Ventures Group Generally operate at a loss but provide some favorable tax attributes Lion Interactive recorded a ~$98mm impairment related to these investments in 2015 Green Energy Investments $138mm Tax Benefits (Stock Options) Relate to prior spin-offs, but further detail not provided $23mm Reflects Sprint/CTL 4% notes due 2029, Sprint/CTL 3.75% notes due 2030, and MSI 3.5% notes due 2031 Debt securities with exchangeability into an underlying basket of securities (or cash equal to fair market value) Allow for tax deductions in excess of cash coupon under contingent payment debt instrument (CPDI) rules Exchangeable Debentures and Related Net Tax Attributes $750mm 14 Source: Public filings and presentations. Note:Dollars in millions. Liabilities Assets Total$750mm
