Disclaimer (Centerview Partners) This presentation has been prepared by Centerview Partners LLC (“Centerview”) for use solely by the Special Committee of the Board of Directors of HSN, Inc. (“Hero” or the “Company”) in connection with its evaluation of a proposed transaction involving the Company and for no other purpose. The information contained herein is based upon information supplied by Hero and publicly available information, and portions of the information contained herein may be based upon statements, estimates and forecasts provided by the Company. Centerview has relied upon the accuracy and completeness of the foregoing information, and have not assumed any responsibility for any independent verification of such information or for any independent evaluation or appraisal of any of the assets or liabilities (contingent or otherwise) of the Company or any other entity, or concerning the solvency or fair value of the Company or any other entity. With respect to financial forecasts, including wit h respect to estimates of potential synergies, Centerview has assumed that such forecasts have been reasonably prepared on bases reflecting the best currently available estimates and judgments of the management of the Company as to its financial performances, and at your direction Centerview has relied upon such forecasts, as provided by the Company’s management, with respect to the Company, including as to expected synergies. Centerview assumes no responsibility for and expresses no view as to such forecasts or the assumptions on which they are based. The information set forth herein is based upon economic, monetary, market and other conditions as in effect on, and the information made available to us as of, the date hereof, unless indicated otherwise and Centerview assumes no obligation to update or otherwise revise these materials. The financial analysis in this presentation is complex and is not necessarily susceptible to a partial analysis or summary de scription. In performing this financial analysis, Centerview has considered the results of its analysis as a whole and did not necessarily attribute a particular weight to any particular portion of the analysis considered. Furthermore, selecting any portion of Centerview’s analysis, without considering the analysis as a whole, would create an incomplete view of the process underlying its financial analysis. Centerview may have deemed various assumptions more or less probable than other assumptions, so the reference ranges resulting from any particular portion of the analysis described above should not be taken to be Centerview’s view of the actual value of the Company. These materials and the information contained herein are confidential, were not prepared with a view toward public disclosure , and may not be disclosed publicly or made available to third parties without the prior written consent of Centerview. These materials and any other advice, written or oral, rendered by Centerview are intended solely for the benefit and use of the Special Committee of the Board of Directors of the Company (in its capacity as such) in its consideration of the proposed transaction, and are not for the benefit of, and do not convey any rights or remedies for any holder of securities of the Company or any other person. Centerview will not be responsible for and has not provided any tax, accounting, actuarial, legal or other specialist advice. These materials are not intended to provide the sole basis for evaluating the p roposed transaction, and this presentation does not represent a fairness opinion, recommendation, valuation or opinion of any kind, and is necessarily incomplete and should be viewed solely in conjunction with the oral presentation provided by Centerview. 1
Disclaimer (Goldman Sachs) These materials have been prepared and are provided by Goldman Sachs on a confidential basis solely for the information and assistance of the Special Committee of the Board of Directors (the "Special Committee") of Hero (the "Company") in connection with its consideration of the matters referred to herein. These materials and Goldman Sachs’ presentation relating to these materials (the “Confidential Information”) may not be disclosed to any third party or circulated or referred to publicly or used for or relied upon for any other purpose without the prior written consent of Goldman Sachs. The Confidential Information was not prepared with a view to public disclosure or to conform to any disclosure standards under any state, federal or international securities laws or other laws, rules or regulations, and Goldman Sachs does not take any responsibility for the use of the Confidential Information by persons other than those set forth above. Notwithstanding anything in this Confidential Information to the contrary, the Company may disclose to any person the US federal income and state income tax treatment and tax structure of any transaction described herein and all materials of any kind (including tax opinions and other tax analyses) that are provided to the Company relating to such tax treatment and tax structure, without Goldman Sachs imposing any limitation of any kind. The Confidential Information has been prepared by the Investment Banking Division of Goldman Sachs and is not a product of its research department. Goldman Sachs and its affiliates are engaged in advisory, underwriting and financing, principal investing, sales and trading, research, investment management and other financial and non-financial activities and services for various persons and entities. Goldman Sachs and its affiliates and employees, and funds or other entities they manage or in which they invest or have other economic interests or with which they co-invest, may at any time purchase, sell, hold or vote long or short positions and investments in securities, derivatives, loans, commodities, currencies, credit default swaps and other financial instruments of the Company, any other party to any transaction and any of their respective affiliates or any currency or commodity that may be involved in any transaction. Goldman Sachs’ investment banking division maintains regular, ordinary course client service dialogues with clients and potential clients to review events, opportunities, and conditions in particular sectors and industries and, in that connection, Goldman Sachs may make reference to the Company, but Goldman Sachs will not disclose any confidential information received from the Company. The Confidential Information has been prepared based on historical financial information, forecasts and other information obtained by Goldman Sachs from publicly available sources, the management of the Company or other sources (approved for our use by the Company in the case of information from management and non-public information). In preparing the Confidential Information, Goldman Sachs has relied upon and assumed, without assuming any responsibility for independent verification, the accuracy and completeness of all of the financial, legal, regulatory, tax, accounting and other information provided to, discussed with or reviewed by us, and Goldman Sachs does not assume any liability for any such information. Goldman Sachs does not provide accounting, tax, legal or regulatory advice. Goldman Sachs has not made an independent evaluation or appraisal of the assets and liabilities (including any contingent, derivative or other off-balance sheet assets and liabilities) of the Company or any other party to any transaction or any of their respective affiliates and has no obligation to evaluate the solvency of the Company or any other party to any transaction under any state or federal laws relating to bankruptcy, insolvency or similar matters. The analyses contained in the Confidential Information do not purport to be appraisals nor do they necessarily reflect the prices at which businesses or securities actually may be sold or purchased. Goldman Sachs’ role in any due diligence review is limited solely to performing such a review as it shall deem necessary to support its own advice and analysis and shall not be on behalf of the Company. Analyses based upon forecasts of future results are not necessarily indicative of actual future results, which may be significantly more or less favorable than suggested by these analyses, and Goldman Sachs does not assume responsibility if future results are materially different from those forecast. The Confidential Information does not address the underlying business decision of the Company to engage in any transaction, or the relative merits of any transaction or strategic alternative referred to herein as compared to any other transaction or alternative that may be available to the Company. The Confidential Information is necessarily based on economic, monetary, market and other conditions as in effect on, and the information made available to Goldman Sachs as of, the date of such Confidential Information and Goldman Sachs assumes no responsibility for updating or revising the Confidential Information based on circumstances, developments or events occurring after such date. The Confidential Information does not constitute any opinion, nor does the Confidential Information constitute a recommendation to the Special Committee, any security holder of the Company or any other person as to how to vote or act with respect to any transaction or any other matter. The Confidential Information, including this disclaimer, is subject to, and governed by, any written agreement between the Company, the Board and/or any committee thereof, on the one hand, and Goldman Sachs, on the other hand. 2
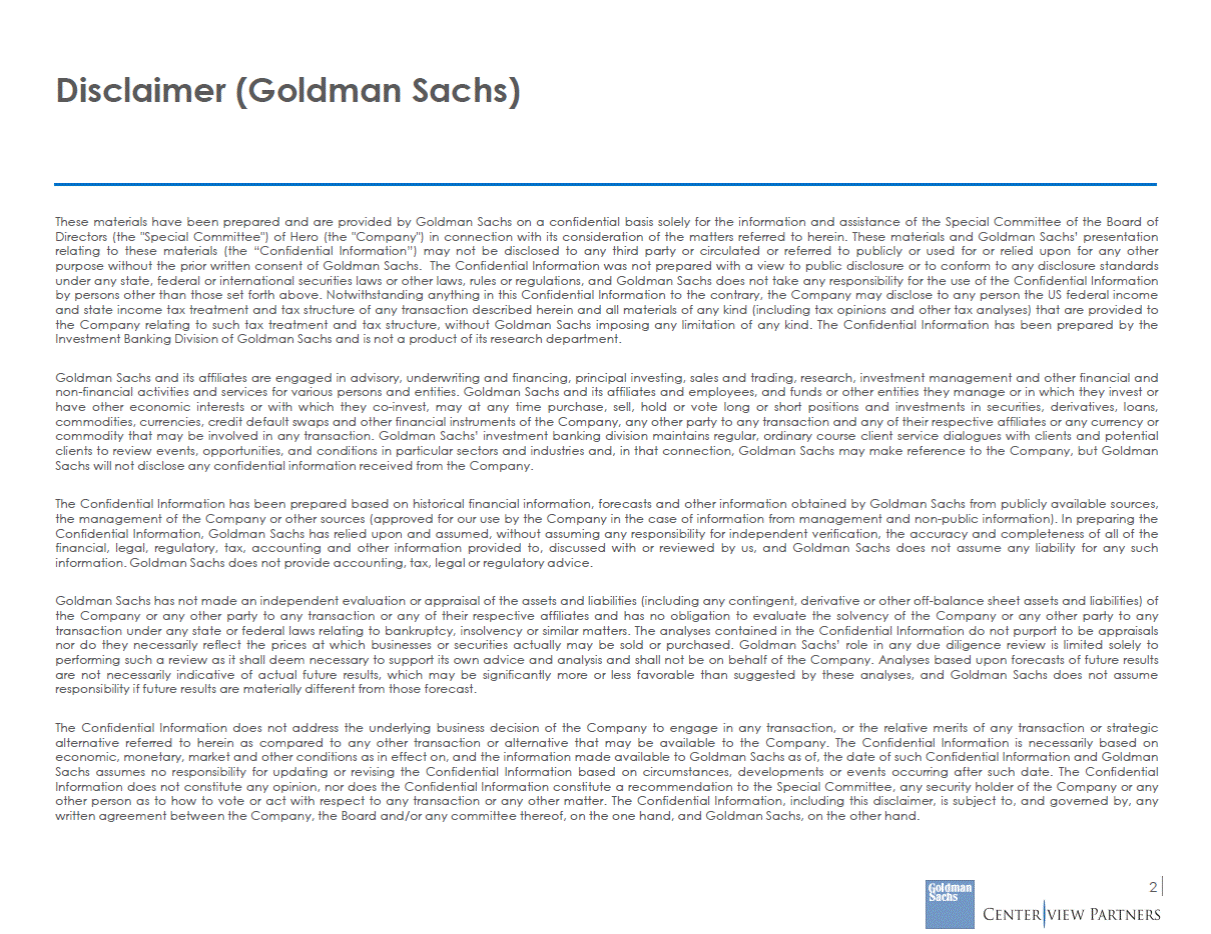
Overview of Lion’s Proposals Lion verbally delivered a revised proposal for a 1.600x exchange ratio on June 9th Previous Offer (Rcv'd June 1) Current Offer (Rcv'd June 9) Pricing Date Metric Jun 01 Jun 12 Diluted Shares Outstanding Equity Value Enterprise Value 53.6 $2,286 $2,767 53.6 $2,077 $2,558 Current 27.3% 20.0% 90-Day VWAP 16.9% 7.0% Source: Public filings and Hero Management as of June 12, 2017. (1) Hero ownership represents non-Queen shareholders ownership only. Ownership based on currently available public information. Figures subject to change as more information regarding GCI-Lion transaction becomes available. Reflects all Hero shareholders’ share of $125mm run-rate synergies capitalized at blended 2017E Comparable EV/EBITDA multiple of 8.7x, net of fees. Consensus consolidated Comparable EBITDA based on average Adjusted EBITDA estimates of BAML, Craig Hallum, FBR, Maxim, UBS and Wunderlich less estimated stock-based compensation expense. (2) 3 (3) Implied Valuation (Consensus) (3) 2017E Revenue $3,520 0.8x 0.7x 2017E Comp. EBITDA $267 10.5x 9.6x 2017E Adj. EPS $2.45 17.4x 15.8x Ownership and Value Sharing Ownership of Non-Q Hero S/H(1) 11.4% 10.5% Share of Value Creation to All Hero S/H(2) 59.5% 46.6% 30-Day VWAP 19.8% 12.4% Premiums Share Price Movement Hero Share Price $33.50 $32.30 Queen Share Price $24.36 $24.23 Exchange Ratio 1.38x 1.33x Since June 1 Offer (0.04x) Since June 1 Offer (0.5%) Since June 1 Offer (3.6%) Exchange Ratio 1.750x 1.600x Implied Offer Price $42.63 $38.77
Analysis at Various Exchange Ratios Based on current share prices of $32.30 for Hero and $24.23 for Queen Series A Exchange Ratio 1.500x 1.550x 1.600x 1.650x 1.700x 1.750x Implied Offer Price $36.35 $37.56 $38.77 $39.98 $41.19 $42.40 Diluted Shares Outstanding 53.6 53.6 53.6 53.6 53.6 53.6 Current 12.5% 16.3% 20.0% 23.8% 27.5% 31.3% 90-Day VWAP 0.3% 3.6% 7.0% 10.3% 13.7% 17.0% Share of Value Creation to All Hero S/H(2) 34.6% 40.6% 46.6% 52.6% 58.5% 64.4% 2017E Comp. EBITDA 9.1x 9.3x 9.6x 9.8x 10.1x 10.3x Source: Public filings and Hero Management as of June 12, 2017. (1) Hero ownership represents non-Queen shareholders ownership only. Ownership based on currently available public information. Figures subject to change as more information regarding GCI-Lion transaction becomes available. Reflects all Hero shareholders’ share of $125mm run-rate synergies capitalized at blended 2017E Comparable EV/EBITDA multiple of 8.7x, net of fees. Consensus consolidated Comparable EBITDA based on average Adjusted EBITDA estimates of BAML, Craig Hallum, FBR, Maxim, UBS and Wunderlich less estimated stock-based compensation expense. (2) 4 (3) 2017E Adj. EPS 14.8x 15.3x 15.8x 16.3x 16.8x 17.3x 2017E Revenue 0.7x 0.7x 0.7x 0.7x 0.8x 0.8x Implied Valuation (Consensus) (3) Ownership of Non-Q Hero S/H(1) 9.9% 10.2% 10.5% 10.8% 11.1% 11.4% Ownership and Value Sharing 30-Day VWAP 5.3% 8.9% 12.4% 15.9% 19.4% 22.9% Premiums Equity Value $1,947 $2,012 $2,077 $2,143 $2,208 $2,274 Enterprise Value $2,427 $2,492 $2,558 $2,623 $2,689 $2,754
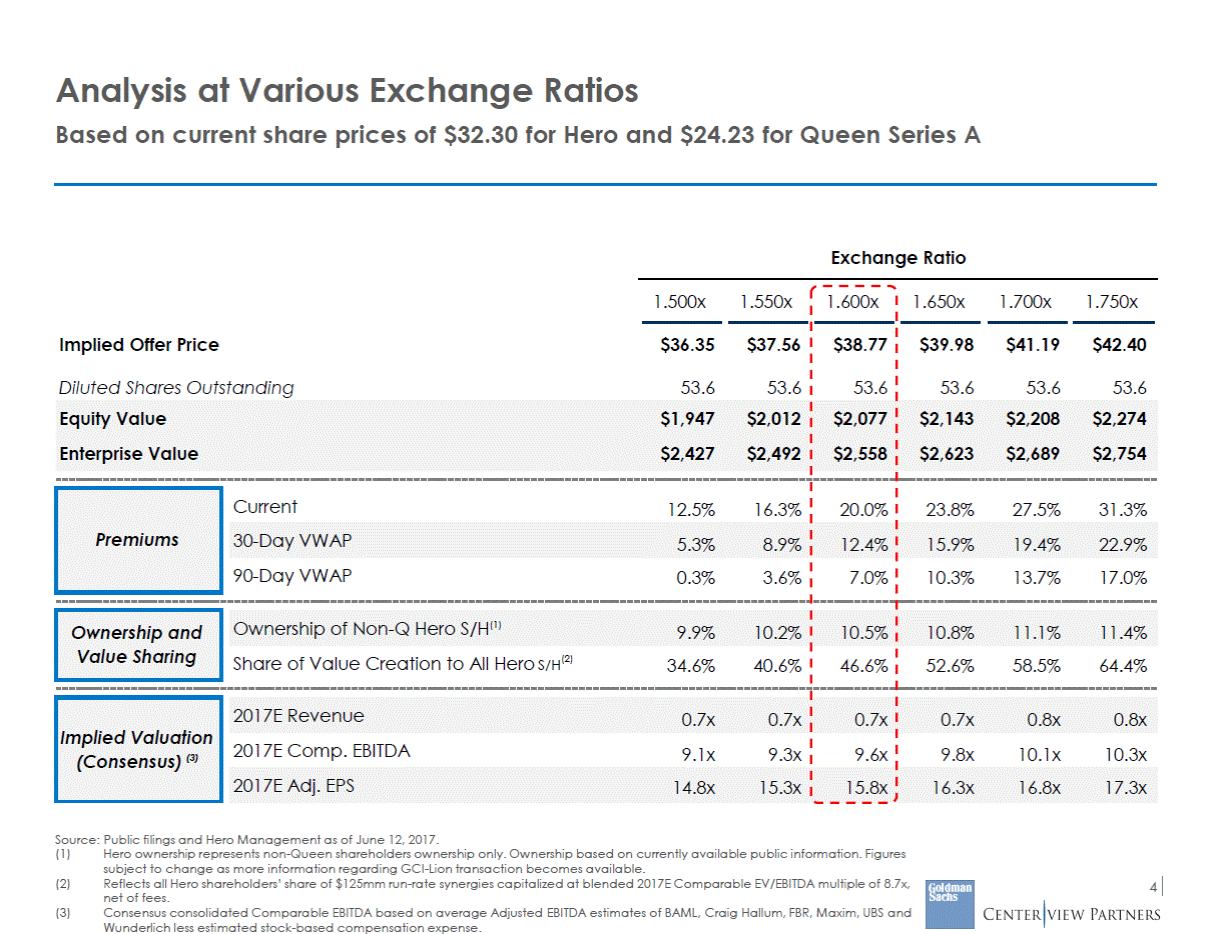
Illustrative Has / Gets Analysis and Value Creation Split Key Assumptions: —Based on 1.600x exchange ratio offer, implying an offer price of $38.77 as of June 12 —$125mm Synergies = $1,041mm value (capitalized at blended multiple, less $50mm illustrative fees) Hero Queen Pro Forma Per Share Aggregate Per Share Aggregate (Less): Net Debt & NCI (481) (5,791) Has (Less): Queen Stake in Hero – (647) Implied Ownership Implied Exchange Ratio 14.2% 1.33x 85.8% 1.00x Implied Equity Value Implied Ownership $2,040 16.8% $22.14 $10,134 83.2% $12,175 Gets Plus: Share of Capitalized Synergies(2) $3.26 $175 $1.89 $867 $1,041 Implied Prem. / (Disc.) After Synergies (1) 28.1% 5.3% Share of Value Creation 46.6% 53.4% Source: Public filings, Hero Management, Factset as of as of June 12, 2017. 5 Note: (1) (2) Dollars in millions, except per share data. Based on economic ownership. Represents share of pro forma equity value divided by standalone equity value minus 1. Capitalized at blended 2017E Comparable EV/EBITDA multiple of 8.7x. Value Creation $485 $556 $1,041 Value per Share w/ Synergies $41.36 $2,215 $24.03 $11,001 Implied Prem. / (Disc.) Before Synergies (1) 18.0% (8.6%) Targeted Exchange Ratio 1.600x 1.000x Adjusted Equity Value $1,730 $10,445 $12,175 Observed Market Equity Value $32.30 $1,730 $24.23 $11,091 $12,821 Enterprise Value $2,210 $16,883 $19,093
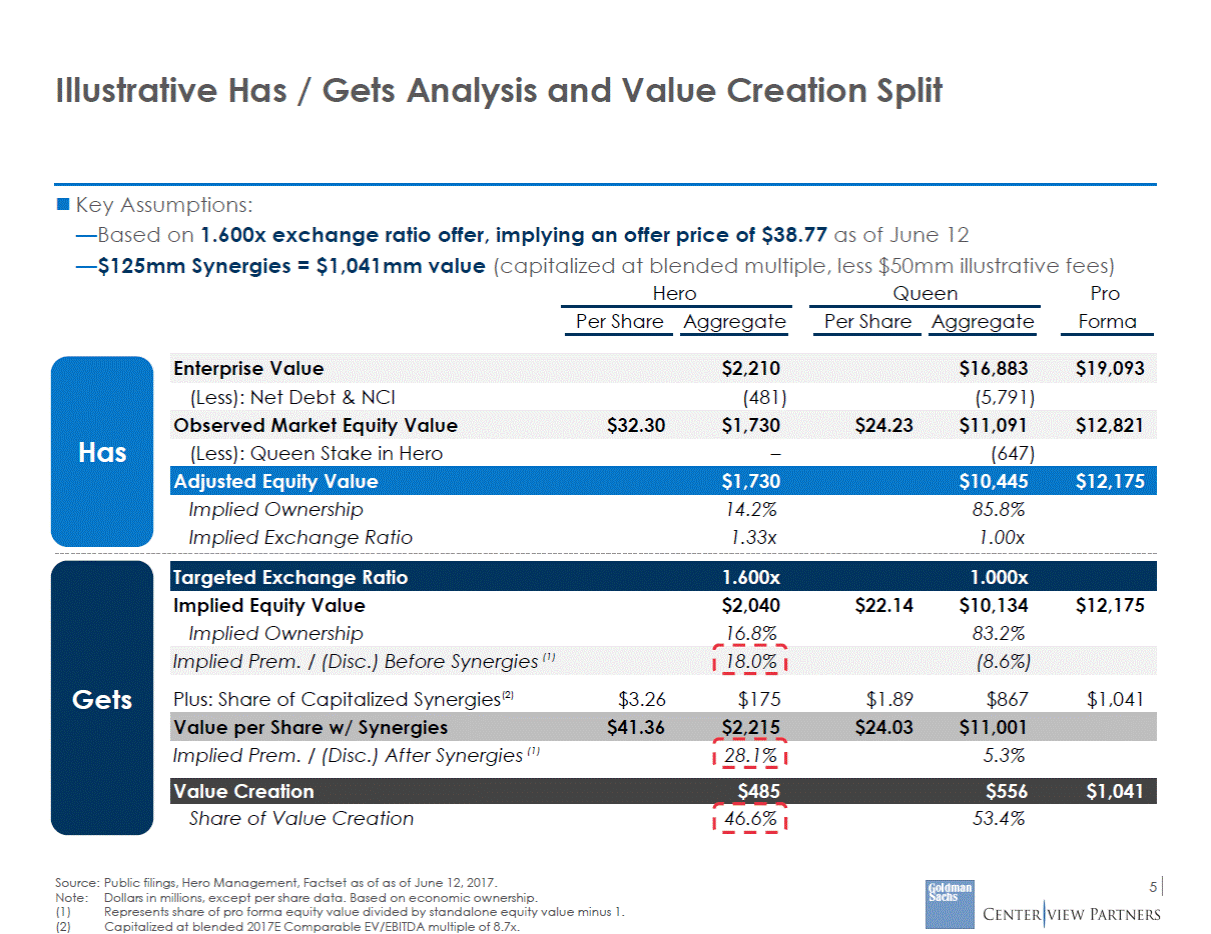
Illustrative Has / Gets Analysis and Value Creation Split Sensitivity At various headline premiums and synergy values; assumes Hero/Queen both trading at intrinsic value Hero Shareholders (Including Queen) Share of Value Creation Run-rate Synergies Blended Multiple (1) Net Capitalized Synergies(2) $86 8.7x $700 $125 8.7x $1,041 $150 8.7x $1,259 Exchange Ratio Implied Offer Price Headline Premium Implied Ownership Hero Pro Forma Share of Value Creation From prior page Current Offer Source: Public filings, Hero Management, Factset as of as of June 12, 2017. 6 Note: (1) (2) Dollars in millions, except per share data. Capitalized at blended 2017E Comparable EV/EBITDA multiple of 8.7x. Net of $50mm of illustrative transaction fees. 1.333x $32.30 – 14.2% 14%14%14% 1.500x 36.35 12.5% 15.8% 44%35%31% 1.550x 37.56 16.3% 16.3% 52%41%36% 1.600x 38.77 20.0% 16.8% 61%47%41% 1.650x 39.98 23.8% 17.2% 70%53%46% 1.700x 41.19 27.5% 17.7% 78%59%51% 1.750x 42.40 31.3% 18.2% 87%64%56%
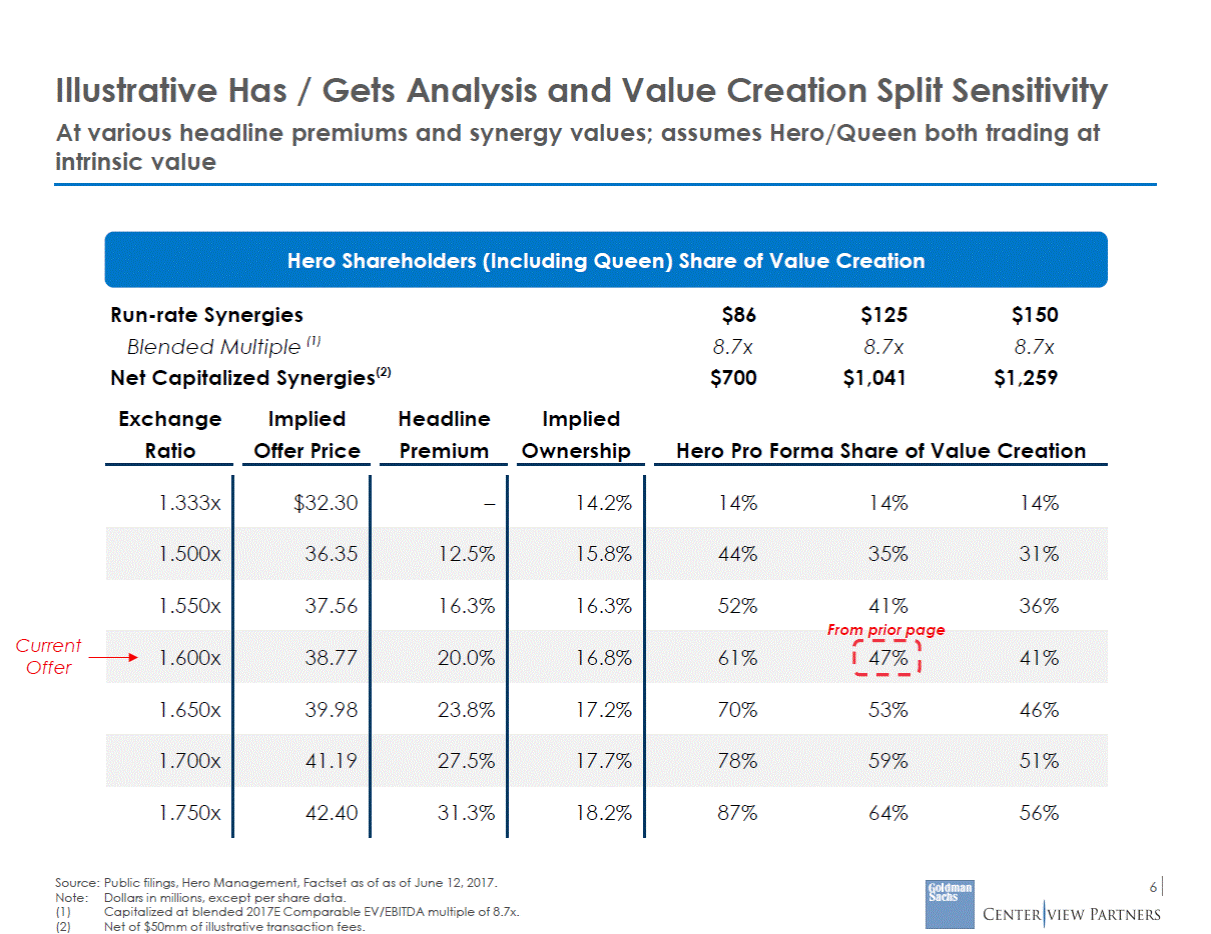
Illustrative Exchange Ratio Over Time Exchange ratio has become more favorable to Queen in wake of Hero’s performance and resignation of CEO, and Queen’s announcement of GCI-Lion transaction Exchange Ratio Analysis 3.05 x um ce 2.85 x 2.65 x 2.45 x 2.25 x 2.05 x 1.85 x Current Offer: 1.60x 1.65 x 1.45 x 1.33 x 1.25 x Jun-2015 Sep-2015 Dec-2015 Mar-2016 Jun-2016 Sep-2016 Dec-2016 Mar-2017 Jun-2017 7 Source: Company filings, Bloomberg as of Jun 12, 2017 (1) Exchange ratio defined Hero share price divided by Queen Series A share price. Share Price Exchange Implied Premi Queen Hero Ratio¹ to Current Pri Current $ 24.23 $ 32.30 1.33 x 0 % 1 Month Avg. 23.74 33.65 1.42 x 6 % 3 Month Avg. 21.69 35.61 1.66 x 24 % 6 Month Avg. 20.63 35.57 1.74 x 30 % 1 Year Avg. 21.25 39.31 1.85 x 39 % 2 Year Avg. 24.00 47.76 1.97 x 48 % Favorable for Hero 2Y Average = 1.97 x 1Y Average = 1.85 x Favorable for Queen
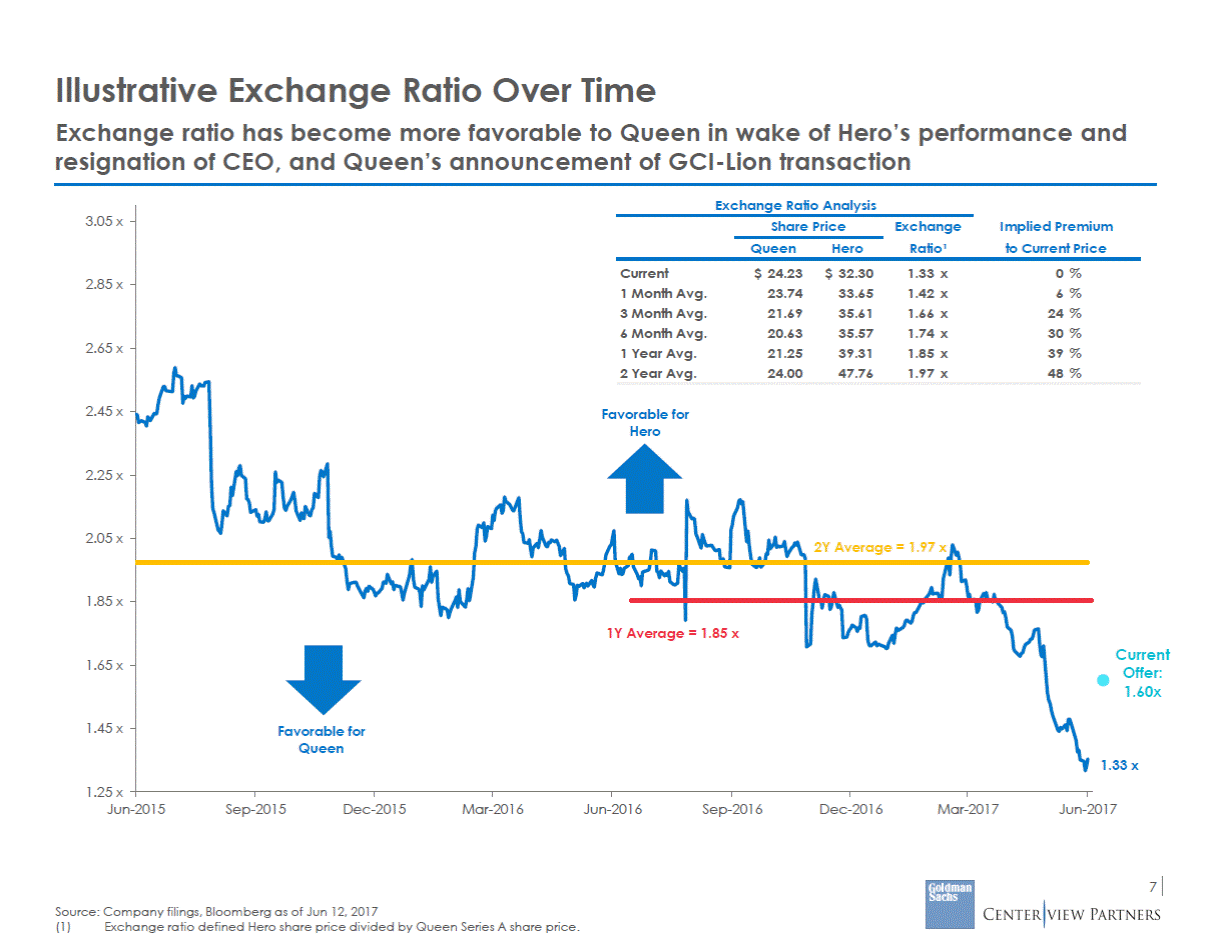
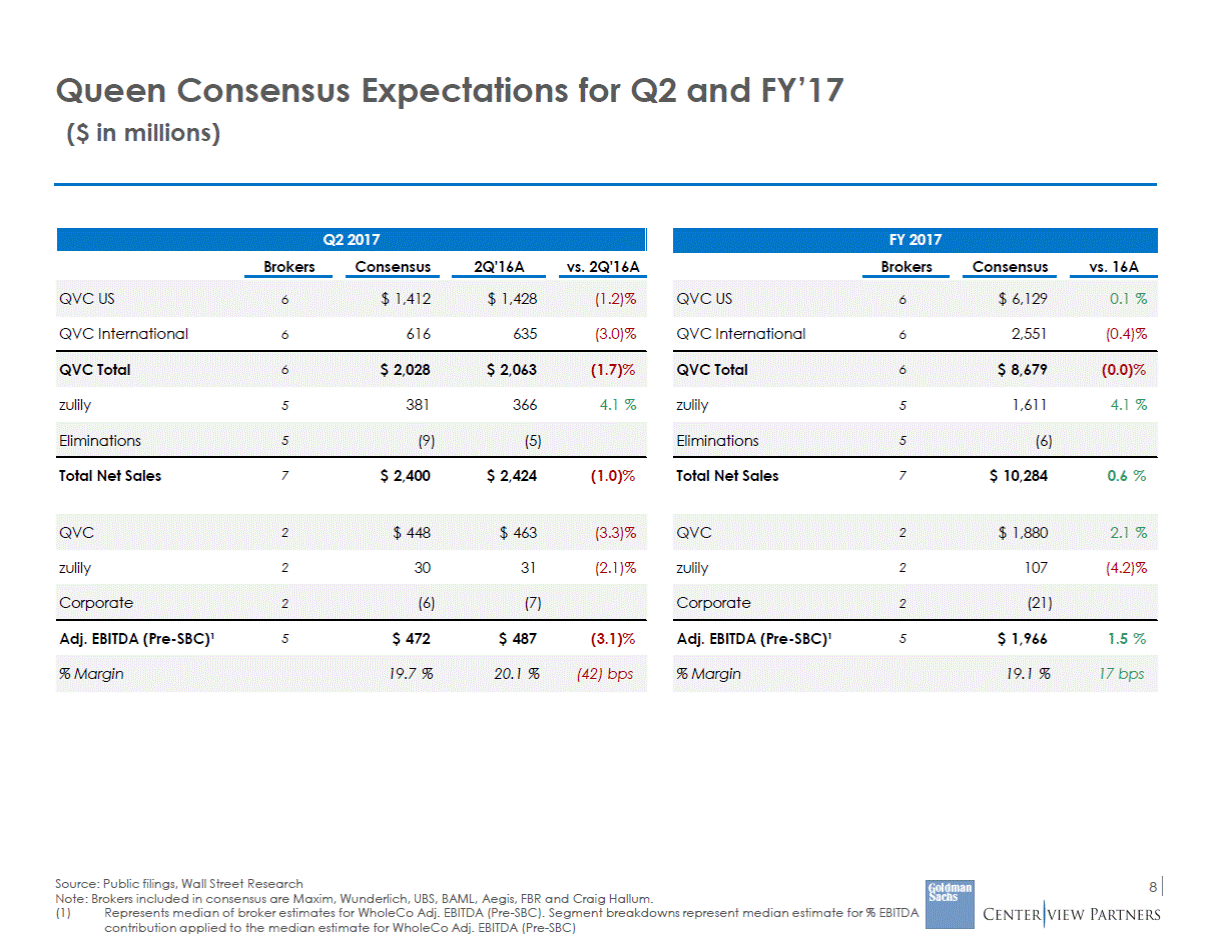
Queen Consensus Expectations for Q2 and FY’17 ($ in millions) Brokers Consensus 2Q'16A vs. 2Q'16A Brokers Consensus vs. 16A QVC International 616 635 (3.0)% QVC International 2,551 (0.4)% 6 6 zulily 5 381 366 4.1 % zulily 5 1,611 4.1 % Total Net Sales 7 $ 2,400 $ 2,424 (1.0)% Total Net Sales 7 $ 10,284 0.6 % zulily 30 31 (2.1)% zulily 107 (4.2)% 2 2 Adj. EBITDA (Pre-SBC)¹ $ 472 $ 487 (3.1)% Adj. EBITDA (Pre-SBC)¹ $ 1,966 1.5 % 5 5 Source: Public filings, Wall Street Research Note: Brokers included in consensus are Maxim, Wunderlich, UBS, BAML, Aegis, FBR and Craig Hallum. 8 (1) Represents median of broker estimates for WholeCo Adj. EBITDA (Pre-SBC). Segment breakdowns represent median estimate for % EBITDA contribution applied to the median estimate for WholeCo Adj. EBITDA (Pre-SBC) % Margin19.1 %17 bps % Margin19.7 %20.1 %(42) bps Corporate2 (21) Corporate2 (6)(7) QVC2 $ 1,8802.1 % QVC2 $ 448$ 463(3.3)% Eliminations5 (6) Eliminations5 (9)(5) QVC Total6 $ 8,679(0.0)% QVC Total6 $ 2,028$ 2,063(1.7)% QVC US6 $ 6,1290.1 % QVC US6 $ 1,412$ 1,428(1.2)% FY 2017 Q2 2017
Lion Options In the Event of Unsuccessful Negotiation Between Hero and Queen Lion could publicly announce its offer in an effort to pressure Hero to reengage Lion could run for a full or partial slate of director nominees at the 2018 annual meeting next May —The nomination window is January 25th to February 24th —Lion could not call a special meeting of shareholders ahead of that time —Even if Lion succeeded in a proxy contest, any transaction between Hero and Lion would ultimately require the approval of the Qualified Directors (i.e. generally excluding directors nominated by Lion) —Lion is prohibited by the Spinco Agreement from buying any additional Hero shares Lion could withdraw for now, maintaining the right to make a new proposal (public or private) in the future 9
Appendix A: Hero “Current” and “Trend” Forecast vs. Consensus
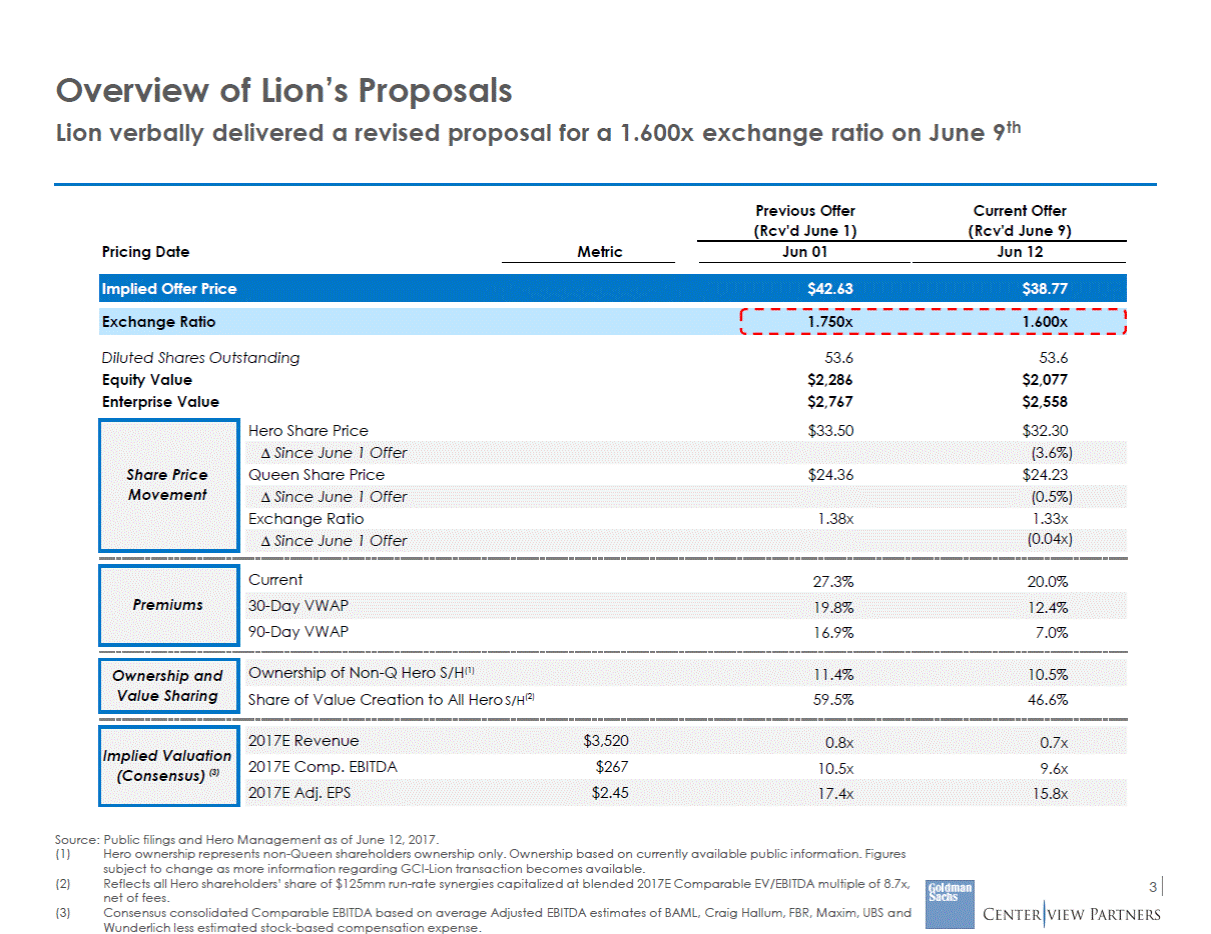
FY’17E Current Forecast and Trend versus Consensus If Hero achieves “Current” scenario, it will perform approximately in-line with consensus for 2017 If Hero achieves “Trend” scenario, it will be below consensus for 2017, missing net sales by ~2% and EBITDA by ~11% "Current" vs. Consensus "Trend" vs. Consensus $ Fav. / (Unfav.) % Fav. / (Unfav.) $ Fav. / (Unfav.) % Fav. / (Unfav.) Consensus(1) "Current" "Trend" Cornerstone 1,064 1,085 20 1.9% 1,085 20 1.9% % YoY Growth (1.3%) (1.5%) (12 bps) (3.3%) (196 bps) Cornerstone 35 48 13 37.7% 48 13 37.7% % of Revenue % YoY Growth 8.1% (4.4%) 8.1% (5.3%) (6 bps) (87 bps) 7.4% (15.0%) (75 bps) (1,060 bps) Source: Hero Management and Factset as of June 9, 2017. Note:Dollars in millions. Adjusted EBITDA is before deduction of stock based compensation expense. 11 (1) Hero consensus revenue based on Factset consensus. Consensus consolidated Adj. EBITDA based on average estimates of BAML, Craig Hallum, FBR, Maxim, UBS and Wunderlich. Segment Adj. EBITDA figures based on percentage allocation of EBITDA based on average of select Wall Street research reports where segment estimates are provided. Adj. EBITDA$286$283($3)(0.9%)$254($32)(11.1%) HSN$251$235($16)(6.3%)$206($45)(17.9%) Net Sales$3,520$3,515($4)(0.1%)$3,450($70)(2.0%) HSN$2,455$2,432($23)(0.9%)$2,366($89)(3.6%)
