--CONFIDENTIAL --Disclaimer (Centerview Partners) This presentation has been prepared by Centerview Partners LLC (“Centerview”) for use solely by the Special Committee of the Board of Directors of HSN, Inc. (“Hero” or the “Company”) in connection with its evaluation of a proposed transaction involving the Company and for no other purpose. The information contained herein is based upon information supplied by Hero and publicly available information, and portions of the information contained herein may be based upon statements, estimates and forecasts provided by the Company. Centerview has relied upon the accuracy and completeness of the foregoing information, and have not assumed any responsibility for any independent verification of such information or for any independent evaluation or appraisal of any of the assets or liabilities (contingent or otherwise) of the Company or any other entity, or concerning the solvency or fair value of the Company or any other entity. With respect to financial forecasts, including with respect to estimates of potential synergies, Centerview has assumed that such forecasts have been reasonably prepared on bases reflecting the best currently available estimates and judgments of the management of the Company as to its financial performances, and at your direction Centerview has relied upon such forecasts, as provided by the Company’s management, with respect to the Company, including as to expected synergies. Centerview assumes no responsibility for and expresses no view as to such forecasts or the assumptions on which they are based. The information set forth herein is based upon economic, monetary, market and other conditions as in effect on, and the information made available to us as of, the date hereof, unless indicated otherwise and Centerview assumes no obligation to update or otherwise revise these materials. The financial analysis in this presentation is complex and is not necessarily susceptible to a partial analysis or summary description. In performing this financial analysis, Centerview has considered the results of its analysis as a whole and did not necessarily attribute a particular weight to any particular portion of the analysis considered. Furthermore, selecting any portion of Centerview’s analysis, without considering the analysis as a whole, would create an incomplete view of the process underlying its financial analysis. Centerview may have deemed various assumptions more or less probable than other assumptions, so the reference ranges resulting from any particular portion of the analysis described above should not be taken to be Centerview’s view of the actual value of the Company. Subject to the last sentence of this paragraph, Centerview explicitly disclaims responsibility for any advice, work product or analysis contained herein prepared by Goldman Sachs & Co. LLC., including any slides, or analyses within slides, labeled “Goldman Sachs Perspective” or “Goldman Sachs.” The foregoing provision shall not be construed in any way to limit Centerview’s responsibility for any of its work product included in any materials jointly prepared by Centerview and Goldman Sachs & Co. LLC. These materials and the information contained herein are confidential, were not prepared with a view toward public disclosure, and may not be disclosed publicly or made available to third parties without the prior written consent of Centerview. These materials and any other advice, written or oral, rendered by Centerview are intended solely for the benefit and use of the Special Committee of the Board of Directors of the Company (in its capacity as such) in its consideration of the proposed transaction, and are not for the benefit of, and do not convey any rights or remedies for any holder of securities of the Company or any other person. Centerview will not be responsible for and has not provided any tax, accounting, actuarial, legal or other specialist advice. These materials are not intended to provide the sole basis for evaluating the proposed transaction, and this presentation does not represent a fairness opinion, recommendation, valuation or opinion of any kind, and is necessarily incomplete and should be viewed solely in conjunction with the oral presentation provided by Centerview. 1
--CONFIDENTIAL --Disclaimer (Goldman Sachs) These materials have been prepared and are provided by Goldman Sachs on a confidential basis solely for the information and assistance of the Special Committee of the Board of Directors (the "Special Committee") of Hero (the "Company") in connection with its consideration of the matters referred to herein. These materials and Goldman Sachs’ presentation relating to these materials (the “Confidential Information”) may not be disclosed to any third party or circulated or referred to publicly or used for or relied upon for any other purpose without the prior written consent of Goldman Sachs. The Confidential Information was not prepared with a view to public disclosure or to conform to any disclosure standards under any state, federal or international securities laws or other laws, rules or regulations, and Goldman Sachs does not take any responsibility for the use of the Confidential Information by persons other than those set forth above. Notwithstanding anything in this Confidential Information to the contrary, the Company may disclose to any person the US federal income and state income tax treatment and tax structure of any transaction described herein and all materials of any kind (including tax opinions and other tax analyses) that are provided to the Company relating to such tax treatment and tax structure, without Goldman Sachs imposing any limitation of any kind. The Confidential Information has been prepared by the Investment Banking Division of Goldman Sachs and is not a product of its research department. Goldman Sachs and its affiliates are engaged in advisory, underwriting and financing, principal investing, sales and trading, research, investment management and other financial and non-financial activities and services for various persons and entities. Goldman Sachs and its affiliates and employees, and funds or other entities they manage or in which they invest or have other economic interests or with which they co-invest, may at any time purchase, sell, hold or vote long or short positions and investments in securities, derivatives, loans, commodities, currencies, credit default swaps and other financial instruments of the Company, any other party to any transaction and any of their respective affiliates or any currency or commodity that may be involved in any transaction. Goldman Sachs’ investment banking division maintains regular, ordinary course client service dialogues with clients and potential clients to review events, opportunities, and conditions in particular sectors and industries and, in that connection, Goldman Sachs may make reference to the Company, but Goldman Sachs will not disclose any confidential information received from the Company. The Confidential Information has been prepared based on historical financial information, forecasts and other information obtained by Goldman Sachs from publicly available sources, the management of the Company or other sources (approved for our use by the Company in the case of information from management and non-public information). In preparing the Confidential Information, Goldman Sachs has relied upon and assumed, without assuming any responsibility for independent verification, the accuracy and completeness of all of the financial, legal, regulatory, tax, accounting and other information provided to, discussed with or reviewed by us, and Goldman Sachs does not assume any liability for any such information. Goldman Sachs does not provide accounting, tax, legal or regulatory advice. Goldman Sachs has not made an independent evaluation or appraisal of the assets and liabilities (including any contingent, derivative or other off-balance sheet assets and liabilities) of the Company or any other party to any transaction or any of their respective affiliates and has no obligation to evaluate the solvency of the Company or any other party to any transaction under any state or federal laws relating to bankruptcy, insolvency or similar matters. The analyses contained in the Confidential Information do not purport to be appraisals nor do they necessarily reflect the prices at which businesses or securities actually may be sold or purchased. Goldman Sachs’ role in any due diligence review is limited solely to performing such a review as it shall deem necessary to support its own advice and analysis and shall not be on behalf of the Company. Analyses based upon forecasts of future results are not necessarily indicative of actual future results, which may be significantly more or less favorable than suggested by these analyses, and Goldman Sachs does not assume responsibility if future results are materially different from those forecast. Goldman Sachs did not prepare, and does not assume responsibility for, any analyses conducted solely by Centerview Partners LLC, including any slides, or analyses within slides, labeled “Centerview Perspective,” “Centerview Partners” or “Centerview.” The Confidential Information does not address the underlying business decision of the Company to engage in any transaction, or the relative merits of any transaction or strategic alternative referred to herein as compared to any other transaction or alternative that may be available to the Company. The Confidential Information is necessarily based on economic, monetary, market and other conditions as in effect on, and the information made available to Goldman Sachs as of, the date of such Confidential Information and Goldman Sachs assumes no responsibility for updating or revising the Confidential Information based on circumstances, developments or events occurring after such date. The Confidential Information does not constitute any opinion, nor does the Confidential Information constitute a recommendation to the Special Committee, any security holder of the Company or any other person as to how to vote or act with respect to any transaction or any other matter. The Confidential Information, including this disclaimer, is subject to, and governed by, any written agreement between the Company, the Board and/or any committee thereof, on the one hand, and Goldman Sachs, on the other hand. 2
--CONFIDENTIAL --Agenda Overview of Transaction 1 Overview of Financial Projections 2 Summary of Financial Analysis 3 Pro Forma Considerations 4 GCI-Lion Transaction Considerations 5 Financial Analysis Detail 6 Supplementary Reference Materials 3
Overview of Transaction Section 1
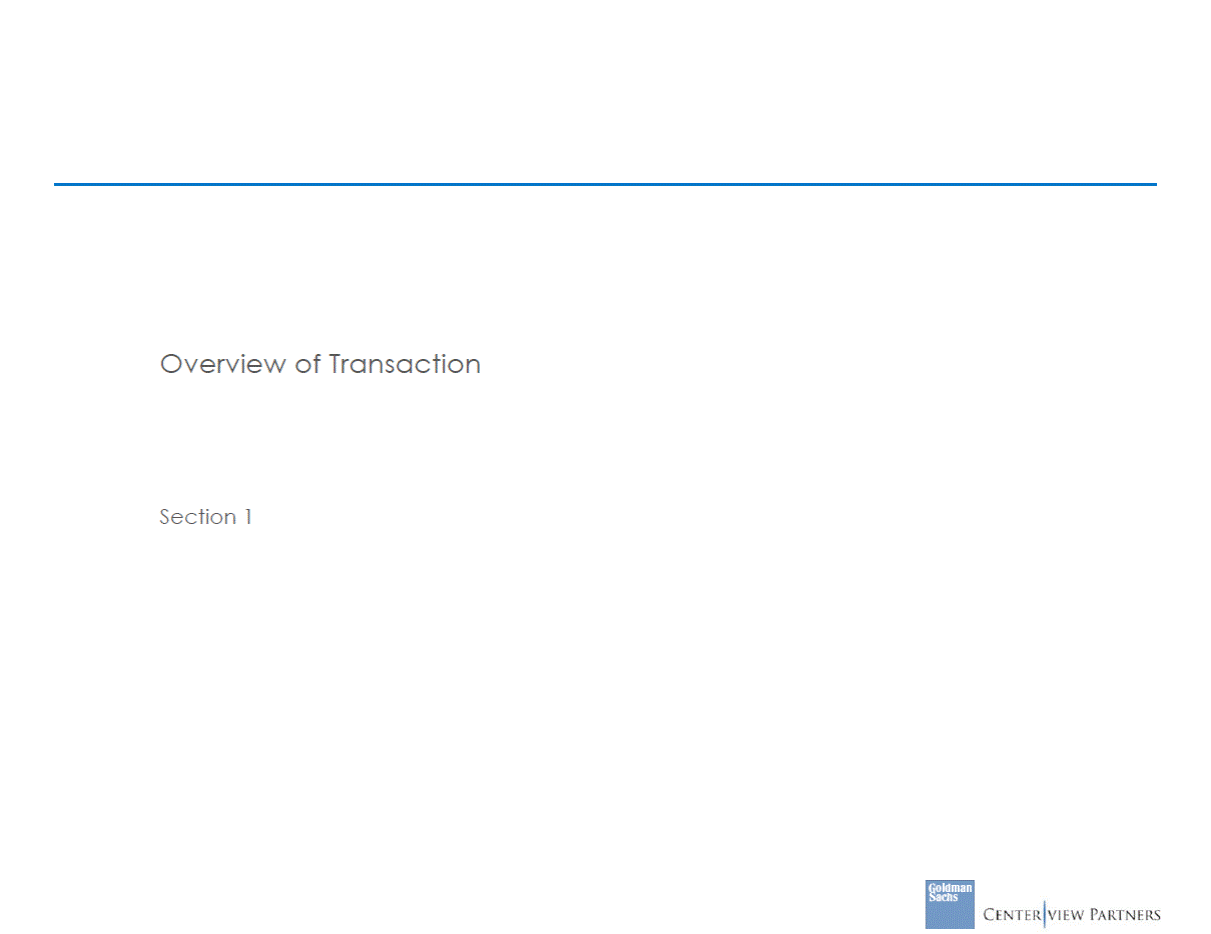
--CONFIDENTIAL --Overview of Lion’s Proposal Proposal Summary Proposal Statistics Hero Share Price $31.30 Implied Exchange Ratio 1.280x Current 28.9% Headline Equity Value $2,161 90-Day VWAP $35.19 14.7% Plus: Debt 529 52-Week Low (06/21/17) $30.95 30.4% Source: Public filings and Hero Management. Market data as of July 5, 2017. Note: (1) Dollars in millions. Balance sheet information as of March 31,2017. LTM metrics as of March 31, 2017. Hero ownership represents non-Queen shareholders’ ownership only. Hero share capitalization info per Hero Management as of June 29, 2017. Queen share capitalization info per Queen Management as of June 30, 2017. As of April 4, 2017, Mr. Malone had sole voting power over 27.2mm Class B shares of Queen (10 votes per share) and 0.4mm Class A shares (1 vote). Mr. Malone also had shared voting power over 0.5mm additional class B shares. Comparable EBITDA is after deduction of stock based compensation expense. Based on Hero Management’s 2017 outlook. (2) 5 (3) (4) Adj. EPS LTM Adj. EPS$2.4816.3x 2017E Adj. EPS(4)2.3517.2x Comparable EBITDA (3) LTM Comp. EBITDA$2699.8x 2017E Comp. EBITDA(4)26210.1x Economic Memo: John Malone(2) 5% Hero Shareholders (Non-Queen S/H)11% Voting Queen Shareholders93% Hero Shareholders (Non-Queen S/H)7% Memo: John Malone(2) 35% Queen Shareholders89% Revenue LTM Revenue$3,5360.75x 2017E Revenue(4)3,5150.75x Multiples Pro Forma Ownership(1) Headline Enterprise Value$2,642 52-Week High (07/12/16)$52.99(23.8%) (Less): Cash(48) 30-Day VWAP$32.6023.8% Premiums Diluted Shares Outstanding53.6 Implied Headline Offer Price$40.36 Queen Share Price$24.46 Exchange Ratio1.650x Current Share Prices
Overview of Financial Projections Section 2
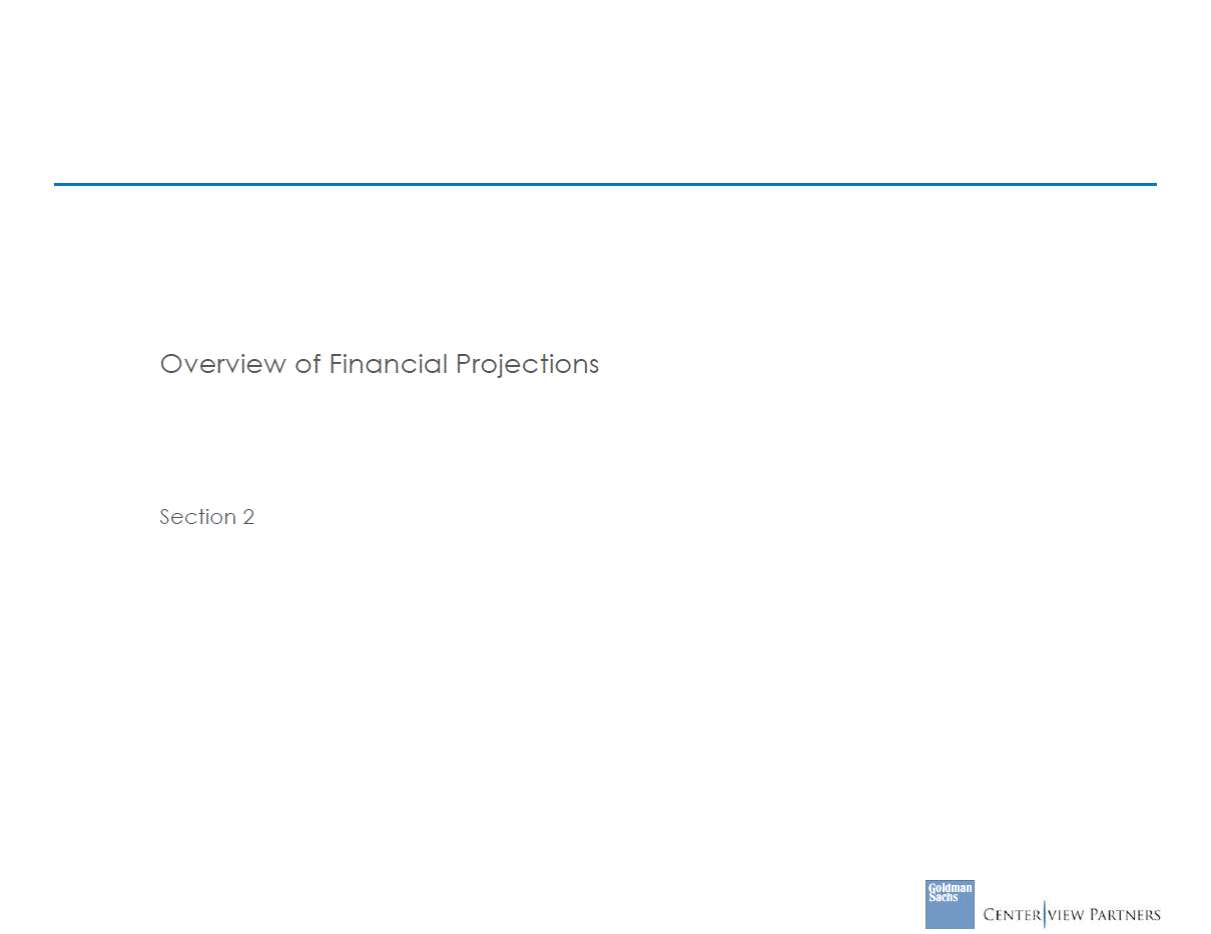
--CONFIDENTIAL --Hero Management’s 2Q Outlook Hero Management currently expecting to miss consensus EBITDA by ~8% $ Favorable / (Unfavorable) % Favorable / (Unfavorable) Consensus(1) Forecasted Cornerstone Revenue 285.9 294.7 8.8 3.1% % YoY Growth (2.7%) (4.1%) (1.4 pp) % Margin 35.9% 35.7% (14 bps) % Margin % YoY Growth 8.4% (15.4%) 7.8% (22.2%) (56 bps) (6.8 pp) (2.7 pp) % YoY Growth (20.3%) (23.0%) Source: Hero Management. Note: (1) Dollars in millions. Hero revenue and EPS represent Factset Consensus. All other consensus figures calculated as the average of: AEGIS Capital, BofA, Citi, Craig Hallum, FBR, Maxim, Sidoti, UBS and Wunderlich. Adjusted EBITDA is before deduction of stock based compensation expense. 7 (2) Adj. EPS$0.59$0.57($0.02)(3.4%) Adj. EBITDA(2) $69.7$64.1($5.6)(8.0%) Gross Profit$298.3$292.8($5.5)(1.8%) Total Revenue$831.6$819.5(12.1)(1.5%) HSN Revenue$545.4$525.2($20.2)(3.7%)
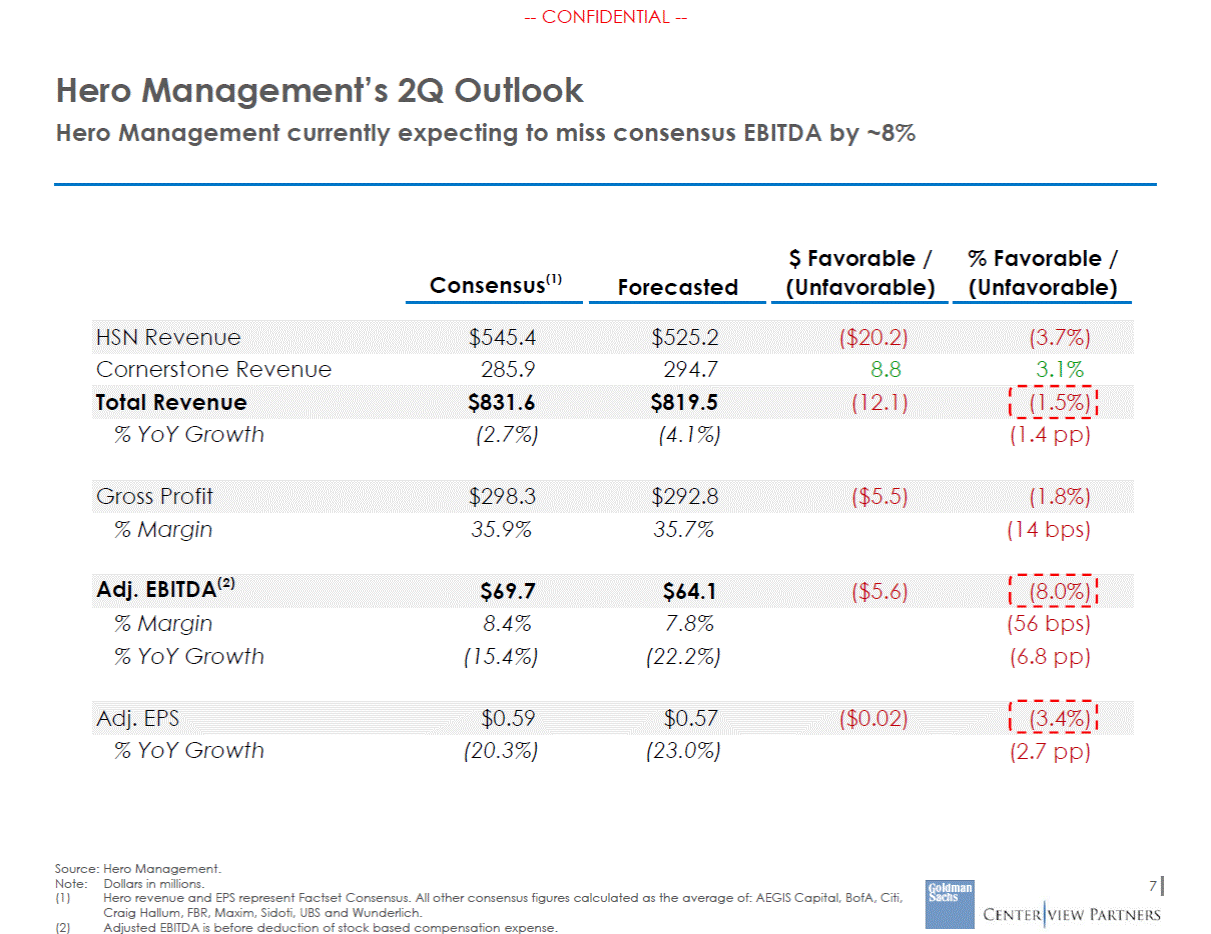
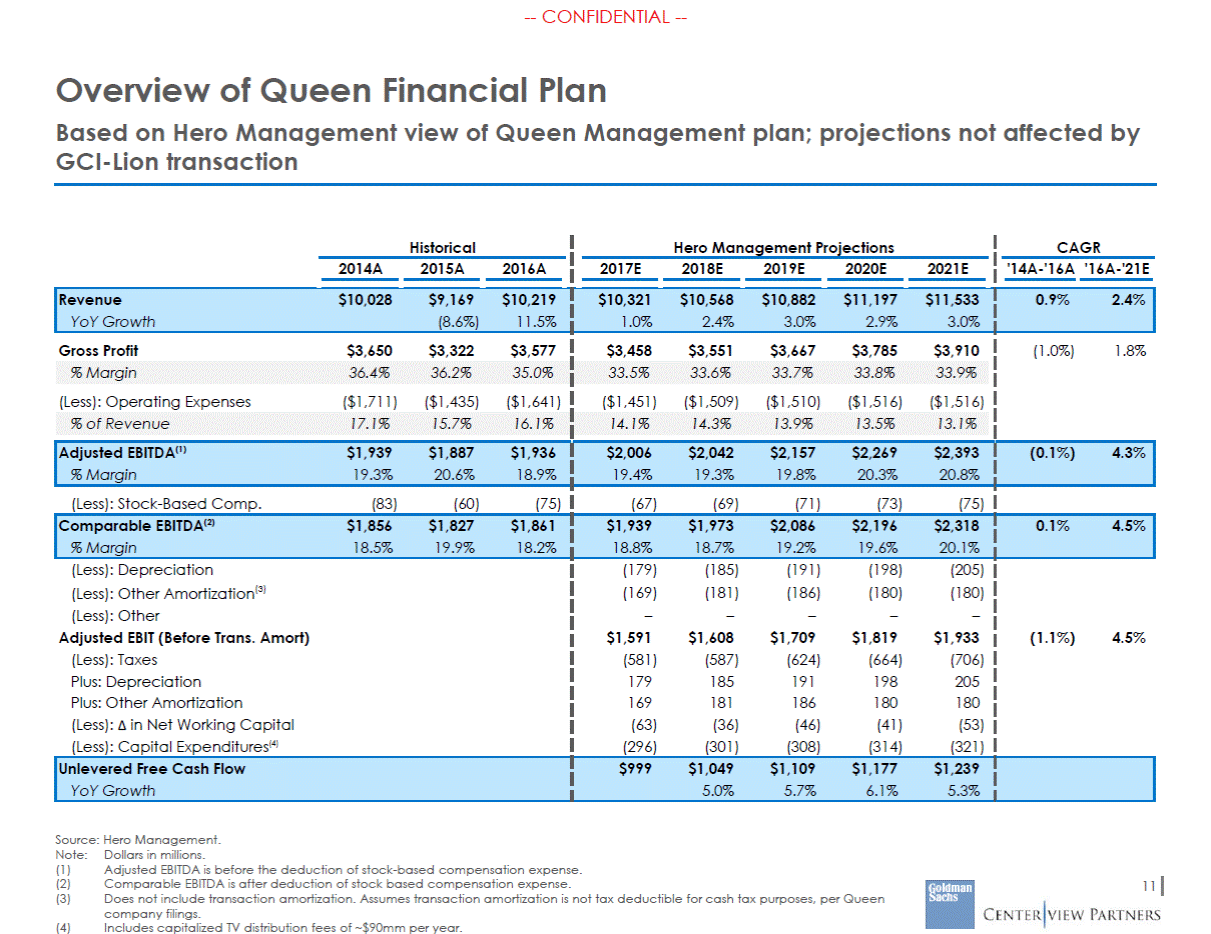
--CONFIDENTIAL --Queen Management’s 2Q Outlook Below does not include impact of recent distribution center outage expected to reduce revenue and EBITDA by $20-$25mm and $3-$5mm, respectively, in 2Q Queen expects to recover half of the revenue loss in 3Q, with the other half estimated to be non-recoverable Current 2Q17 Outlook(1) Outlook vs. Prior Year Outlook vs. Budget(2) Outlook vs. Consensus(3) Queen International 621 (2.1%) (2.1%) 0.7% zulily 367 0.2% (12.2%) (1.8%) Queen International 108 8.4% 2.7% 9.9% zulily 24 (23.2%) (31.7%) (16.0%) Source: Wall Street Research and Queen Management. Note: (1) (2) (3) Dollars in millions. Adjusted EBITDA is before the deduction of stock-based compensation expense. Current outlook based on USD figures as of June 20, 2017. Based on constant currency. Per Queen Management. 8 Total Queen Group$486(1.6%)(2.7%)1.5% Total Queen$462(0.2%)(0.6%)2.0% Queen U.S.$354(2.6%)(1.6%)(0.2%) Adjusted EBITDA Total Queen Group$2,375(2.2%)(3.8%)(1.2%) Total Queen$2,008(2.6%)(2.1%)(0.8%) Queen U.S.$1,387(2.9%)(2.1%)(1.5%) Revenue
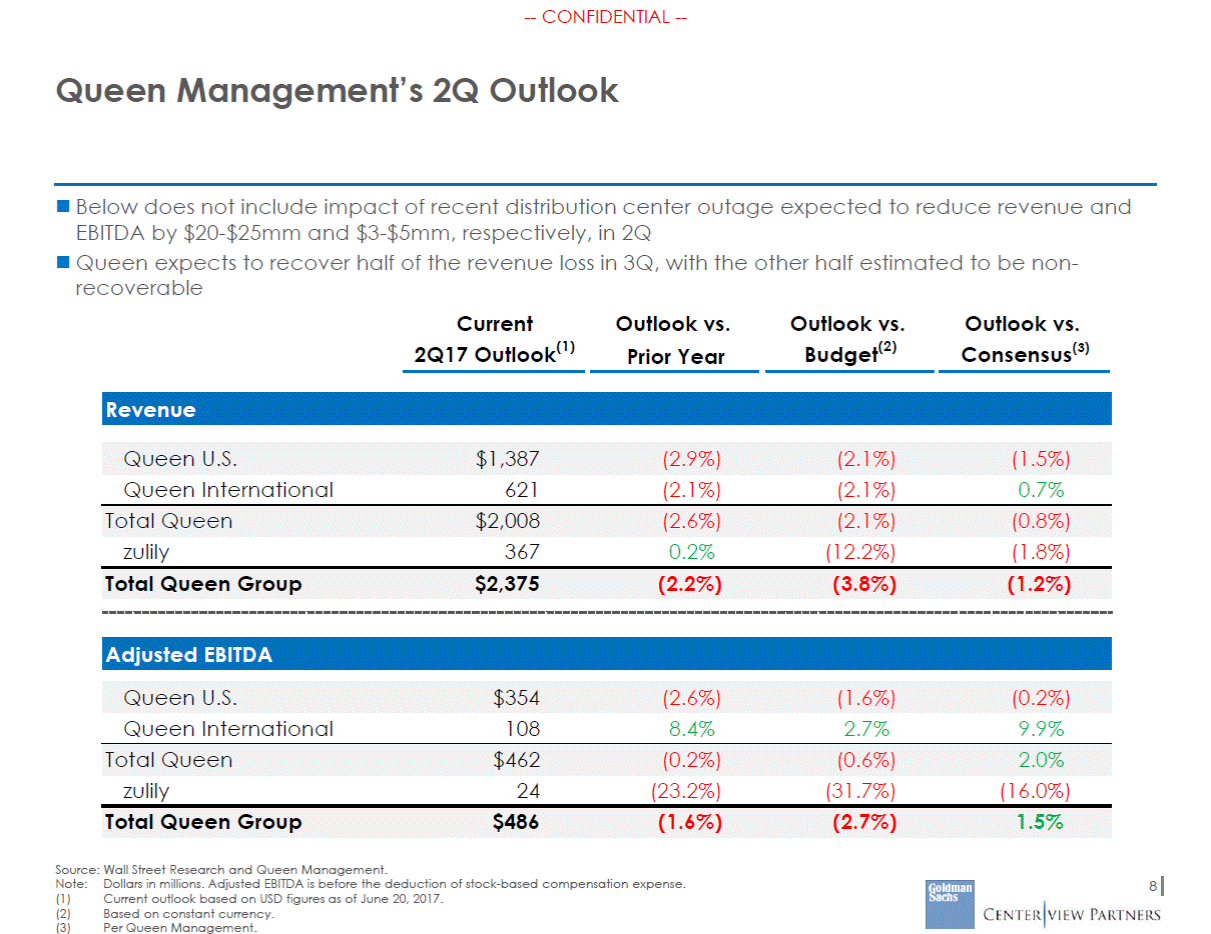
--CONFIDENTIAL --Overview of Hero Management’s 2017 Outlook Based on performance YTD, Hero Management has formulated an updated view of FY’17E Management’s Current Outlook for 2017 Current Outlook vs. Plan and Prior Year Net Sales of $3,515mm (down 1.5% vs. year ago and 3.3% vs. plan) EBITDA of $283mm (down $16mm vs. year ago and $20mm vs. plan) Overall assumptions consistent with the 2017 business outlook presented to the Board on May 24 with minor updates Updated for the latest 2Q outlook —Cornerstone EBITDA up $5mm for 2017, reflecting recent momentum —Includes $5mm of in-process operating expense cost savings This scenario assumes Hero gets to positive sales (+0.5% vs. year ago) on the HSN segment in the second half —Represents a trend change of more than +500bps vs. the first half '17F vs. '17P vs. '16A Cornerstone 1,085 (0.3%) (0.9%) Cornerstone 48 11.7% 19.6% % Margin 8.1% (29 bps) (32 bps) 9 Source: Hero Management. Note:Dollars in millions. (1) Adjusted EBITDA is before deduction of stock based compensation expense. Adj. EBITDA(1) $283 (6.7%) (5.3%) HSN $235 (9.7%) (9.1%) Net Sales $3,515 (3.3%) (1.5%) HSN $2,432 (4.6%) (1.7%)
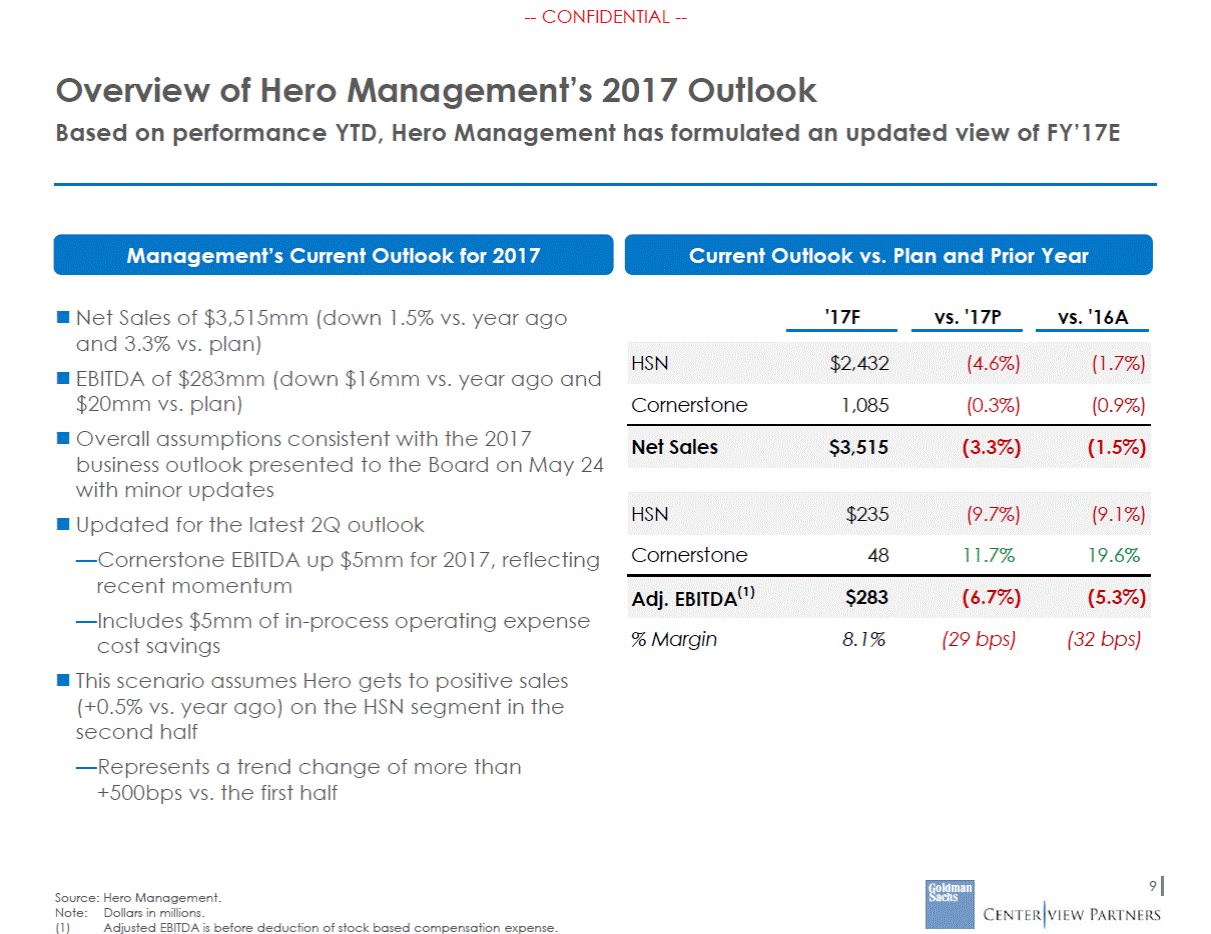
--CONFIDENTIAL --Overview of Hero Management Plan 2017 outlook updated to reflect trends in 1H17; plan beyond 2017 prepared by Hero Management in January 2017 Source: Hero Management. Note: Dollars in millions. Revenue and EBITDA historical figures are pro forma for divestitures of TravelSmith and Chasing Fireflies from Cornerstone. Adjusted EBITDA is before deduction of stock based compensation expense. Comparable EBITDA is after deduction of stock based compensation expense. 10 (1) (2) Historical 2014A2015A2016A HSN Revenue$2,476$2,542$2,475 Cornerstone Revenue1,1141,1511,095 (Less): Eliminations(2)(2)(2) Projections 2017F2018P2019P2020P2021P $2,432$2,626$2,704$2,785$2,869 1,0851,1621,2431,3161,390 (1)(1)(1)(1)(1) '14A -'16A'16A-'21P CAGRCAGR (0.0%)3.0% (0.9%)4.9% Total Revenue$3,588$3,691$3,567 YoY Growth2.9%(3.3%) $3,515$3,786$3,946$4,100$4,257 (1.5%)7.7%4.2%3.9%3.8% (0.3%)3.6% Gross Profit$1,273$1,315$1,217 $1,206$1,316$1,383$1,447$1,513 (2.2%)4.5% % Margin35.5%35.6%34.1% 34.3%34.8%35.0%35.3%35.5% (Less): Operating Expenses($931)($957)($918) ($923)($970)($1,006)($1,039)($1,072) % of Revenue25.9%25.9%25.7% 26.3%25.6%25.5%25.3%25.2% Adjusted EBITDA(1)$342$357$299 % Margin9.5%9.7%8.4% $283$346$377$408$441 8.1%9.1%9.5%9.9%10.4% (6.5%)8.1% (Less): SBC(16)(18)(19) (21)(22)(22)(23)(24) Comparable EBITDA(2)$327$339$280 % Margin9.1%9.2%7.8% $262$324$354$385$417 7.5%8.6%9.0%9.4%9.8% (7.4%)8.3% (Less): D&A / FA Sale(44)(44)(43) (Less): Adjustments2(11)(31) Reported EBIT$285$284$206 (Less): Net Interest(7) (15)(16) Pre-Tax Income$278$269$190 (Less): Taxes (105) (100)(71) Net Income$173$169$119 Plus: Adjustments0620 Adjusted Net Income$173$176$138 (47)(49)(52)(56)(59) ––––– $215$275$302$329$358 (14)(16)(16)(16)(17) $200$259$286$313$341 (75) (97) (107) (117) (128) $125$162$179$196$213 ––––– $125$162$179$196$213 (15.0%)11.7% (10.6%)9.1% Adjusted EPS$3.23$3.28$2.62 YoY Growth1.7%(20.3%) $2.35$3.03$3.34$3.66$3.99 (10.3%)29.1%10.3%9.4%9.1% (9.9%)8.8% Memo: Pro forma for divestitures of TravelSmith and Chasing Fireflies Revenue$3,475$3,591$3,524 Adjusted EBITDA340361304 $3,515$3,786$3,946$4,100$4,257 283346377408441 0.7%3.9% (5.5%)7.7%
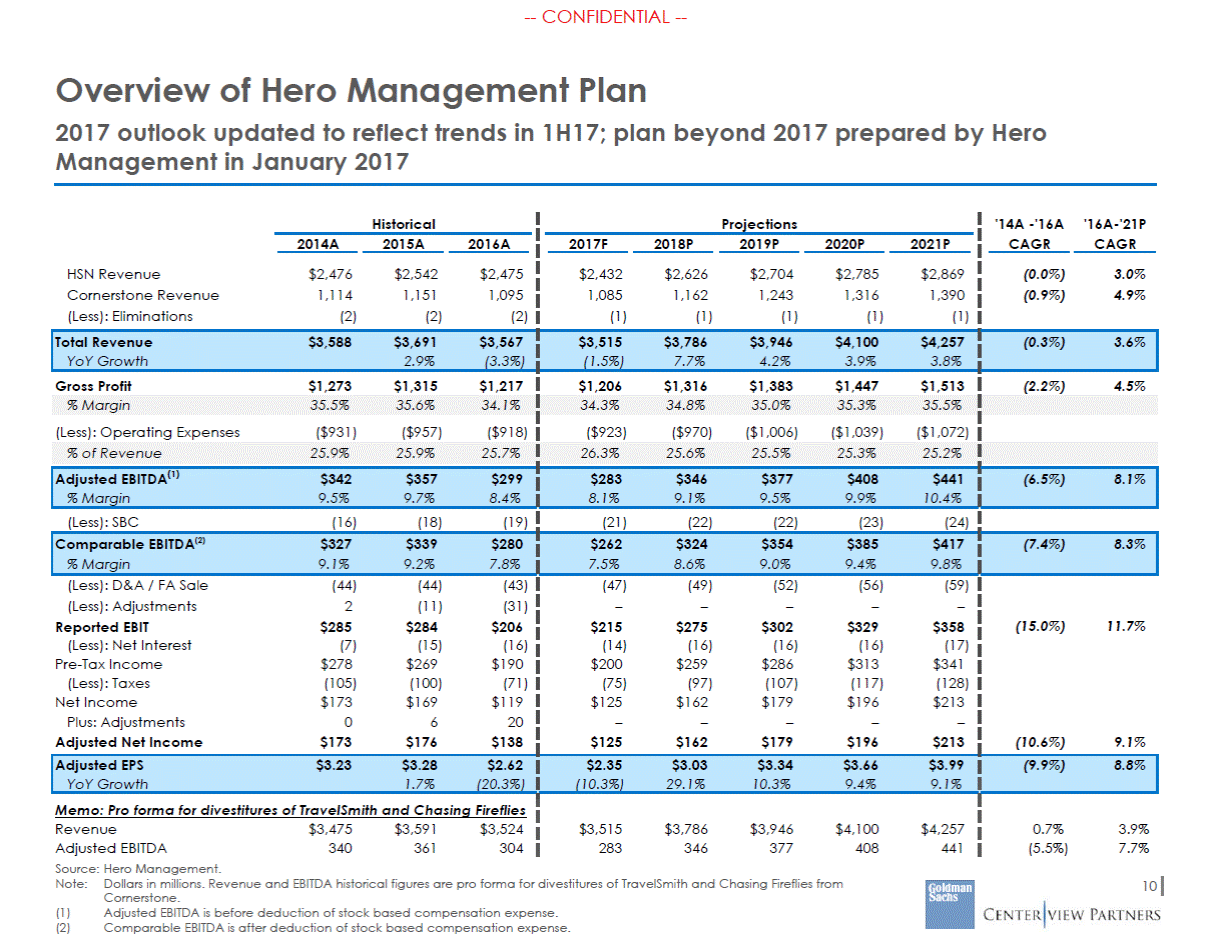
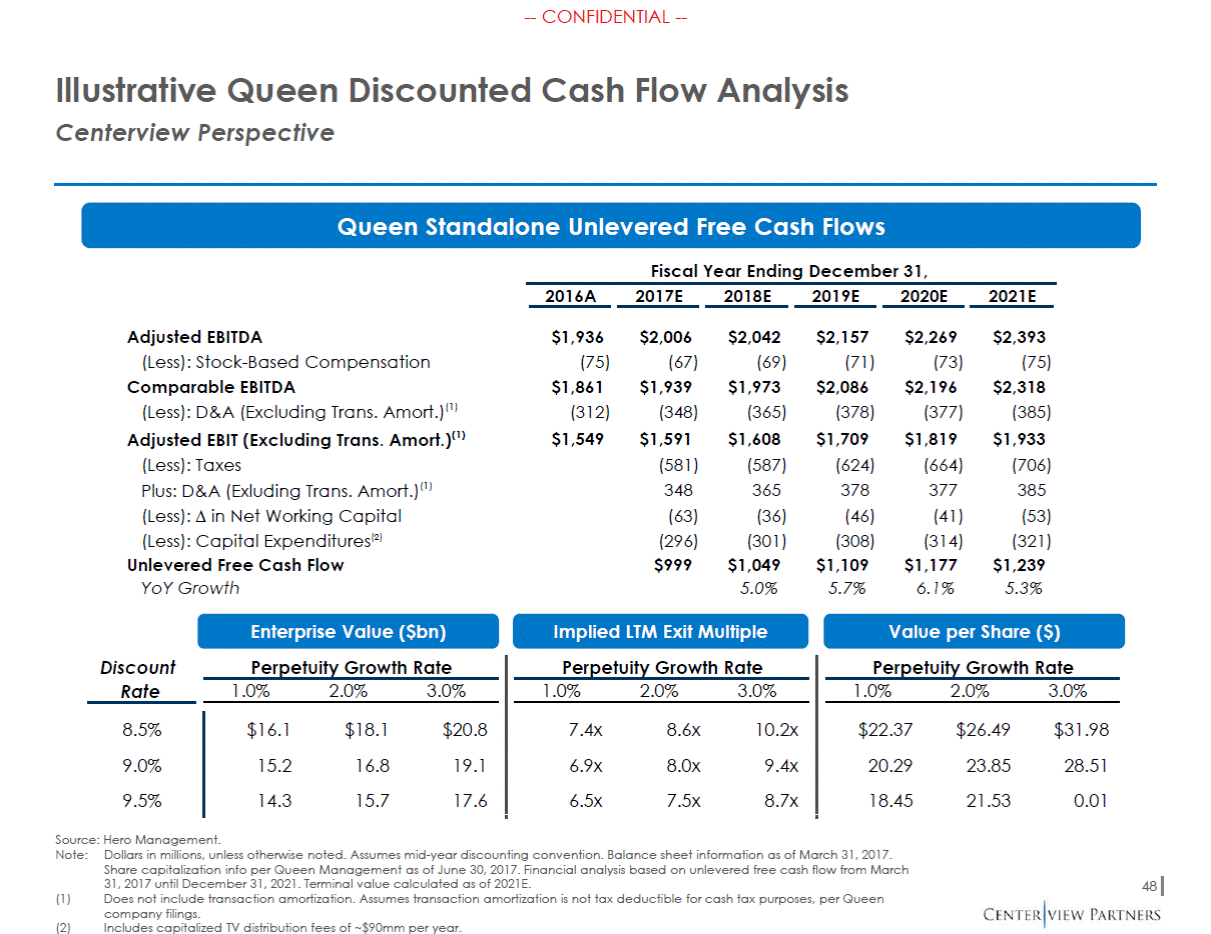
--CONFIDENTIAL --Overview of Queen Financial Plan Based on Hero Management view of Queen Management plan; projections not affected by GCI-Lion transaction Source: Hero Management. Note: (1) (2) (3) Dollars in millions. Adjusted EBITDA is before the deduction of stock-based compensation expense. Comparable EBITDA is after deduction of stock based compensation expense. Does not include transaction amortization. Assumes transaction amortization is not tax deductible for cash tax purposes, per Queen company filings. Includes capitalized TV distribution fees of ~$90mm per year. 11 (4) Historical 2014A 2015A 2016A Hero Management Projections 2017E 2018E 2019E 2020E 2021E CAGR '14A-'16A '16A-'21E Revenue $10,028 $9,169 $10,219 YoY Growth (8.6%) 11.5% $10,321 $10,568 $10,882 $11,197 $11,533 1.0% 2.4% 3.0% 2.9% 3.0% 0.9% 2.4% Gross Profit $3,650 $3,322 $3,577 $3,458 $3,551 $3,667 $3,785 $3,910 (1.0%) 1.8% % Margin 36.4% 36.2% 35.0% 33.5% 33.6% 33.7% 33.8% 33.9% (Less): Operating Expenses ($1,711) ($1,435) ($1,641) ($1,451) ($1,509) ($1,510) ($1,516) ($1,516) % of Revenue 17.1% 15.7% 16.1% 14.1% 14.3% 13.9% 13.5% 13.1% Adjusted EBITDA(1) $1,939 $1,887 $1,936 % Margin 19.3% 20.6% 18.9% $2,006 $2,042 $2,157 $2,269 $2,393 19.4% 19.3% 19.8% 20.3% 20.8% (0.1%) 4.3% (Less): Stock-Based Comp. (83) (60) (75) (67) (69) (71) (73) (75) Comparable EBITDA(2) $1,856 $1,827 $1,861 % Margin 18.5% 19.9% 18.2% $1,939 $1,973 $2,086 $2,196 $2,318 18.8% 18.7% 19.2% 19.6% 20.1% 0.1% 4.5% (Less): Depreciation (Less): Other Amortization(3) (Less): Other Adjusted EBIT (Before Trans. Amort) (Less): Taxes Plus: Depreciation Plus: Other Amortization (Less): in Net Working Capital (Less): Capital Expenditures(4) (179) (185) (191) (198) (205) (169) (181) (186) (180) (180) – – – – – $1,591 $1,608 $1,709 $1,819 $1,933 (581) (587) (624) (664) (706) 179 185 191 198 205 169 181 186 180 180 (63) (36) (46) (41) (53) (296) (301) (308) (314) (321) (1.1%) 4.5% Unlevered Free Cash Flow YoY Growth $999 $1,049 $1,109 $1,177 $1,239 5.0% 5.7% 6.1% 5.3%
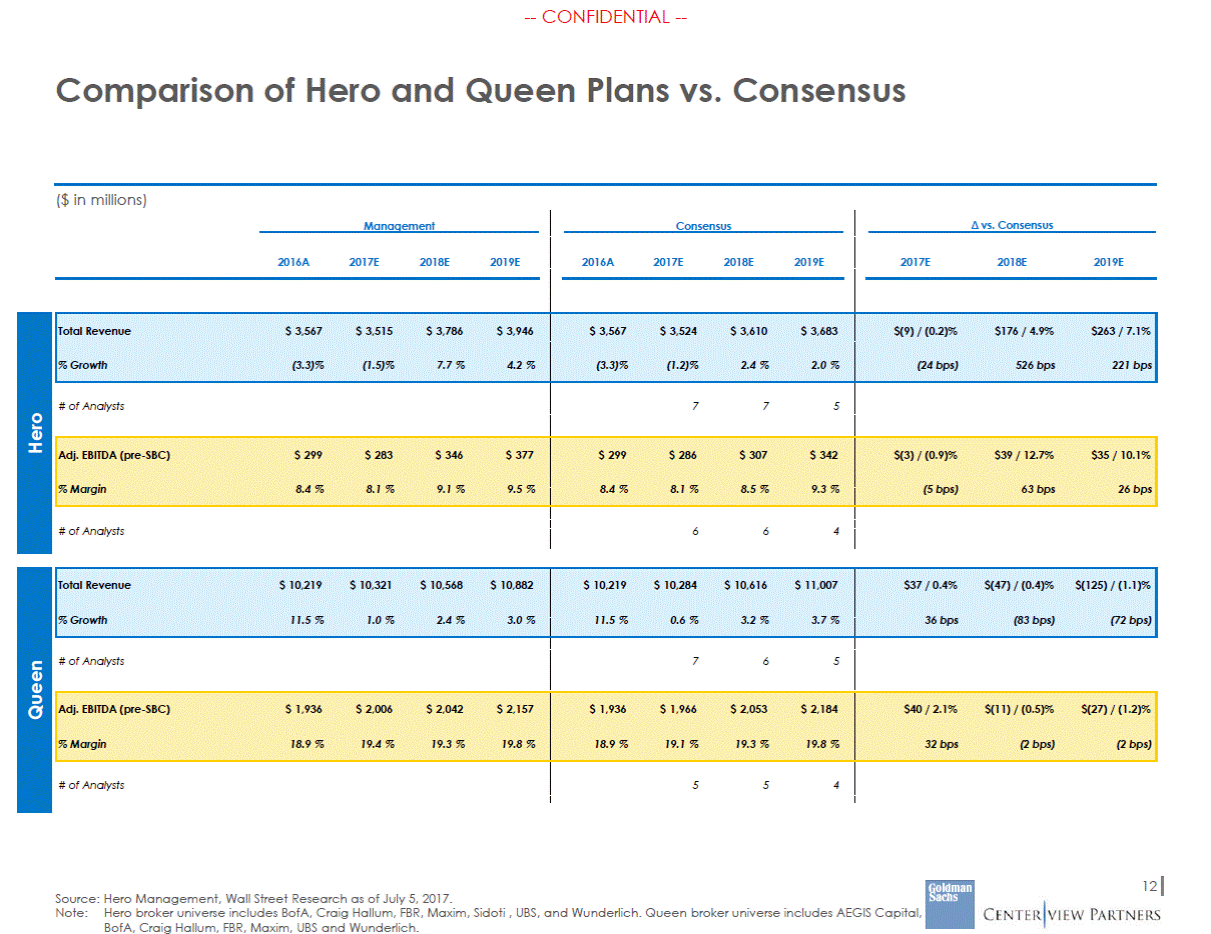
--CONFIDENTIAL --Comparison of Hero and Queen Plans vs. Consensus ($ in millions) 12 Source: Hero Management, Wall Street Research as of July 5, 2017. Note:Hero broker universe includes BofA, Craig Hallum, FBR, Maxim, Sidoti , UBS, and Wunderlich. Queen broker universe includes AEGIS Capital, BofA, Craig Hallum, FBR, Maxim, UBS and Wunderlich. Queen Total Revenue$ 10,219$ 10,321$ 10,568$ 10,882 % Growth11.5 %1.0 %2.4 %3.0 % $ 10,219$ 10,284$ 10,616$ 11,007 11.5 %0.6 %3.2 %3.7 % $37 / 0.4%$(47) / (0.4)%$(125) / (1.1)% 36 bps(83 bps)(72 bps) # of Analysts 765 Adj. EBITDA (pre-SBC)$ 1,936$ 2,006$ 2,042$ 2,157 % Margin18.9 %19.4 %19.3 %19.8 % $ 1,936$ 1,966$ 2,053$ 2,184 18.9 %19.1 %19.3 %19.8 % $40 / 2.1%$(11) / (0.5)%$(27) / (1.2)% 32 bps(2 bps)(2 bps) # of Analysts 554 Management 2016A2017E2018E2019E Consensus 2016A2017E2018E2019E vs. Consensus 2017E2018E2019E Hero Total Revenue$ 3,567$ 3,515$ 3,786$ 3,946 % Growth(3.3)%(1.5)%7.7 %4.2 % $ 3,567$ 3,524$ 3,610$ 3,683 (3.3)%(1.2)%2.4 %2.0 % $(9) / (0.2)%$176 / 4.9%$263 / 7.1% (24 bps)526 bps221 bps # of Analysts 775 Adj. EBITDA (pre-SBC)$ 299$ 283$ 346$ 377 % Margin8.4 %8.1 %9.1 %9.5 % $ 299$ 286$ 307$ 342 8.4 %8.1 %8.5 %9.3 % $(3) / (0.9)%$39 / 12.7%$35 / 10.1% (5 bps)63 bps26 bps # of Analysts 664
Summary of Financial Analysis Section 3
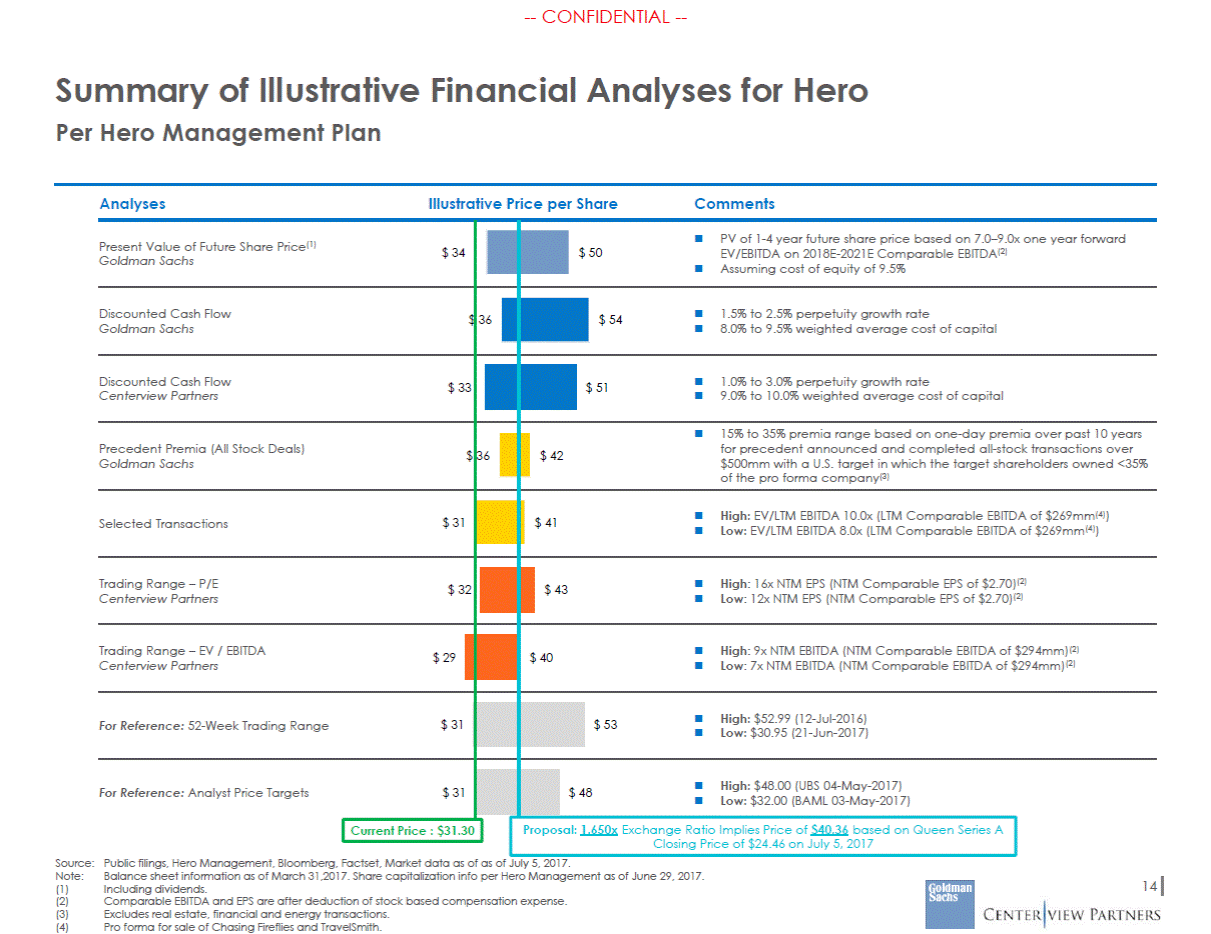
--CONFIDENTIAL --Summary of Illustrative Per Hero Management Plan Financial Analyses for Hero Analyses Illustrative Price per Share Comments $ 50 EV/EBITDA on 2018E-2021E Comparable EBITDA(2) 8.0% to 9.5% weighted average cost of capital 9.0% to 10.0% weighted average cost of capital $500mm with a U.S. target in which the target shareholders owned <35% of the pro forma company(3) Low: EV/LTM EBITDA 8.0x (LTM Comparable EBITDA of $269mm(4)) Low: 12x NTM EPS (NTM Comparable EPS of $2.70)(2) Centerview Partners Low: $30.95 (21-Jun-2017) Low: $32.00 (BAML 03-May-2017) Proposal: 1.650x Exchange Ratio Implies Price of $40.36 based on Queen Series A Closing Price of $24.46 on July 5, 2017 Public filings, Hero Management, Bloomberg, Factset, Market data as of as of July 5, 2017. Current Price : $31.30 Source: Note: (1) (2) (3) (4) Balance sheet information as of March 31,2017. Share capitalization info per Hero Management as of June 29, 2017. Including dividends. Comparable EBITDA and EPS are after deduction of stock based compensation expense. Excludes real estate, financial and energy transactions. Pro forma for sale of Chasing Fireflies and TravelSmith. 14 Present Value of Future Share Price(1) $ 34 Goldman Sachs PV of 1-4 year future share price based on 7.0–9.0x one year forward Assuming cost of equity of 9.5% Discounted Cash Flow$ Goldman Sachs 36 $ 54 1.5% to 2.5% perpetuity growth rate Discounted Cash Flow$ 33 Centerview Partners $ 51 1.0% to 3.0% perpetuity growth rate Precedent Premia (All Stock Deals)$ Goldman Sachs 36 15% to 35% premia range based on one-day premia over past 10 years $ 42for precedent announced and completed all-stock transactions over Selected Transactions$ 31 $ 41 High: EV/LTM EBITDA 10.0x (LTM Comparable EBITDA of $269mm(4)) Trading Range – P/E$ 32 Centerview Partners $ 43 High: 16x NTM EPS (NTM Comparable EPS of $2.70)(2) $ 40 High: 9x NTM EBITDA (NTM Comparable EBITDA of $294mm)(2) Low: 7x NTM EBITDA (NTM Comparable EBITDA of $294mm)(2) Trading Range – EV / EBITDA$ 29 For Reference: 52-Week Trading Range$ 31 $ 53 High: $52.99 (12-Jul-2016) For Reference: Analyst Price Targets$ 31 $ 48 High: $48.00 (UBS 04-May-2017)
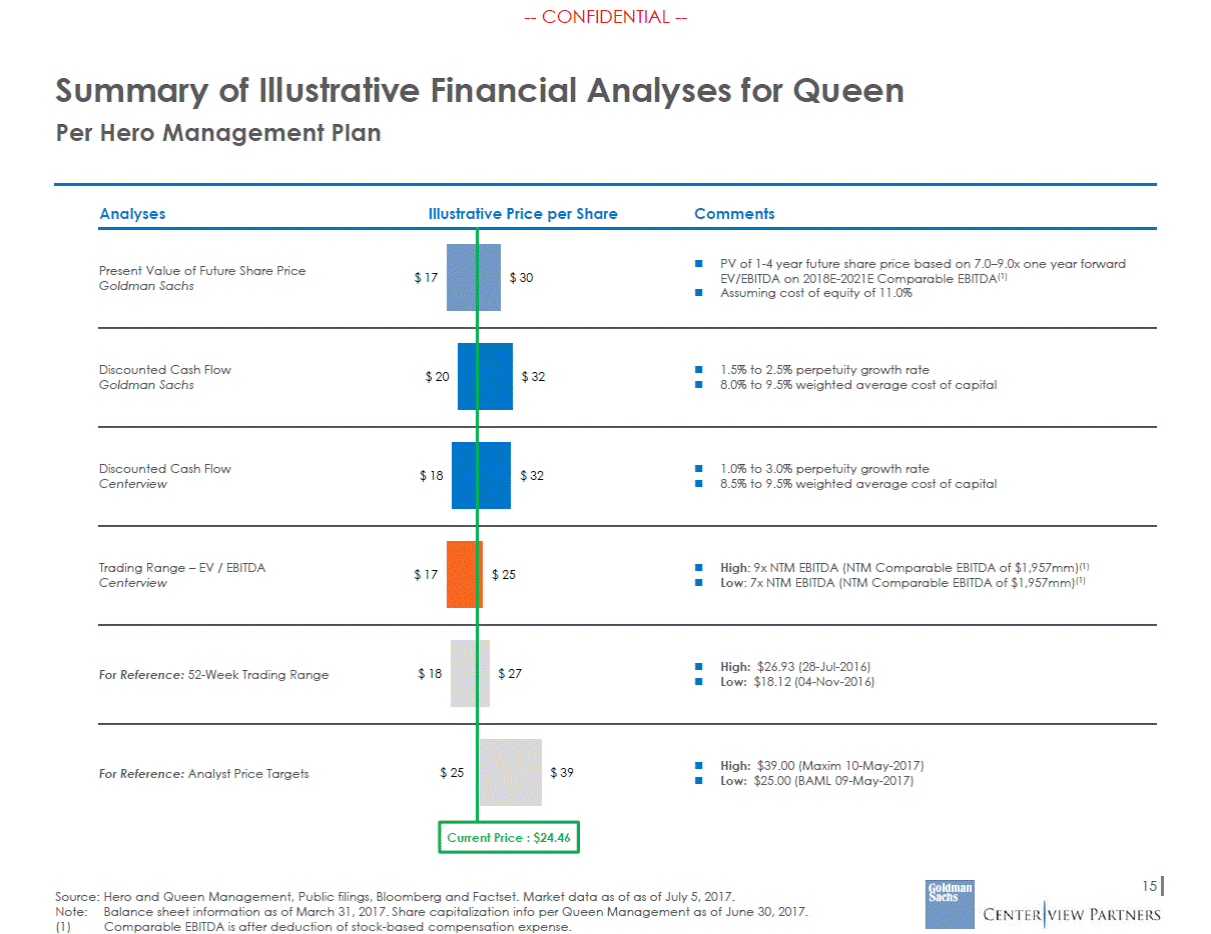
--CONFIDENTIAL --Summary of Illustrative Per Hero Management Plan Financial Analyses for Queen Analyses Illustrative Price per Share Comments $ 30 EV/EBITDA on 2018E-2021E Comparable EBITDA(1) 8.0% to 9.5% weighted average cost of capital 8.5% to 9.5% weighted average cost of capital Low: 7x NTM EBITDA (NTM Comparable EBITDA of $1,957mm)(1) Low: $18.12 (04-Nov-2016) Low: $25.00 (BAML 09-May-2017) Current Price : $24.46 15 Source: Hero and Queen Management, Public filings, Bloomberg and Factset. Market data as of as of July 5, 2017. Note:Balance sheet information as of March 31, 2017. Share capitalization info per Queen Management as of June 30, 2017. (1) Comparable EBITDA is after deduction of stock-based compensation expense. Present Value of Future Share Price$ 17 Goldman Sachs PV of 1-4 year future share price based on 7.0–9.0x one year forward Assuming cost of equity of 11.0% Discounted Cash Flow$ 20 Goldman Sachs $ 32 1.5% to 2.5% perpetuity growth rate Discounted Cash Flow$ 18 Centerview $ 32 1.0% to 3.0% perpetuity growth rate Trading Range – EV / EBITDA$ 17 Centerview $ 25 High: 9x NTM EBITDA (NTM Comparable EBITDA of $1,957mm)(1) For Reference: 52-Week Trading Range$ 18 $ 27 High: $26.93 (28-Jul-2016) For Reference: Analyst Price Targets$ 25 $ 39 High: $39.00 (Maxim 10-May-2017)
Pro Forma Considerations Section 4
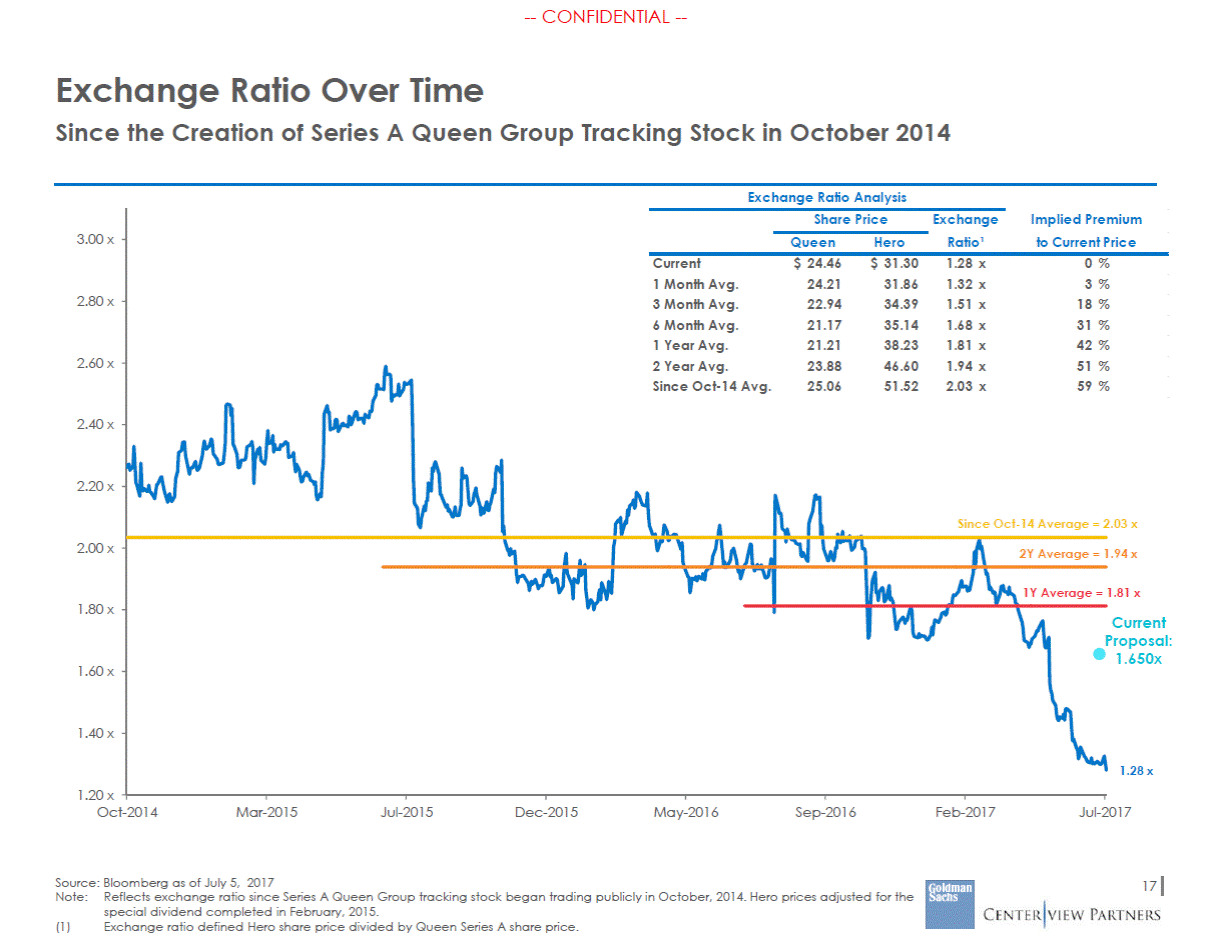
--CONFIDENTIAL --Exchange Ratio Over Time Since the Creation of Series A Queen Group Tracking Stock in October 2014 Exchange Ratio Analysis mium Price 3.00 x % % % % % % % 2.80 x 2.60 x 2.40 x 2.20 x 2.03 x 2.00 x 1.94 x 1.81 x 1.80 x Current Proposal: 1.650x 1.60 x 1.40 x 1.28 x 1.20 x Oct-2014 Mar-2015 Jul-2015 Dec-2015 May-2016 Sep-2016 Feb-2017 Jul-2017 Source: Bloomberg as of July 5, 2017 Note:Reflects exchange ratio since Series A Queen Group tracking stock began trading publicly in October, 2014. Hero prices adjusted for the special dividend completed in February, 2015. 17 (1) Exchange ratio defined Hero share price divided by Queen Series A share price. Share PriceExchangeImplied Pre QueenHeroRatio¹to Current Current$ 24.46$ 31.301.28 x0 1 Month Avg.24.2131.861.32 x3 3 Month Avg.22.9434.391.51 x18 6 Month Avg.21.1735.141.68 x31 1 Year Avg.21.2138.231.81 x42 2 Year Avg.23.8846.601.94 x51 Since Oct-14 Avg.25.0651.522.03 x59 Since Oct-14 Average = 2Y Average = 1Y Average =
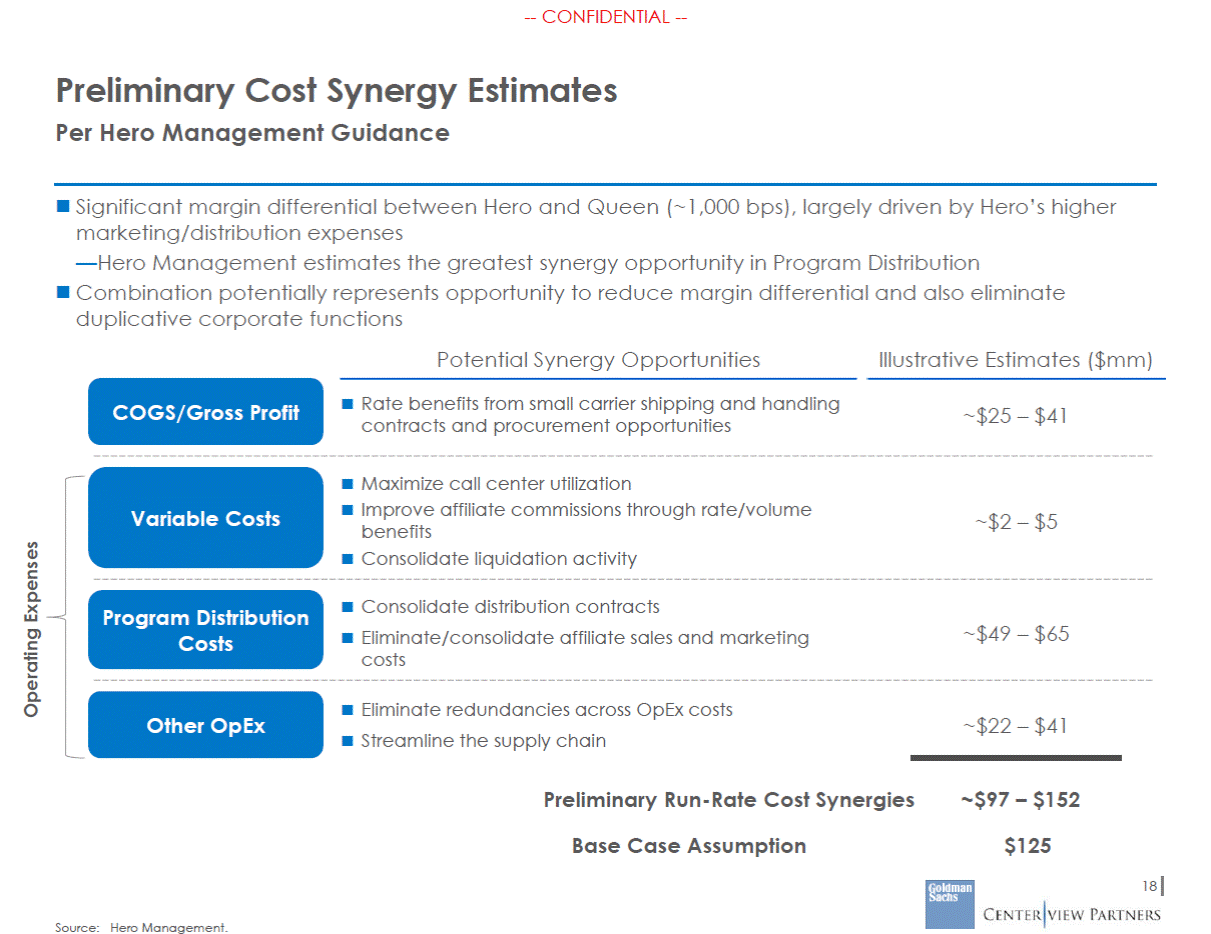
--CONFIDENTIAL --Preliminary Cost Synergy Estimates Per Hero Management Guidance Significant margin differential between Hero and Queen (~1,000 bps), largely driven by Hero’s higher marketing/distribution expenses —Hero Management estimates the greatest synergy opportunity in Program Distribution Combination potentially represents opportunity to reduce margin differential and also eliminate duplicative corporate functions Potential Synergy Opportunities Illustrative Estimates ($mm) Rate benefits from small carrier shipping and handling contracts and procurement opportunities COGS/Gross Profit ~$25 – $41 Maximize call center utilization Improve affiliate commissions through rate/volume benefits Consolidate liquidation activity Variable Costs ~$2 – $5 Consolidate distribution contracts Eliminate/consolidate affiliate sales and marketing costs Program Distribution Costs ~$49 – $65 Eliminate redundancies across OpEx costs Streamline the supply chain Other OpEx ~$22 – $41 Preliminary Run-Rate Cost Synergies ~$97 – $152 Base Case Assumption $125 18 Source: Hero Management. Operating Expenses
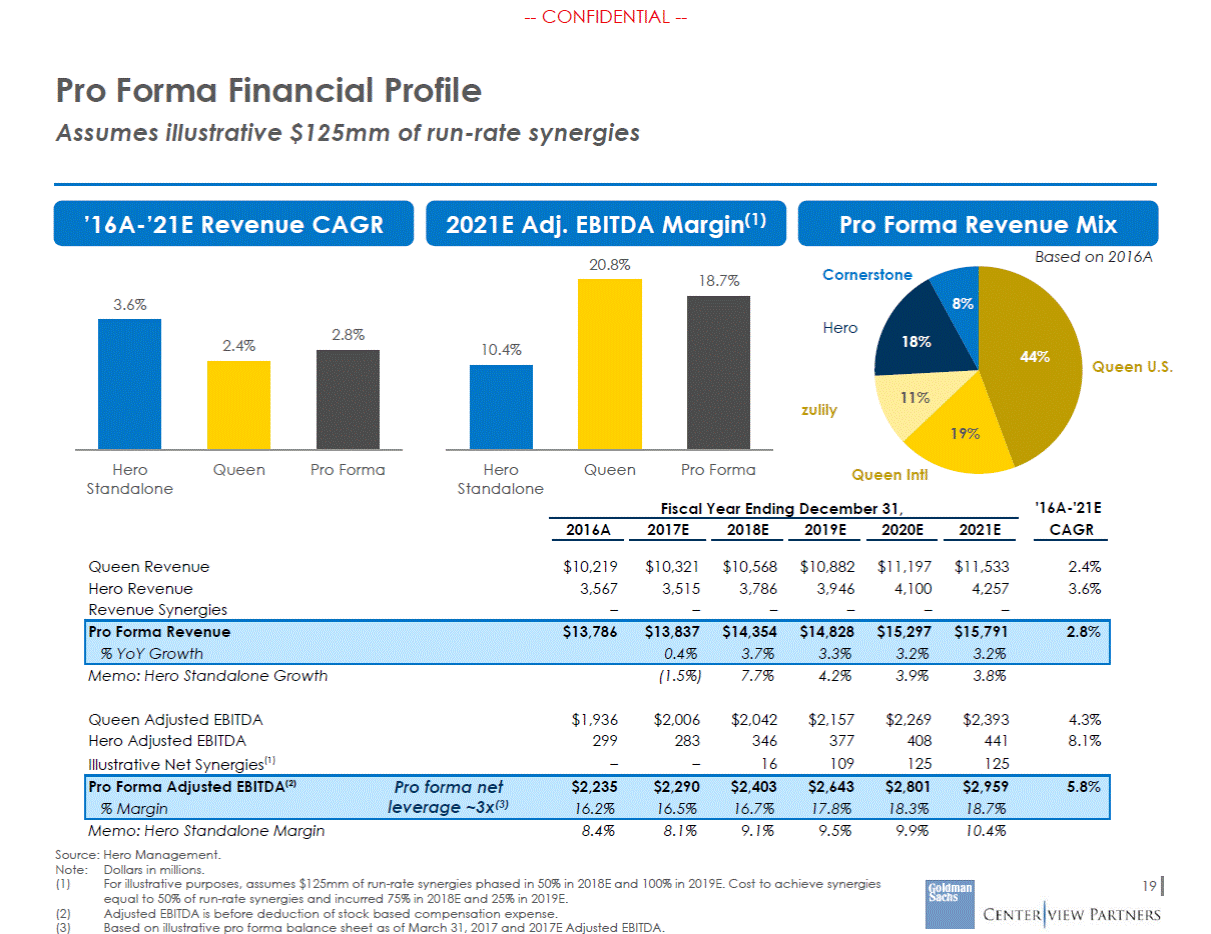
--CONFIDENTIAL --Pro Forma Financial Profile Assumes illustrative $125mm of run-rate synergies ’16A-’21E Revenue CAGR 2021E Adj. EBITDA Margin(1) 20.8% Pro Forma Revenue Mix Based on 2016A Cornerstone 8% Hero 18.7% 3.6% 18% 44% Queen U.S. 11% zulily 19% Hero Standalone Queen Pro Forma Hero Standalone Queen Pro Forma Queen Intl Fiscal Year Ending December 31, '16A-'21E CAGR 2016A 2017E 2018E 2019E 2020E 2021E Queen Revenue Hero Revenue Revenue Synergies $10,219 3,567 – $10,321 3,515 – $10,568 3,786 – $10,882 3,946 – $11,197 4,100 – $11,533 4,257 – 2.4% 3.6% Memo: Hero Standalone Growth (1.5%) 7.7% 4.2% 3.9% 3.8% Queen Adjusted EBITDA Hero Adjusted EBITDA Illustrative Net Synergies(1) $1,936 299 – $2,006 283 – $2,042 346 16 $2,157 377 109 $2,269 408 125 $2,393 441 125 4.3% 8.1% Memo: Hero Standalone Margin Source: Hero Management. 8.4% 8.1% 9.1% 9.5% 9.9% 10.4% Note: (1) Dollars in millions. For illustrative purposes, assumes $125mm of run-rate synergies phased in 50% in 2018E and 100% in 2019E. Cost to achieve synergies equal to 50% of run-rate synergies and incurred 75% in 2018E and 25% in 2019E. Adjusted EBITDA is before deduction of stock based compensation expense. Based on illustrative pro forma balance sheet as of March 31, 2017 and 2017E Adjusted EBITDA. 19 (2) (3) Pro Forma Adjusted EBITDA(2) Pro forma net$2,235 $2,290 $2,403 $2,643 $2,801 $2,959 5.8% % Margin leverage ~3x(3) 16.2% 16.5% 16.7% 17.8% 18.3% 18.7% Pro Forma Revenue $13,786 $13,837 $14,354 $14,828 $15,297 $15,791 2.8% % YoY Growth 0.4% 3.7% 3.3% 3.2% 3.2% 2.8% 2.4% 10.4%
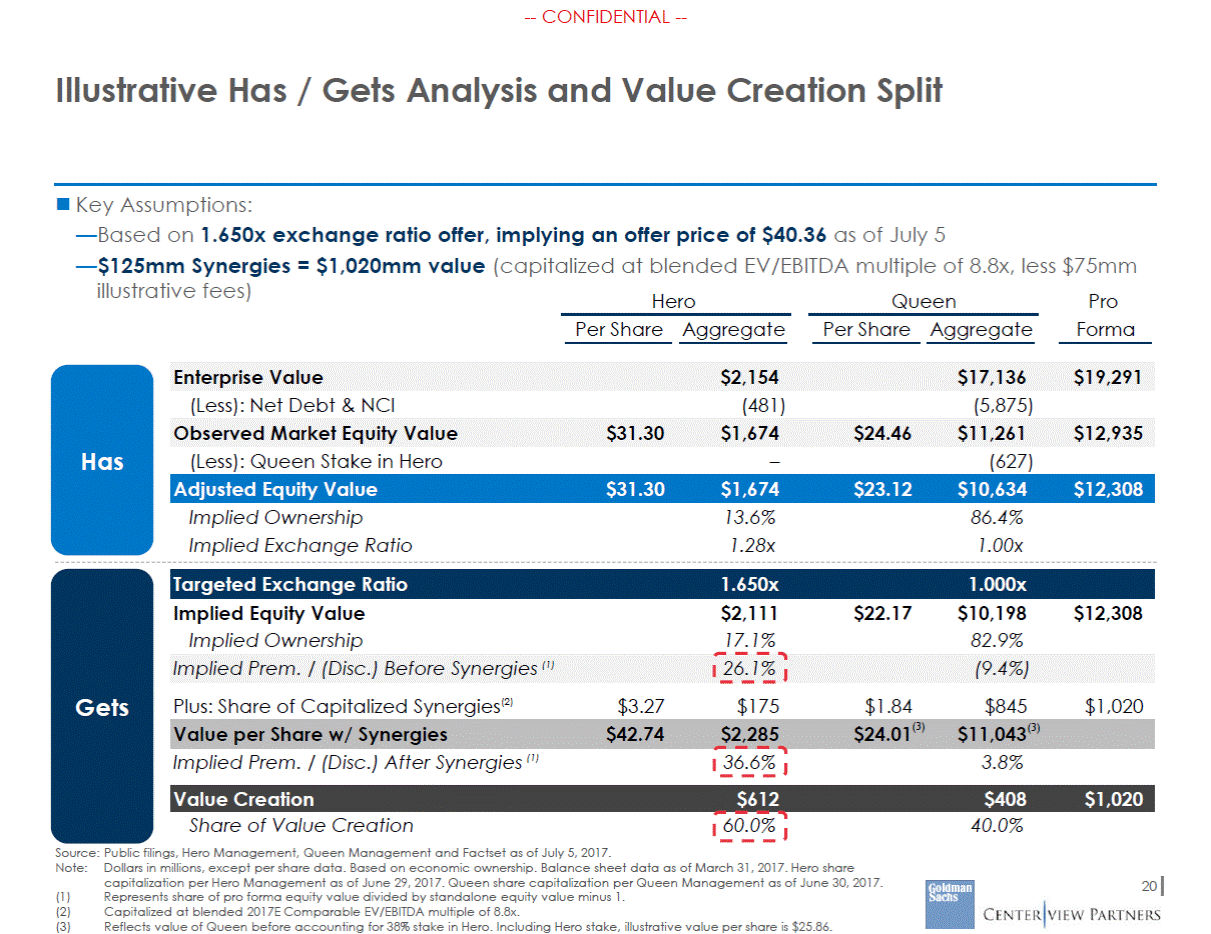
--CONFIDENTIAL --Illustrative Has / Gets Analysis and Value Creation Split Key Assumptions: —Based on 1.650x exchange ratio offer, implying an offer price of $40.36 as of July 5 —$125mm Synergies = $1,020mm value (capitalized at blended EV/EBITDA multiple of 8.8x, less $75mm illustrative fees) Hero Queen Pro Forma Per Share Aggregate Per Share Aggregate (Less): Net Debt & NCI (481) (5,875) Has (Less): Queen Stake in Hero – (627) Implied Ownership Implied Exchange Ratio 13.6% 1.28x 86.4% 1.00x Implied Equity Value Implied Ownership $2,111 17.1% $22.17 $10,198 82.9% $12,308 Gets Plus: Share of Capitalized Synergies(2) $3.27 $175 $1.84 $845 $1,020 Value per Share w/ Synergies $42.74 $2,285 $24.01 $11,043 Implied Prem. / (Disc.) After Synergies (1) 36.6% 3.8% Share of Value Creation Source: Public filings, Hero Management, Queen Management and Factset as of July 5, 2017. 60.0% 40.0% Note: Dollars in millions, except per share data. Based on economic ownership. Balance sheet data as of March 31, 2017. Hero share capitalization per Hero Management as of June 29, 2017. Queen share capitalization per Queen Management as of June 30, 2017. Represents share of pro forma equity value divided by standalone equity value minus 1. Capitalized at blended 2017E Comparable EV/EBITDA multiple of 8.8x. Reflects value of Queen before accounting for 38% stake in Hero. Including Hero stake, illustrative value per share is $25.86. 20 (1) (2) (3) Value Creation$612$408$1,020 (3)(3) Implied Prem. / (Disc.) Before Synergies (1) 26.1%(9.4%) Targeted Exchange Ratio1.650x1.000x Adjusted Equity Value$31.30$1,674$23.12$10,634$12,308 Observed Market Equity Value$31.30$1,674$24.46$11,261$12,935 Enterprise Value$2,154$17,136$19,291
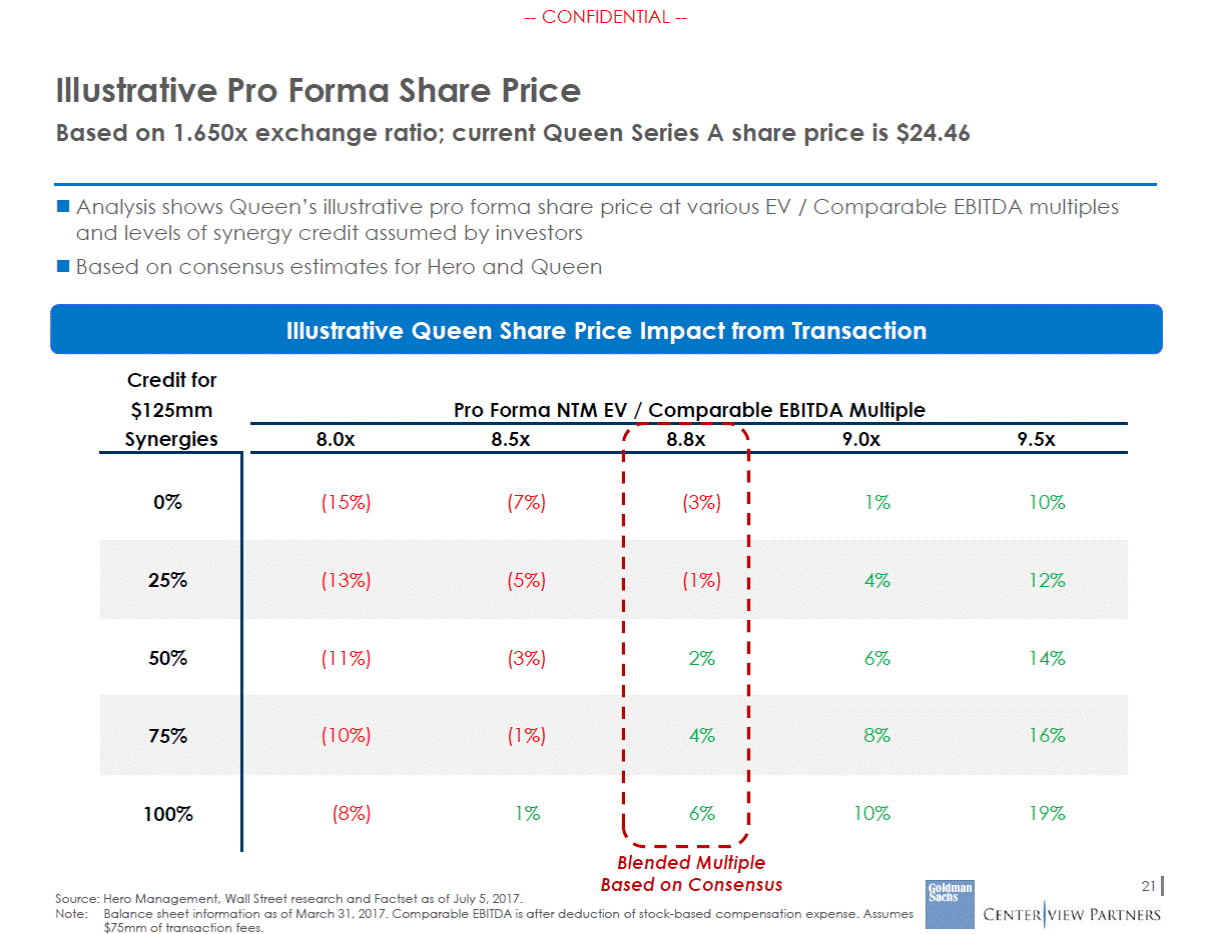
--CONFIDENTIAL --Illustrative Pro Forma Share Price Based on 1.650x exchange ratio; current Queen Series A share price is $24.46 Analysis shows Queen’s illustrative pro forma share price at various EV / Comparable EBITDA multiples and levels of synergy credit assumed by investors Based on consensus estimates for Hero and Queen Illustrative Queen Share Price Impact from Transaction Credit for $125mm Synergies Pro Forma NTM EV / Comparable EBITDA Multiple 8.0x 8.5x 8.8x 9.0x 9.5x Blended Multiple Based on Consensus 21 Source: Hero Management, Wall Street research and Factset as of July 5, 2017. Note:Balance sheet information as of March 31, 2017. Comparable EBITDA is after deduction of stock-based compensation expense. Assumes $75mm of transaction fees. 0% (15%) (7%) (3%) 1% 10% 25% (13%) (5%) (1%) 4% 12% 50% (11%) (3%) 2% 6% 14% 75% (10%) (1%) 4% 8% 16% 100% (8%) 1% 6% 10% 19%
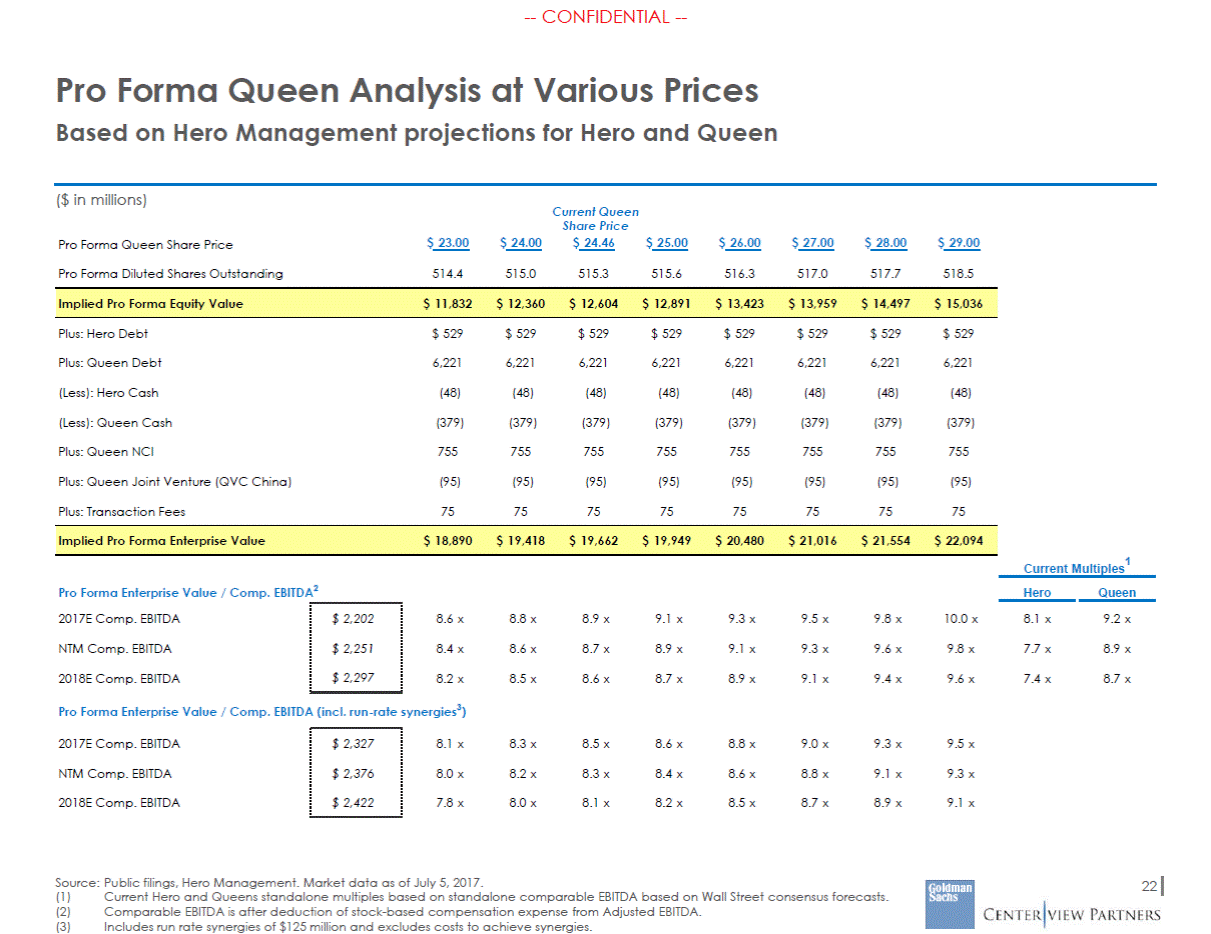
--CONFIDENTIAL --Pro Forma Queen Analysis at Various Prices Based on Hero Management projections for Hero and Queen ($ in millions) Current Queen Share Price $ 24.46 $ 23.00 $ 24.00 $ 25.00 $ 26.00 $ 27.00 $ 28.00 $ 29.00 Pro Forma Queen Share Price Pro Forma Diluted Shares Outstanding 514.4 515.0 515.3 515.6 516.3 517.0 517.7 518.5 Plus: Hero Debt $ 529 $ 529 $ 529 $ 529 $ 529 $ 529 $ 529 $ 529 Plus: Queen Debt 6,221 6,221 6,221 6,221 6,221 6,221 6,221 6,221 (Less): Hero Cash (48) (48) (48) (48) (48) (48) (48) (48) (Less): Queen Cash (379) (379) (379) (379) (379) (379) (379) (379) Plus: Queen NCI 755 755 755 755 755 755 755 755 Plus: Queen Joint Venture (QVC China) (95) (95) (95) (95) (95) (95) (95) (95) Plus: Transaction Fees 75 75 75 75 75 75 75 75 1 Current Multiples Pro Forma Enterprise Value / Comp. EBITDA2 2017E Comp. EBITDA Hero Queen $ 2,202 8.6 x 8.8 x 8.9 x 9.1 x 9.3 x 9.5 x 9.8 x 10.0 x 8.1 x 9.2 x NTM Comp. EBITDA $ 2,251 8.4 x 8.6 x 8.7 x 8.9 x 9.1 x 9.3 x 9.6 x 9.8 x 7.7 x 8.9 x 2018E Comp. EBITDA $ 2,297 8.2 x 8.5 x 8.6 x 8.7 x 8.9 x 9.1 x 9.4 x 9.6 x 7.4 x 8.7 x Pro Forma Enterprise Value / Comp. EBITDA (incl. run-rate synergies3) 2017E Comp. EBITDA $ 2,327 8.1 x 8.3 x 8.5 x 8.6 x 8.8 x 9.0 x 9.3 x 9.5 x NTM Comp. EBITDA $ 2,376 8.0 x 8.2 x 8.3 x 8.4 x 8.6 x 8.8 x 9.1 x 9.3 x 2018E Comp. EBITDA $ 2,422 7.8 x 8.0 x 8.1 x 8.2 x 8.5 x 8.7 x 8.9 x 9.1 x Source: Public filings, Hero Management. Market data as of July 5, 2017. 22 (1) (2) (3) Current Hero and Queens standalone multiples based on standalone comparable EBITDA based on Wall Street consensus forecasts. Comparable EBITDA is after deduction of stock-based compensation expense from Adjusted EBITDA. Includes run rate synergies of $125 million and excludes costs to achieve synergies. Implied Pro Forma Enterprise Value$ 18,890$ 19,418$ 19,662$ 19,949$ 20,480$ 21,016$ 21,554$ 22,094 Implied Pro Forma Equity Value$ 11,832$ 12,360$ 12,604$ 12,891$ 13,423$ 13,959$ 14,497$ 15,036
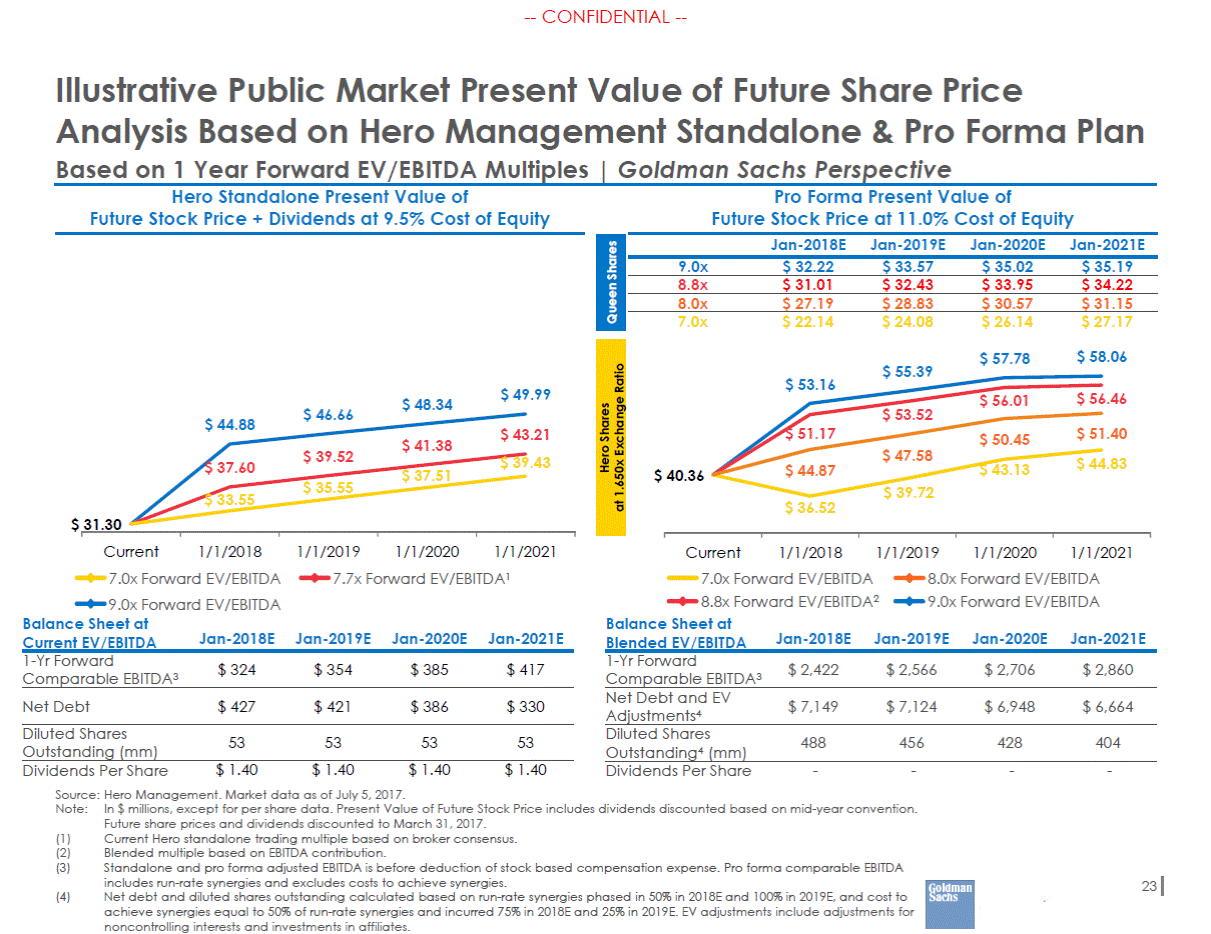
--CONFIDENTIAL --Illustrative Public Market Present Value of Future Share Price Analysis Based on Hero Management Standalone & Pro Forma Plan Based on 1 Year Forward EV/EBITDA Multiples | Goldman Sachs Perspective Hero Standalone Present Value of Future Stock Price + Dividends at 9.5% Cost of Equity Pro Forma Present Value of Future Stock Price at 11.0% Cost of Equity $ 58.06 $ 57.78 $ 55.39 $ 53.16 $ 49.99 $ 56.46 $ 56.01 $ 48.34 $ 46.66 $ 53.52 $ 44.88 $ 51.17 $ 51.40 $ 44.83 $ 43.21 $ 39.43 $ 50.45 $ 43.13 $ 41.38 $ 37.51 $ 47.58 $ 39.52 $ 35.55 $ 37.60 $ 44.87 $ 40.36 $ 39.72 $ 33.55 $ 36.52 $ 31.30 Current 1/1/2018 1/1/2019 1/1/2020 1/1/2021 Current 1/1/2018 1/1/2019 1/1/2020 1/1/2021 7.0x Forward EV/EBITDA 9.0x Forward EV/EBITDA 7.7x Forward EV/EBITDA1 7.0x Forward EV/EBITDA 8.8x Forward EV/EBITDA2 8.0x Forward EV/EBITDA 9.0x Forward EV/EBITDA Balance Sheet at Current EV/EBITDA Balance Sheet at Blended EV/EBITDA Jan-2018E Jan-2019E Jan-2020E Jan-2021E Jan-2018E Jan-2019E Jan-2020E Jan-2021E 1-Yr Forward Comparable EBITDA3 1-Yr Forward Comparable EBITDA3 $ 324 $ 354 $ 385 $ 417 $ 2,422 $ 2,566 $ 2,706 $ 2,860 Net Debt and EV Adjustments4 $ 427 $ 421 $ 386 $ 330 Net Debt $ 7,149 $ 7,124 $ 6,948 $ 6,664 Diluted Shares Outstanding (mm) Diluted Shares Outstanding4 (mm) 53 53 53 53 488 456 428 404 Dividends Per Share $ 1.40 $ 1.40 $ 1.40 $ 1.40 - - - - Dividends Per Share Source: Hero Management. Market data as of July 5, 2017. Note: In $ millions, except for per share data. Present Value of Future Stock Price includes dividends discounted based on mid-year convention. Future share prices and dividends discounted to March 31, 2017. Current Hero standalone trading multiple based on broker consensus. Blended multiple based on EBITDA contribution. Standalone and pro forma adjusted EBITDA is before deduction of stock based compensation expense. Pro forma comparable EBITDA includes run-rate synergies and excludes costs to achieve synergies. Net debt and diluted shares outstanding calculated based on run-rate synergies phased in 50% in 2018E and 100% in 2019E, and cost to achieve synergies equal to 50% of run-rate synergies and incurred 75% in 2018E and 25% in 2019E. EV adjustments include adjustments for noncontrolling interests and investments in affiliates. (1) (2) (3) 23 (4) Hero Shares at 1.650x Exchange Ratio Queen Shares Jan-2018EJan-2019EJan-2020EJan-2021E 9.0x$ 32.22$ 33.57$ 35.02$ 35.19 8.8x$ 31.01$ 32.43$ 33.95$ 34.22 8.0x$ 27.19$ 28.83$ 30.57$ 31.15 7.0x$ 22.14$ 24.08$ 26.14$ 27.17
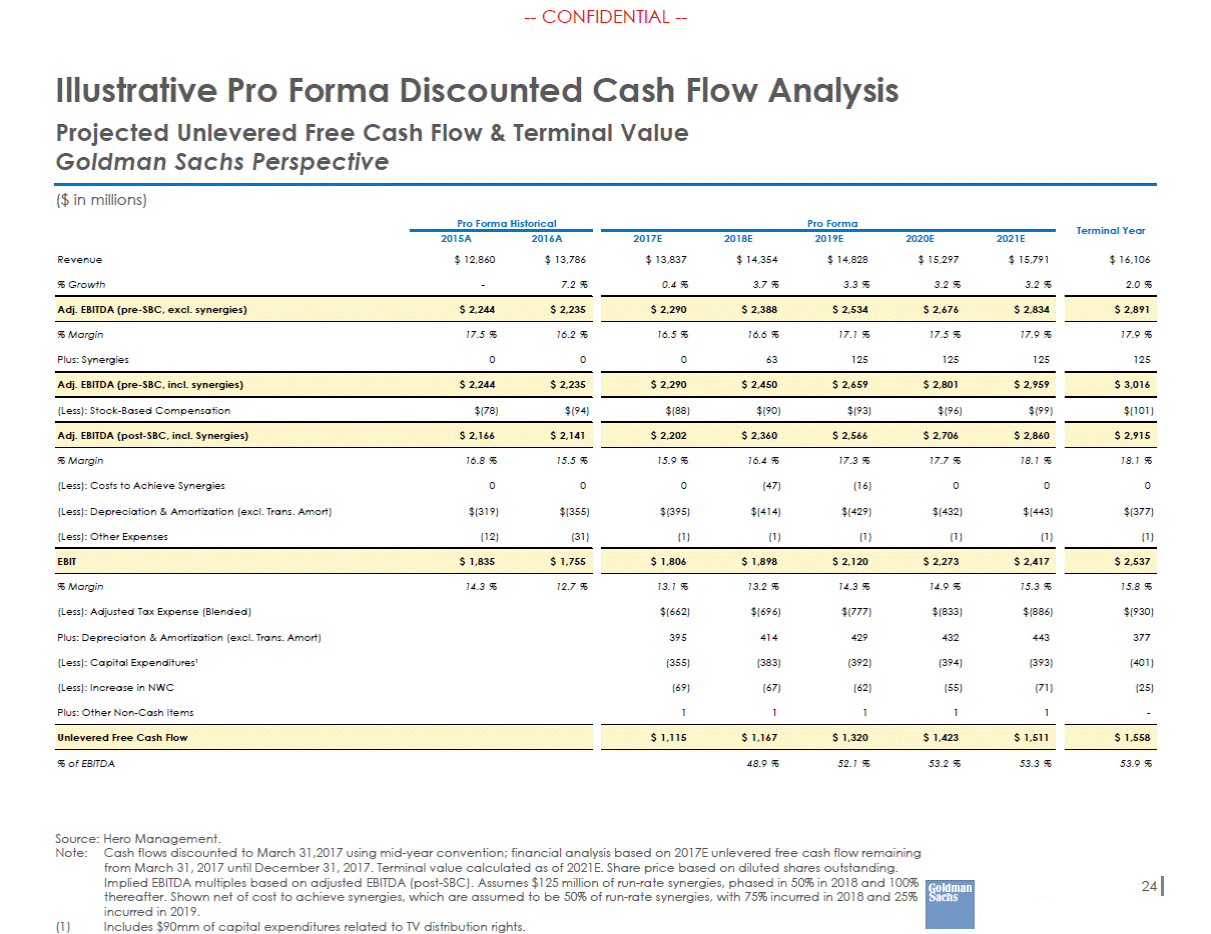
--CONFIDENTIAL --Illustrative Pro Forma Discounted Cash Flow Projected Unlevered Free Cash Flow & Terminal Value Goldman Sachs Perspective Analysis ($ in millions) Pro Forma Historical Pro Forma Terminal Year 2015A $ 12,860 2016A $ 13,786 2017E $ 13,837 2018E $ 14,354 2019E $ 14,828 2020E $ 15,297 2021E $ 15,791 Revenue $ 16,106 % Growth - 7.2 % 0.4 % 3.7 % 3.3 % 3.2 % 3.2 % 2.0 % % Margin 17.5 % 16.2 % 16.5 % 16.6 % 17.1 % 17.5 % 17.9 % 17.9 % Plus: Synergies 0 0 0 63 125 125 125 125 (Less): Stock-Based Compensation $(78) $(94) $(88) $(90) $(93) $(96) $(99) $(101) % Margin 16.8 % 15.5 % 15.9 % 16.4 % 17.3 % 17.7 % 18.1 % 18.1 % (Less): Costs to Achieve Synergies 0 0 0 (47) (16) 0 0 0 (Less): Depreciation & Amortization (excl. Trans. Amort) $(319) $(355) $(395) $(414) $(429) $(432) $(443) $(377) (Less): Other Expenses (12) (31) (1) (1) (1) (1) (1) (1) % Margin 14.3 % 12.7 % 13.1 % 13.2 % 14.3 % 14.9 % 15.3 % 15.8 % (Less): Adjusted Tax Expense (Blended) $(662) $(696) $(777) $(833) $(886) $(930) Plus: Depreciaton & Amortization (excl. Trans. Amort) 395 414 429 432 443 377 (Less): Capital Expenditures¹ (355) (383) (392) (394) (393) (401) (Less): Increase in NWC (69) (67) (62) (55) (71) (25) Plus: Other Non-Cash Items 1 1 1 1 1 - % of EBITDA 48.9 % 52.1 % 53.2 % 53.3 % 53.9 % Source: Hero Management. Note:Cash flows discounted to March 31,2017 using mid-year convention; financial analysis based on 2017E unlevered free cash flow remaining from March 31, 2017 until December 31, 2017. Terminal value calculated as of 2021E. Share price based on diluted shares outstanding. Implied EBITDA multiples based on adjusted EBITDA (post-SBC). Assumes $125 million of run-rate synergies, phased in 50% in 2018 and 100% thereafter. Shown net of cost to achieve synergies, which are assumed to be 50% of run-rate synergies, with 75% incurred in 2018 and 25% incurred in 2019. 24 (1) Includes $90mm of capital expenditures related to TV distribution rights. $ 1,558 $ 1,115 $ 1,167 $ 1,320 $ 1,423 $ 1,511 Unlevered Free Cash Flow $ 2,537 $ 1,806 $ 1,898 $ 2,120 $ 2,273 $ 2,417 EBIT $ 1,835 $ 1,755 $ 2,915 $ 2,202 $ 2,360 $ 2,566 $ 2,706 $ 2,860 Adj. EBITDA (post-SBC, incl. Synergies) $ 2,166 $ 2,141 $ 3,016 $ 2,290 $ 2,450 $ 2,659 $ 2,801 $ 2,959 Adj. EBITDA (pre-SBC, incl. synergies) $ 2,244 $ 2,235 $ 2,891 $ 2,290 $ 2,388 $ 2,534 $ 2,676 $ 2,834 Adj. EBITDA (pre-SBC, excl. synergies) $ 2,244 $ 2,235
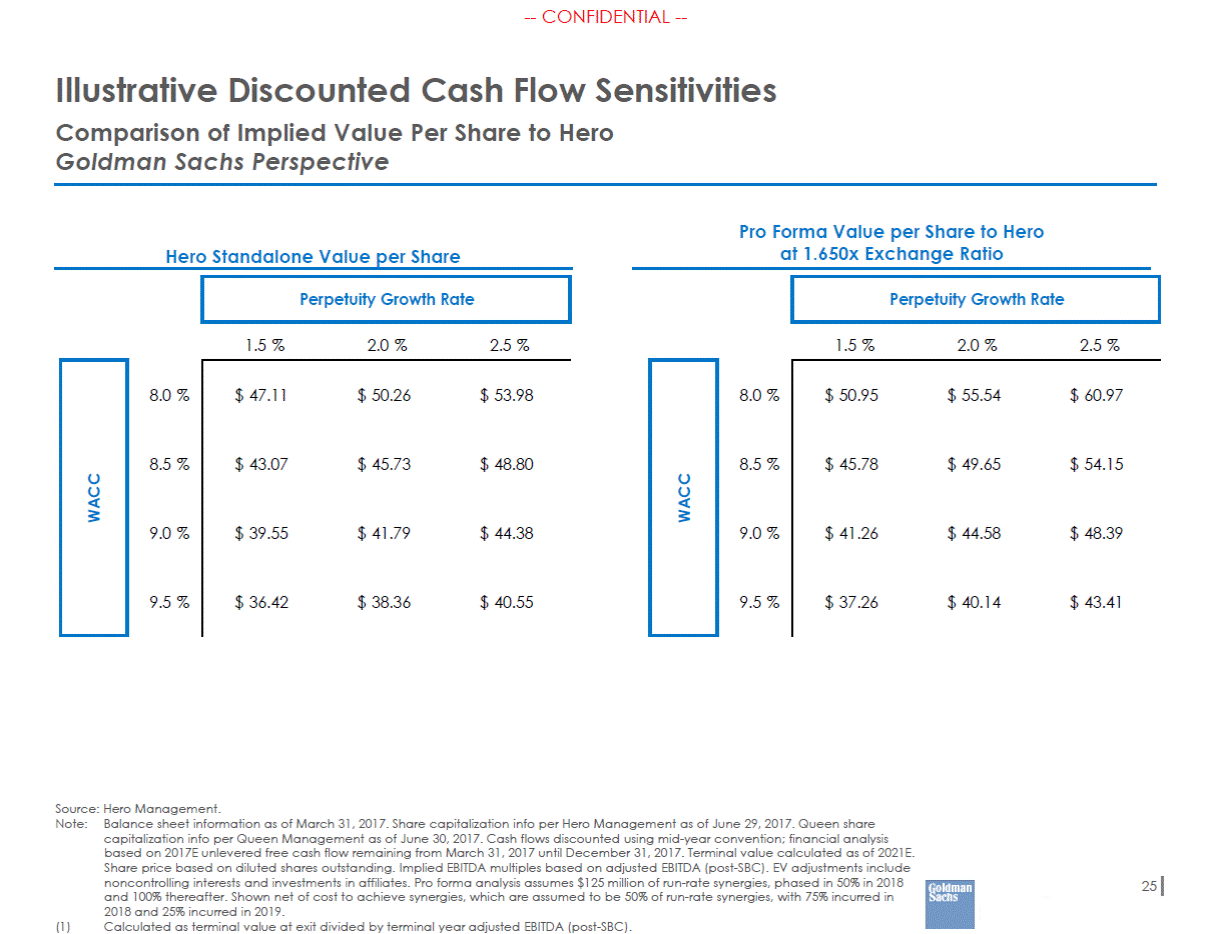
--CONFIDENTIAL --Illustrative Discounted Cash Flow Sensitivities Comparison of Implied Value Per Share to Hero Goldman Sachs Perspective Pro Forma Value per Share to Hero at 1.650x Exchange Ratio Hero Standalone Value per Share 1.5 % 2.0 % 2.5 % 1.5 % 2.0 % 2.5 % 8.0 % 8.0 % 8.5 % 8.5 % 9.0 % 9.0 % 9.5 % 9.5 % Source: Hero Management. Note:Balance sheet information as of March 31, 2017. Share capitalization info per Hero Management as of June 29, 2017. Queen share capitalization info per Queen Management as of June 30, 2017. Cash flows discounted using mid-year convention; financial analysis based on 2017E unlevered free cash flow remaining from March 31, 2017 until December 31, 2017. Terminal value calculated as of 2021E. Share price based on diluted shares outstanding. Implied EBITDA multiples based on adjusted EBITDA (post-SBC). EV adjustments include noncontrolling interests and investments in affiliates. Pro forma analysis assumes $125 million of run-rate synergies, phased in 50% in 2018 and 100% thereafter. Shown net of cost to achieve synergies, which are assumed to be 50% of run-rate synergies, with 75% incurred in 2018 and 25% incurred in 2019. 25 (1) Calculated as terminal value at exit divided by terminal year adjusted EBITDA (post-SBC). $ 50.95 $ 55.54 $ 60.97 $ 45.78 $ 49.65 $ 54.15 $ 41.26 $ 44.58 $ 48.39 $ 37.26 $ 40.14 $ 43.41 WACC $ 47.11 $ 50.26 $ 53.98 $ 43.07 $ 45.73 $ 48.80 $ 39.55 $ 41.79 $ 44.38 $ 36.42 $ 38.36 $ 40.55 WACC Perpetuity Growth Rate Perpetuity Growth Rate
GCI-Lion Transaction Considerations Section 5
--CONFIDENTIAL --GCI-Lion Transaction Summary On April 4, 2017 Lion announced an agreement for the Ventures Group to acquire GCI and split-off the combined company (“GCI-Lion”) from Lion/Queen Lion acquires GCI in a $2.68bn enterprise value transaction Transaction structured so that Lion contributes assets to a new entity, GCI-Lion, in exchange for ~77% ownership (84% voting) — GCI shareholders receives $32.50 / share ($27.50 / share of common GCI-Lion stock and $5.00 / share of new voting preferred stock) Reattribute exchangeable bonds, ILG shares, portfolio of Green Energy Investments and cash to Queen Group pre-closing in a value neutral exchanges Lion will pursue tax-free separation of its stake in GCI-Lion by redeeming Ventures Group tracking stock for GCI-Lion shares Remaining Lion entity will be renamed Queen GCI-Lion and Queen Group will trade as separate asset based stocks Pre-Transaction Lion Interactive (Tracking Stock) (Tracking Stock) evite Giggle Other Private Assets Charter Comm. Lion Broadband LendingTree FTD ILG Green Energy Investments Exchangeable Bonds Post-Transaction Reattributed along with ~$329mm of cash Queen Group (Asset Backed Stock) GCI-Lion (Asset Backed Stock) GCI Charter Communications Lion Broadband LendingTree FTD evite Giggle Other private assets Green Energy Investments Exchange-able Bonds 27 Source: Public filings and presentations.
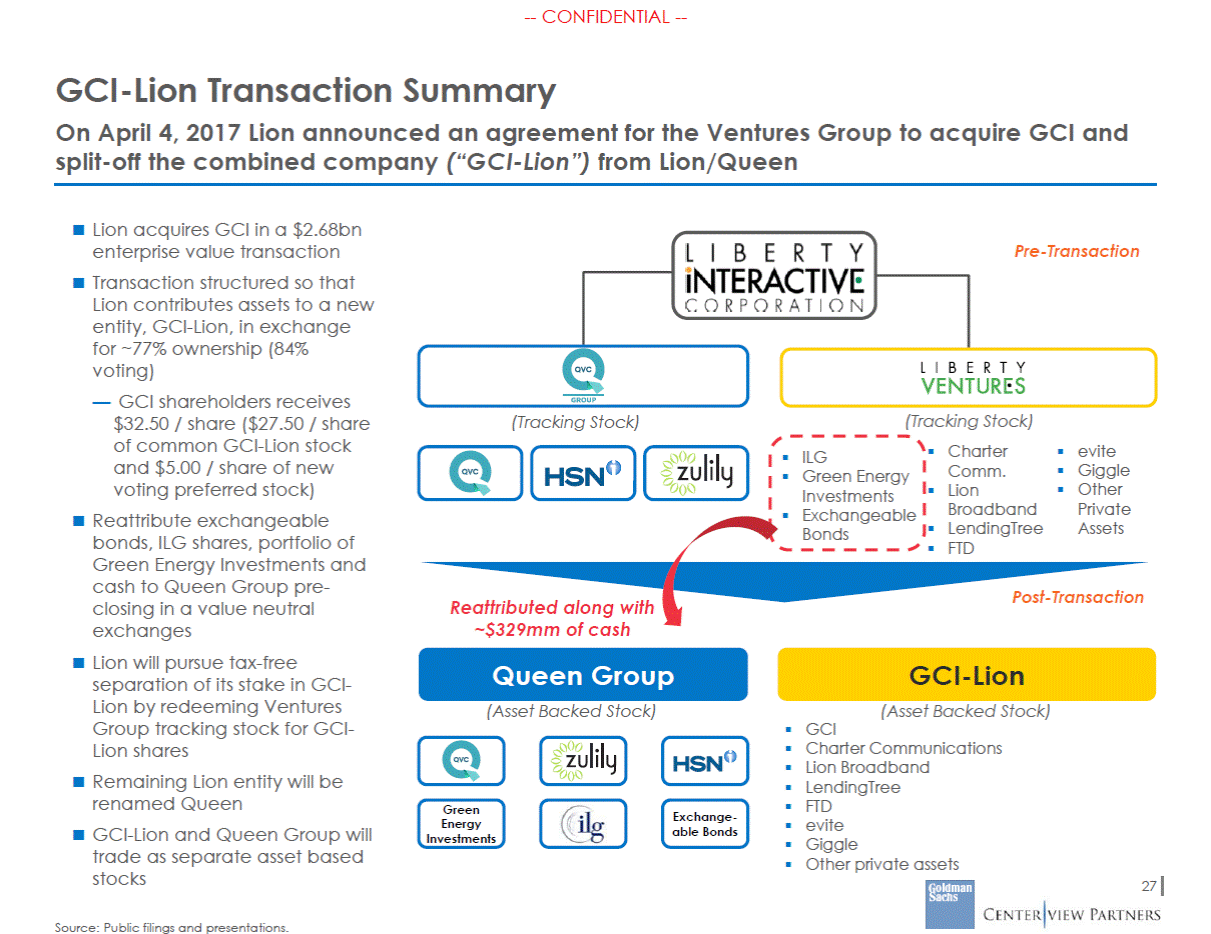
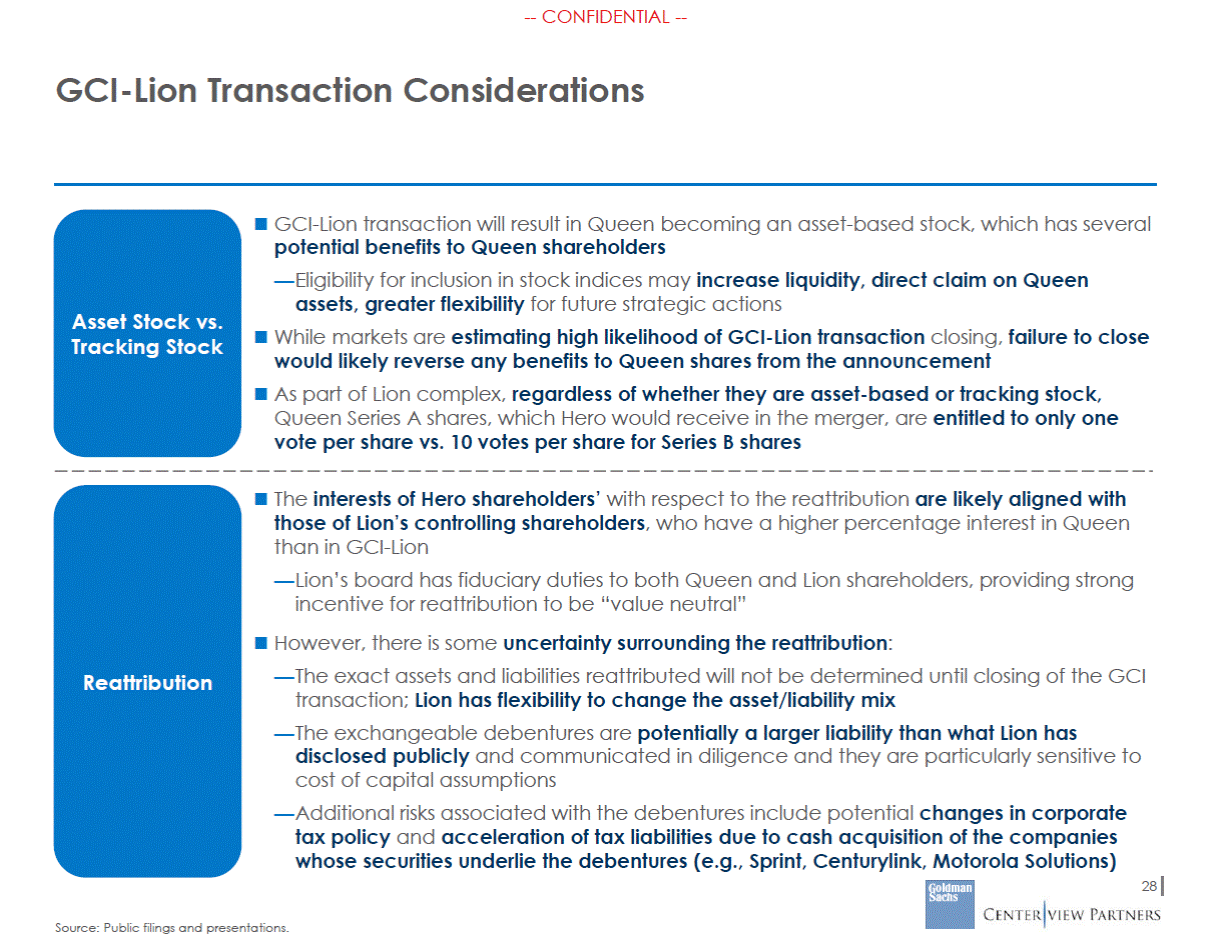
--CONFIDENTIAL --GCI-Lion Transaction Considerations GCI-Lion transaction will result in Queen becoming an asset-based stock, which has several potential benefits to Queen shareholders —Eligibility for inclusion in stock indices may increase liquidity, direct claim on Queen assets, greater flexibility for future strategic actions While markets are estimating high likelihood of GCI-Lion transaction closing, failure to close would likely reverse any benefits to Queen shares from the announcement As part of Lion complex, regardless of whether they are asset-based or tracking stock, Queen Series A shares, which Hero would receive in the merger, are entitled to only one vote per share vs. 10 votes per share for Series B shares Asset Stock vs. Tracking Stock The interests of Hero shareholders’ with respect to the reattribution are likely aligned with those of Lion’s controlling shareholders, who have a higher percentage interest in Queen than in GCI-Lion —Lion’s board has fiduciary duties to both Queen and Lion shareholders, providing strong incentive for reattribution to be “value neutral” However, there is some uncertainty surrounding the reattribution: —The exact assets and liabilities reattributed will not be determined until closing of the GCI transaction; Lion has flexibility to change the asset/liability mix —The exchangeable debentures are potentially a larger liability than what Lion has disclosed publicly and communicated in diligence and they are particularly sensitive to cost of capital assumptions —Additional risks associated with the debentures include potential changes in corporate tax policy and acceleration of tax liabilities due to cash acquisition of the companies whose securities underlie the debentures (e.g., Sprint, Centurylink, Motorola Solutions) Reattribution 28 Source: Public filings and presentations.
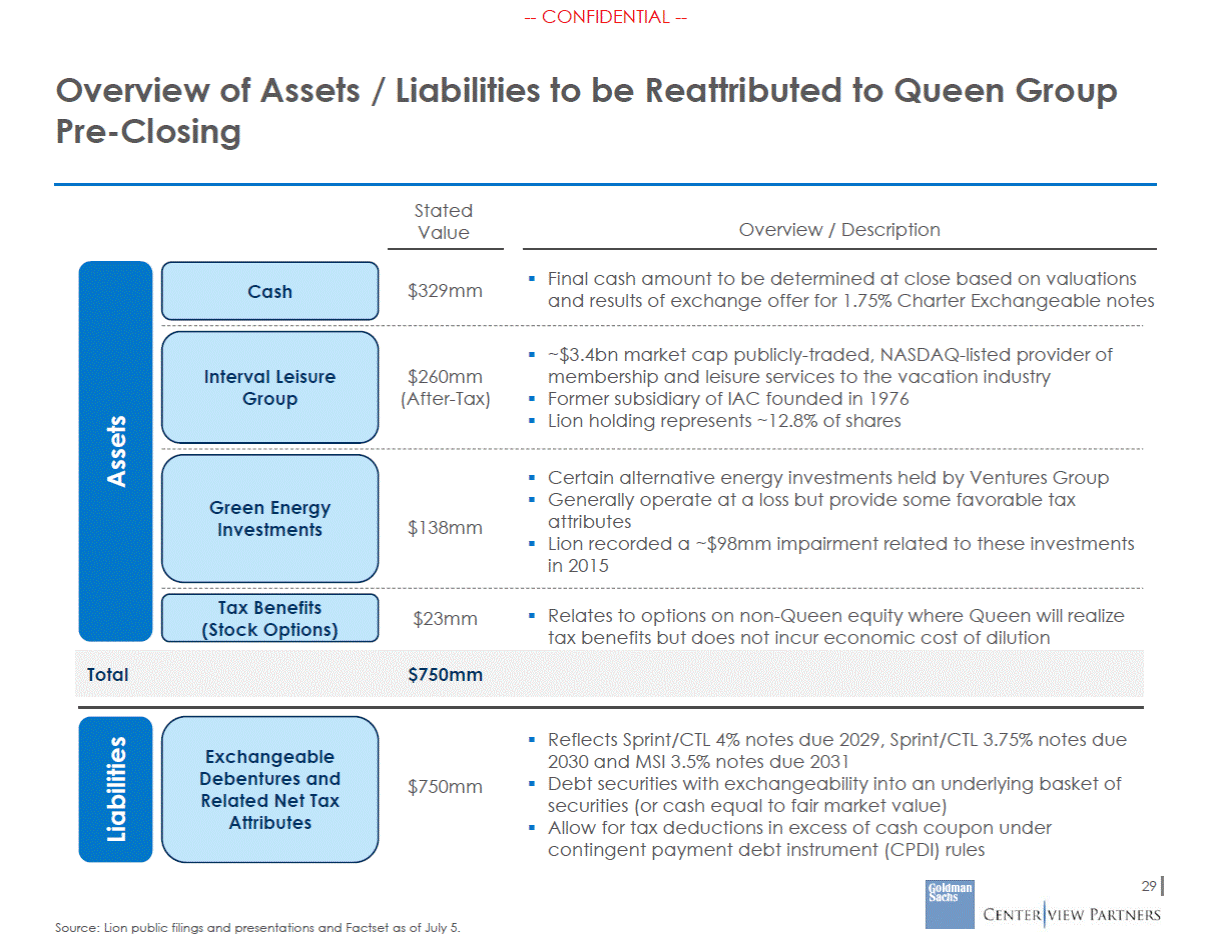
--CONFIDENTIAL --Overview of Assets Pre-Closing / Liabilities to be Reattributed to Queen Group Stated Value Overview / Description Final cash amount to be determined at close based on valuations and results of exchange offer for 1.75% Charter Exchangeable notes $329mm Cash ~$3.4bn market cap publicly-traded, NASDAQ-listed provider of membership and leisure services to the vacation industry Former subsidiary of IAC founded in 1976 Lion holding represents ~12.8% of shares Interval Leisure Group $260mm (After-Tax) Certain alternative energy investments held by Ventures Group Generally operate at a loss but provide some favorable tax attributes Lion recorded a ~$98mm impairment related to these investments in 2015 Green Energy Investments $138mm Tax Benefits (Stock Options) Relates to options on non-Queen equity where Queen will realize tax benefits but does not incur economic cost of dilution $23mm Reflects Sprint/CTL 4% notes due 2029, Sprint/CTL 3.75% notes due 2030 and MSI 3.5% notes due 2031 Debt securities with exchangeability into an underlying basket of securities (or cash equal to fair market value) Allow for tax deductions in excess of cash coupon under contingent payment debt instrument (CPDI) rules Exchangeable Debentures and Related Net Tax Attributes $750mm 29 Source: Lion public filings and presentations and Factset as of July 5. Liabilities Assets Total$750mm
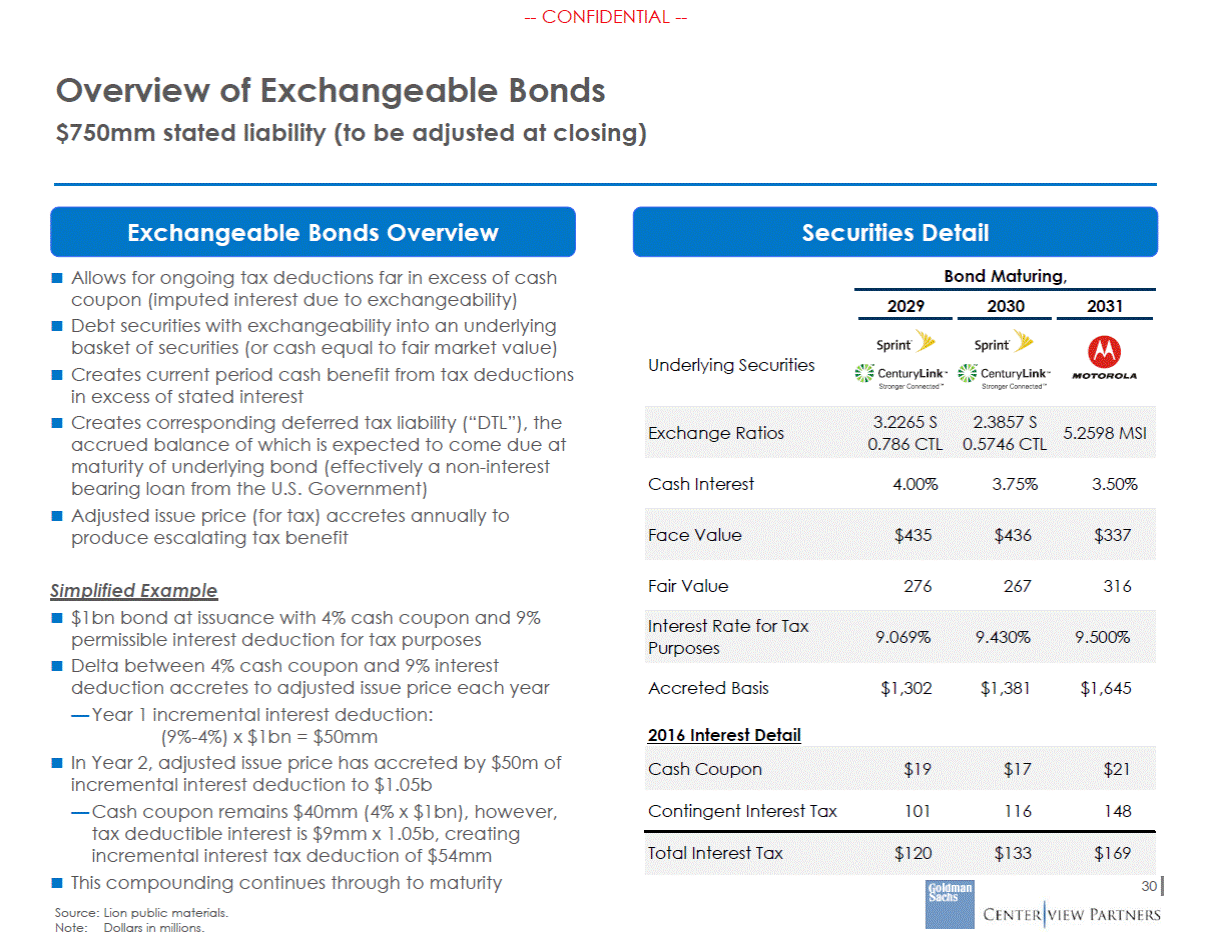
--CONFIDENTIAL --Overview of Exchangeable Bonds $750mm stated liability (to be adjusted at closing) Exchangeable Bonds Overview Allows for ongoing tax deductions far in excess of cash coupon (imputed interest due to exchangeability) Debt securities with exchangeability into an underlying basket of securities (or cash equal to fair market value) Creates current period cash benefit from tax deductions in excess of stated interest Creates corresponding deferred tax liability (“DTL”), the accrued balance of which is expected to come due at maturity of underlying bond (effectively a non-interest bearing loan from the U.S. Government) Adjusted issue price (for tax) accretes annually to produce escalating tax benefit Securities Detail Bond Maturing, 2029 2030 2031 Underlying Securities Cash Interest 4.00% 3.75% 3.50% Fair Value 276 267 316 Simplified Example $1bn bond at issuance with 4% cash coupon and 9% permissible interest deduction for tax purposes Delta between 4% cash coupon and 9% interest deduction accretes to adjusted issue price each year — Year 1 incremental interest deduction: (9%-4%) x $1bn = $50mm In Year 2, adjusted issue price has accreted by $50m of incremental interest deduction to $1.05b — Cash coupon remains $40mm (4% x $1bn), however, tax deductible interest is $9mm x 1.05b, creating incremental interest tax deduction of $54mm This compounding continues through to maturity Source: Lion public materials. Note:Dollars in millions. Accreted Basis $1,302 $1,381 $1,645 2016 Interest Detail Contingent Interest Tax 101 116 148 30 Total Interest Tax$120$133$169 Cash Coupon$19$17$21 Interest Rate for Tax Purposes9.069%9.430%9.500% Face Value$435$436$337 Exchange Ratios3.2265 S2.3857 S 0.786 CTL0.5746 CTL5.2598 MSI
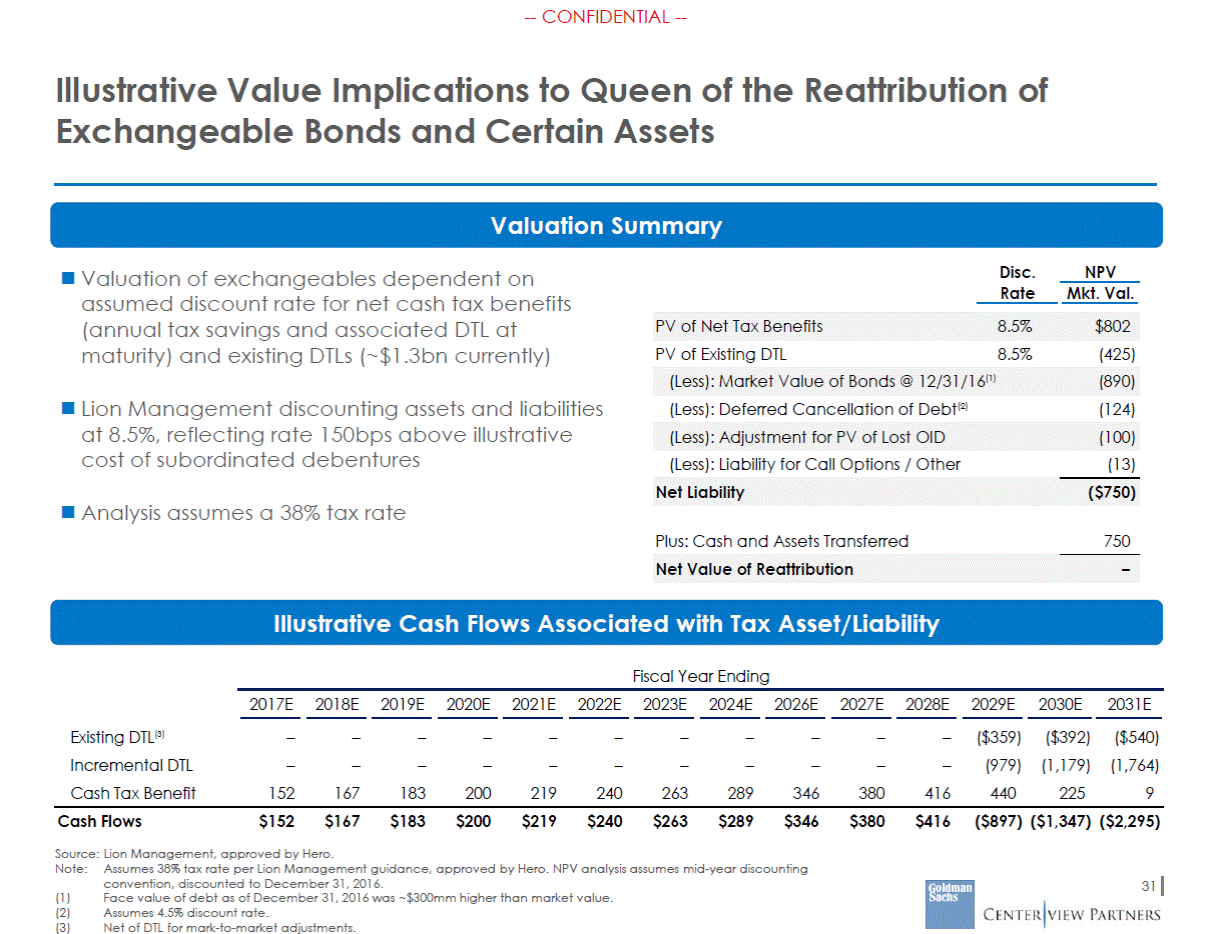
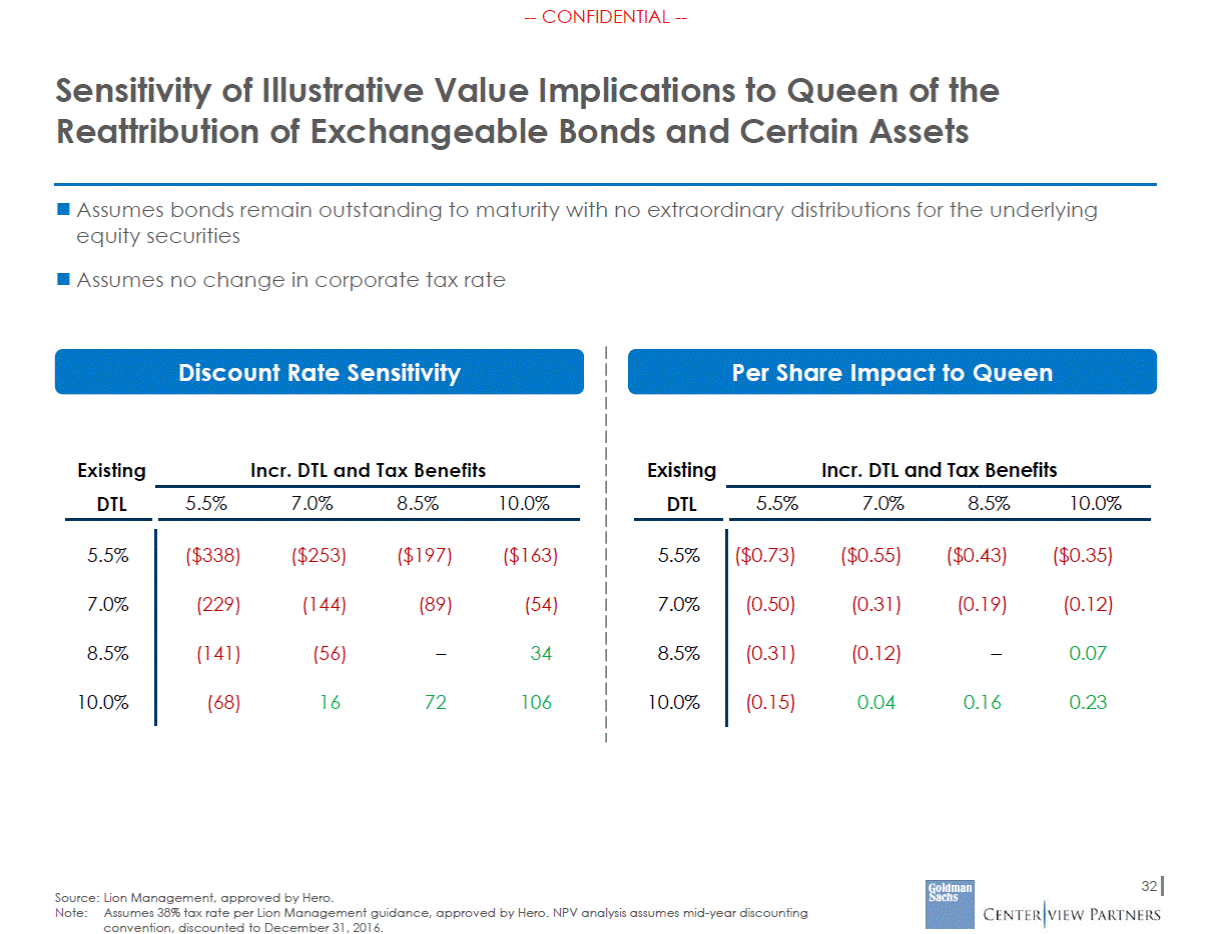
--CONFIDENTIAL --Illustrative Value Implications to Queen of the Exchangeable Bonds and Certain Assets Reattribution of Valuation Summary Disc. Rate NPV Valuation of exchangeables dependent on assumed discount rate for net cash tax benefits (annual tax savings and associated DTL at maturity) and existing DTLs (~$1.3bn currently) Mkt. Val. PV of Existing DTL 8.5% (425) Lion Management discounting assets and liabilities at 8.5%, reflecting rate 150bps above illustrative cost of subordinated debentures (Less): Deferred Cancellation of Debt(2) (124) (Less): Liability for Call Options / Other (13) Analysis assumes a 38% tax rate Plus: Cash and Assets Transferred 750 Illustrative Cash Flows Associated with Tax Asset/Liability Fiscal Year Ending 2017E 2018E 2019E 2020E 2021E 2022E 2023E 2024E 2026E 2027E 2028E 2029E 2030E 2031E Existing DTL(3) Incremental DTL Cash Tax Benefit – – 152 – – 167 – – 183 – – 200 – – 219 – – 240 – – 263 – – 289 – – 346 – – 380 – – 416 ($359) (979) 440 ($392) (1,179) 225 ($540) (1,764) 9 Cash Flows $152 $167 $183 $200 $219 $240 $263 $289 $346 $380 $416 ($897) ($1,347) ($2,295) Source: Lion Management, approved by Hero. Note: Assumes 38% tax rate per Lion Management guidance, approved by Hero. NPV analysis assumes mid-year discounting convention, discounted to December 31, 2016. Face value of debt as of December 31, 2016 was ~$300mm higher than market value. Assumes 4.5% discount rate. Net of DTL for mark-to-market adjustments. 31 (1) (2) (3) Net Value of Reattribution– Net Liability($750) (Less): Adjustment for PV of Lost OID(100) (Less): Market Value of Bonds @ 12/31/16(1)(890) PV of Net Tax Benefits8.5%$802
--CONFIDENTIAL --Sensitivity of Illustrative Value Implications to Queen of the Reattribution of Exchangeable Bonds and Certain Assets Assumes bonds remain outstanding to maturity with no extraordinary distributions for the underlying equity securities Assumes no change in corporate tax rate Discount Rate Sensitivity Per Share Impact to Queen Existing DTL Incr. DTL and Tax Benefits Existing DTL Incr. DTL and Tax Benefits 5.5% 7.0% 8.5% 10.0% 5.5% 7.0% 8.5% 10.0% 5.5% ($338) ($253) ($197) ($163) 5.5% ($0.73) ($0.55) ($0.43) ($0.35) 7.0% (229) (144) (89) (54) 7.0% (0.50) (0.31) (0.19) (0.12) 8.5% (141) (56) – 34 8.5% (0.31) (0.12) – 0.07 10.0% (68) 16 72 106 10.0% (0.15) 0.04 0.16 0.23 32 Source: Lion Management, approved by Hero. Note:Assumes 38% tax rate per Lion Management guidance, approved by Hero. NPV analysis assumes mid-year discounting convention, discounted to December 31, 2016.
Financial Analysis Detail Section 6
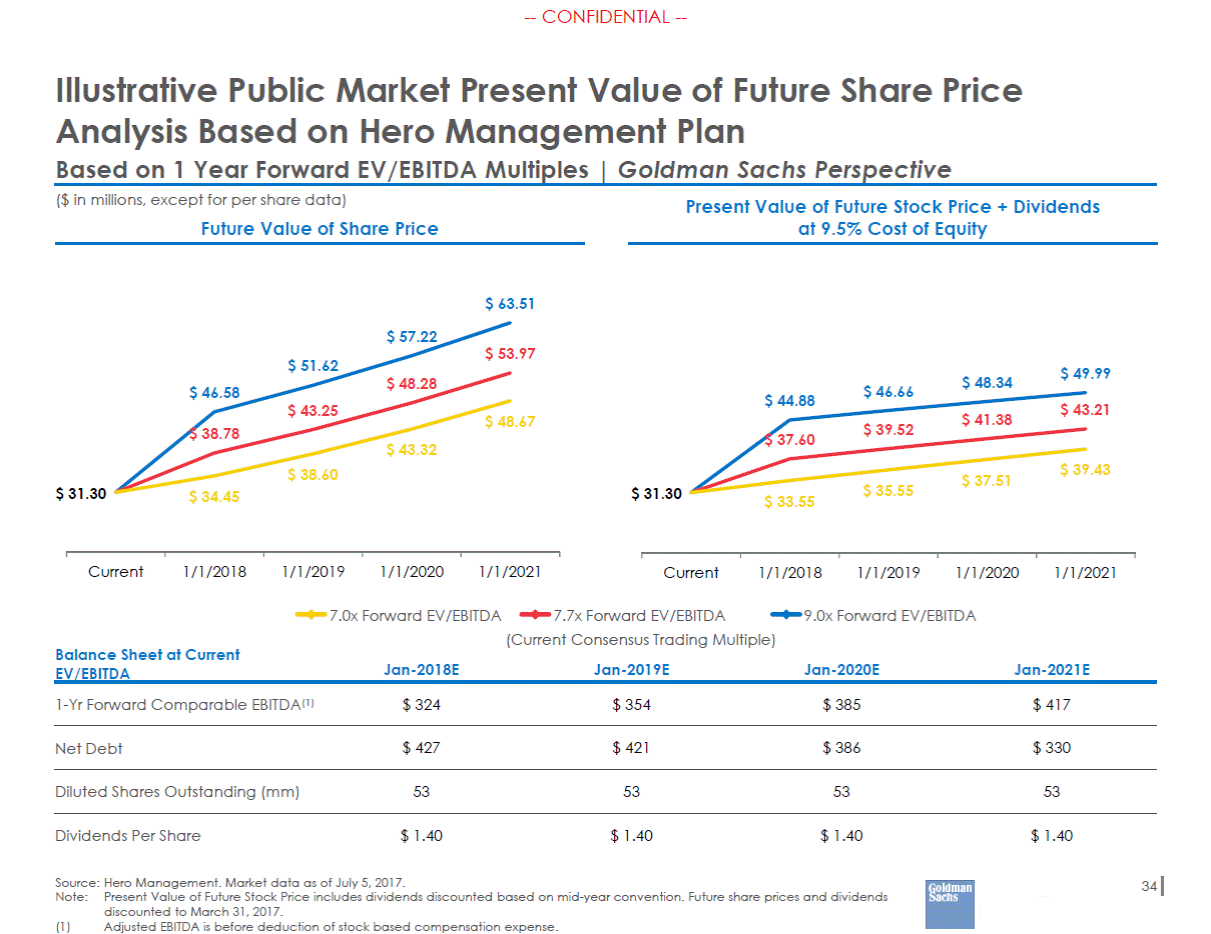
--CONFIDENTIAL --Illustrative Public Market Present Value of Future Share Price Analysis Based on Hero Management Plan Based on 1 Year Forward EV/EBITDA Multiples | Goldman Sachs Perspective ($ in millions, except for per share data) Future Value of Share Price Present Value of Future Stock Price + Dividends at 9.5% Cost of Equity $ 63.51 $ 57.22 $ 53.97 $ 51.62 $ 49.99 $ 48.28 $ 48.34 $ 46.66 $ 46.58 $ 44.88 $ 43.25 $ 43.21 $ 41.38 $ 48.67 $ 39.52 $ 38.78 $ 37.60 $ 43.32 $ 39.43 $ 38.60 $ 37.51 $ 35.55 $ 31.30 $ 31.30 $ 34.45 $ 33.55 Current 1/1/2018 1/1/2019 1/1/2020 1/1/2021 Current 1/1/2018 1/1/2019 1/1/2020 1/1/2021 7.0x Forward EV/EBITDA 7.7x Forward EV/EBITDA 9.0x Forward EV/EBITDA (Current Consensus Trading Multiple) Jan-2019E Balance Sheet at Current EV/EBITDA Jan-2018E Jan-2020E Jan-2021E 1-Yr Forward Comparable EBITDA(1) $ 324 $ 354 $ 385 $ 417 Net Debt $ 427 $ 421 $ 386 $ 330 Diluted Shares Outstanding (mm) 53 53 53 53 $ 1.40 $ 1.40 $ 1.40 $ 1.40 Dividends Per Share Source: Hero Management. Market data as of July 5, 2017. Note:Present Value of Future Stock Price includes dividends discounted based on mid-year convention. Future share prices and dividends discounted to March 31, 2017. 34 (1) Adjusted EBITDA is before deduction of stock based compensation expense.
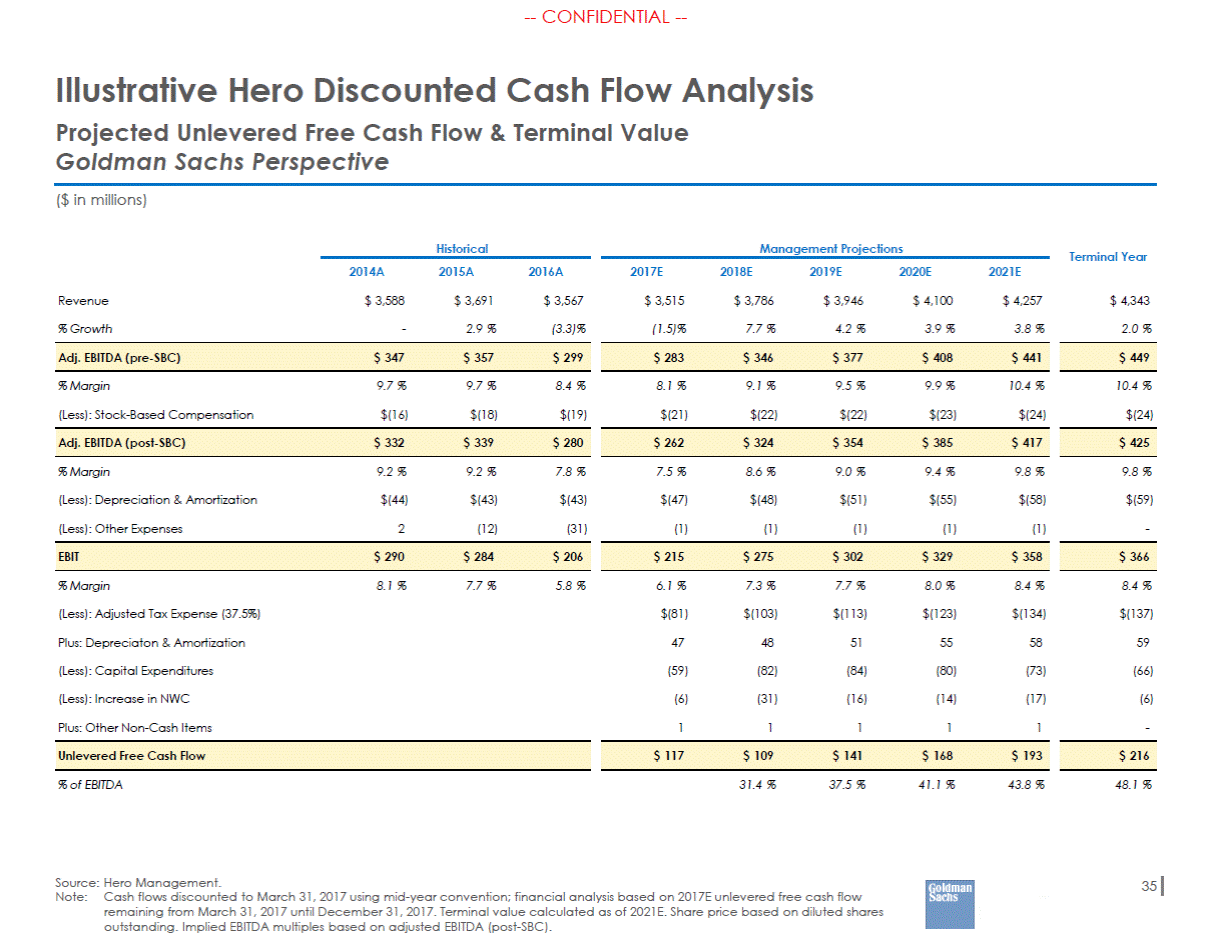
--CONFIDENTIAL --Illustrative Hero Discounted Cash Flow Analysis Projected Unlevered Free Cash Flow & Terminal Value Goldman Sachs Perspective ($ in millions) Historical Management Projections Terminal Year 2014A 2015A 2016A 2017E 2018E 2019E 2020E 2021E Revenue $ 3,588 $ 3,691 $ 3,567 $ 3,515 $ 3,786 $ 3,946 $ 4,100 $ 4,257 $ 4,343 % Growth - 2.9 % (3.3)% (1.5)% 7.7 % 4.2 % 3.9 % 3.8 % 2.0 % % Margin 9.7 % 9.7 % 8.4 % 8.1 % 9.1 % 9.5 % 9.9 % 10.4 % 10.4 % (Less): Stock-Based Compensation $(16) $(18) $(19) $(21) $(22) $(22) $(23) $(24) $(24) % Margin 9.2 % 9.2 % 7.8 % 7.5 % 8.6 % 9.0 % 9.4 % 9.8 % 9.8 % (Less): Depreciation & Amortization $(44) $(43) $(43) $(47) $(48) $(51) $(55) $(58) $(59) (Less): Other Expenses 2 (12) (31) (1) (1) (1) (1) (1) - % Margin 8.1 % 7.7 % 5.8 % 6.1 % 7.3 % 7.7 % 8.0 % 8.4 % 8.4 % (Less): Adjusted Tax Expense (37.5%) $(81) $(103) $(113) $(123) $(134) $(137) Plus: Depreciaton & Amortization 47 48 51 55 58 59 (Less): Capital Expenditures (59) (82) (84) (80) (73) (66) (Less): Increase in NWC (6) (31) (16) (14) (17) (6) Plus: Other Non-Cash Items 1 1 1 1 1 - % of EBITDA 31.4 % 37.5 % 41.1 % 43.8 % 48.1 % Source: Hero Management. Note:Cash flows discounted to March 31, 2017 using mid-year convention; financial analysis based on 2017E unlevered free cash flow remaining from March 31, 2017 until December 31, 2017. Terminal value calculated as of 2021E. Share price based on diluted shares outstanding. Implied EBITDA multiples based on adjusted EBITDA (post-SBC). 35 $ 216 $ 117 $ 109 $ 141 $ 168 $ 193 Unlevered Free Cash Flow $ 366 $ 215 $ 275 $ 302 $ 329 $ 358 EBIT $ 290 $ 284 $ 206 $ 425 $ 262 $ 324 $ 354 $ 385 $ 417 Adj. EBITDA (post-SBC) $ 332 $ 339 $ 280 $ 449 $ 283 $ 346 $ 377 $ 408 $ 441 Adj. EBITDA (pre-SBC) $ 347 $ 357 $ 299
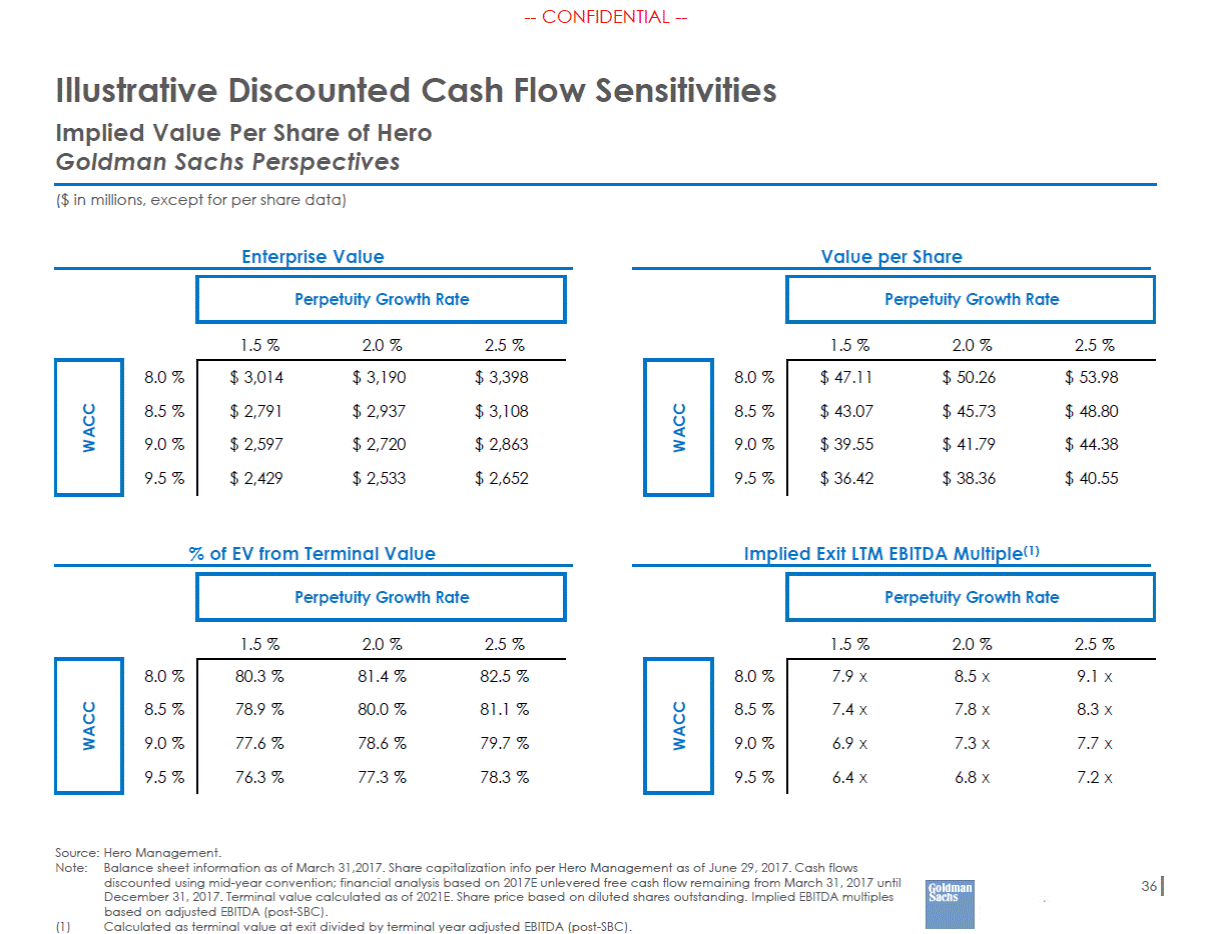
--CONFIDENTIAL --Illustrative Discounted Cash Flow Implied Value Per Share of Hero Goldman Sachs Perspectives Sensitivities ($ in millions, except for per share data) Enterprise Value Value per Share 1.5 % 2.0 % 2.5 % 1.5 % 2.0 % 2.5 % 8.0 % 8.0 % 8.5 % 8.5 % 9.0 % 9.0 % 9.5 % 9.5 % Implied Exit LTM EBITDA Multiple(1) % of EV from Terminal Value 1.5 % 2.0 % 2.5 % 1.5 % 2.0 % 2.5 % 8.0 % 8.0 % 8.5 % 8.5 % 9.0 % 9.0 % 9.5 % 9.5 % Source: Hero Management. Note:Balance sheet information as of March 31,2017. Share capitalization info per Hero Management as of June 29, 2017. Cash flows discounted using mid-year convention; financial analysis based on 2017E unlevered free cash flow remaining from March 31, 2017 until December 31, 2017. Terminal value calculated as of 2021E. Share price based on diluted shares outstanding. Implied EBITDA multiples based on adjusted EBITDA (post-SBC). 36 (1) Calculated as terminal value at exit divided by terminal year adjusted EBITDA (post-SBC). 7.9 x 8.5 x 9.1 x 7.4 x 7.8 x 8.3 x 6.9 x 7.3 x 7.7 x 6.4 x 6.8 x 7.2 x WACC 80.3 % 81.4 % 82.5 % 78.9 % 80.0 % 81.1 % 77.6 % 78.6 % 79.7 % 76.3 % 77.3 % 78.3 % WACC Perpetuity Growth Rate Perpetuity Growth Rate $ 47.11 $ 50.26 $ 53.98 $ 43.07 $ 45.73 $ 48.80 $ 39.55 $ 41.79 $ 44.38 $ 36.42 $ 38.36 $ 40.55 WACC $ 3,014 $ 3,190 $ 3,398 $ 2,791 $ 2,937 $ 3,108 $ 2,597 $ 2,720 $ 2,863 $ 2,429 $ 2,533 $ 2,652 WACC Perpetuity Growth Rate Perpetuity Growth Rate
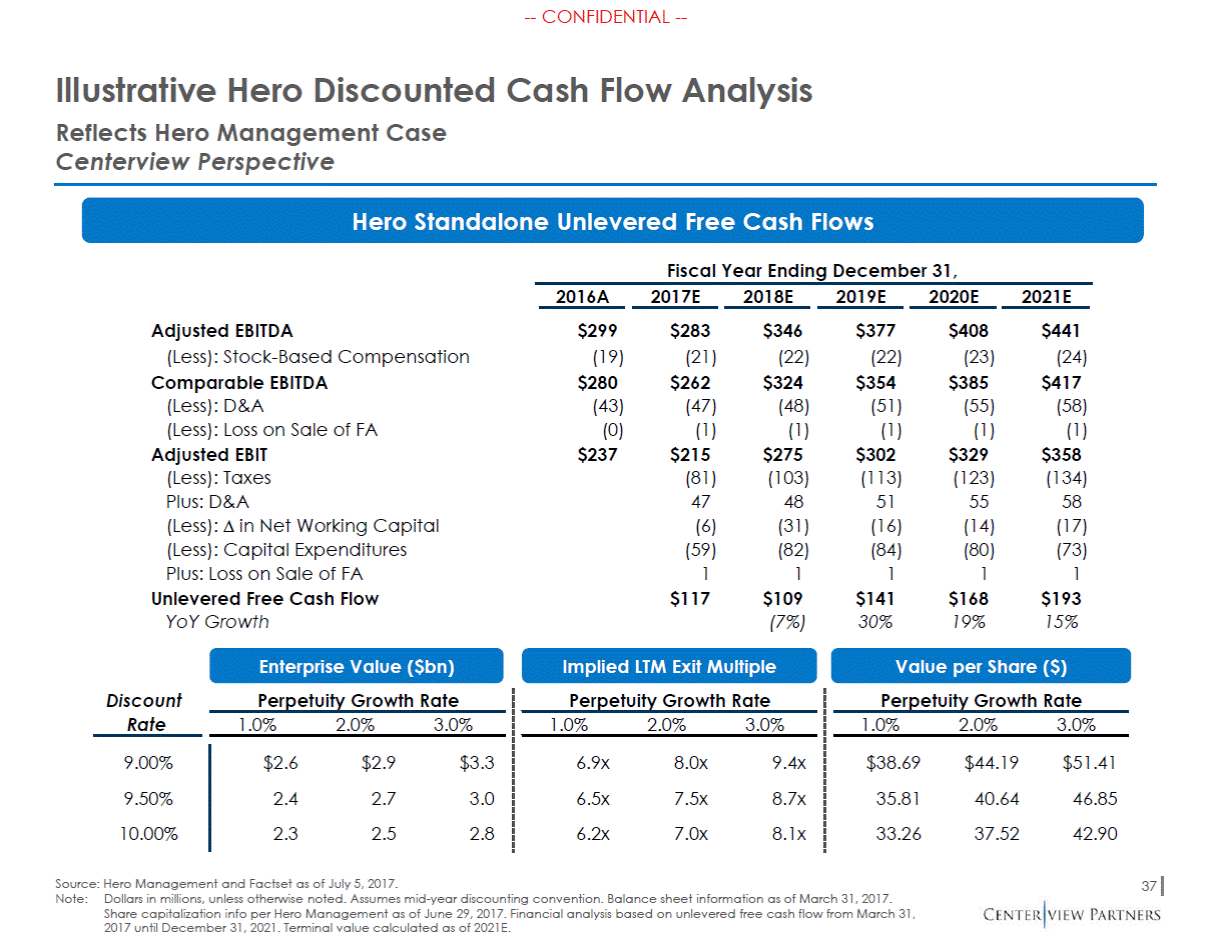
--CONFIDENTIAL --Illustrative Hero Discounted Cash Flow Analysis Reflects Hero Management Case Centerview Perspective Hero Standalone Unlevered Free Cash Flows Fiscal Year Ending December 31, 2016A 2017E 2018E 2019E 2020E 2021E Adjusted EBITDA (Less): Stock-Based Compensation Comparable EBITDA (Less): D&A (Less): Loss on Sale of FA Adjusted EBIT (Less): Taxes Plus: D&A (Less): in Net Working Capital (Less): Capital Expenditures Plus: Loss on Sale of FA Unlevered Free Cash Flow YoY Growth $299 (19) $280 (43) (0) $237 $283 (21) $262 (47) (1) $215 (81) 47 (6) (59) 1 $117 $346 (22) $324 (48) (1) $275 (103) 48 (31) (82) 1 $109 (7%) $377 (22) $354 (51) (1) $302 (113) 51 (16) (84) 1 $141 30% $408 (23) $385 (55) (1) $329 (123) 55 (14) (80) 1 $168 19% $441 (24) $417 (58) (1) $358 (134) 58 (17) (73) 1 $193 15% Enterprise Value ($bn) Perpetuity Growth Rate Implied LTM Exit Multiple Perpetuity Growth Rate Value per Share ($) Perpetuity Growth Rate Discount Rate 1.0% 2.0% 3.0% 1.0% 2.0% 3.0% 1.0% 2.0% 3.0% 9.00% 9.50% 10.00% $2.6 2.4 2.3 $2.9 2.7 2.5 $3.3 3.0 2.8 6.9x 6.5x 6.2x 8.0x 7.5x 7.0x 9.4x 8.7x 8.1x $38.69 35.81 33.26 $44.19 40.64 37.52 $51.41 46.85 42.90 Source: Hero Management and Factset as of July 5, 2017. Note:Dollars in millions, unless otherwise noted. Assumes mid-year discounting convention. Balance sheet information as of March 31, 2017. 37 Share capitalization info per Hero Management as of June 29, 2017. Financial analysis based on unlevered free cash flow from March 31, 2017 until December 31, 2021. Terminal value calculated as of 2021E.
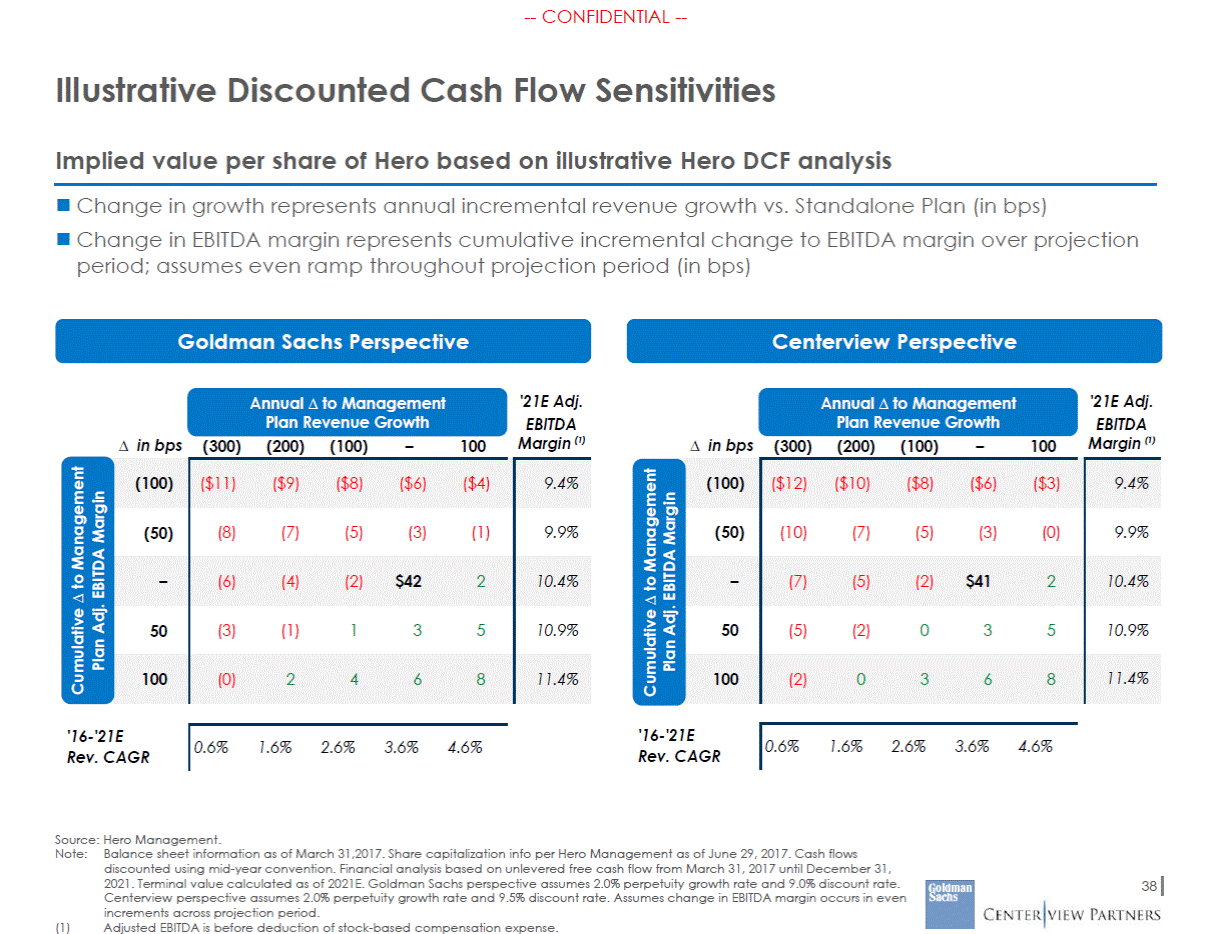
--CONFIDENTIAL --Illustrative Discounted Cash Flow Sensitivities Implied value per share of Hero based on illustrative Hero DCF analysis Change in growth represents annual incremental revenue growth vs. Standalone Plan (in bps) Change in EBITDA margin represents cumulative incremental change to EBITDA margin over projection period; assumes even ramp throughout projection period (in bps) Goldman Sachs Perspective Centerview Perspective '21E Adj. EBITDA Margin (1) '21E Adj. EBITDA Margin (1) Annual to Management Plan Revenue Growth Annual to Management Plan Revenue Growth in bps (300) (200) (100) – 100 in bps (300) (200) (100) – 100 '16-'21E Rev. CAGR '16-'21E Rev. CAGR Source: Hero Management. Note:Balance sheet information as of March 31,2017. Share capitalization info per Hero Management as of June 29, 2017. Cash flows discounted using mid-year convention. Financial analysis based on unlevered free cash flow from March 31, 2017 until December 31, 2021. Terminal value calculated as of 2021E. Goldman Sachs perspective assumes 2.0% perpetuity growth rate and 9.0% discount rate. Centerview perspective assumes 2.0% perpetuity growth rate and 9.5% discount rate. Assumes change in EBITDA margin occurs in even increments across projection period. 38 (1) Adjusted EBITDA is before deduction of stock-based compensation expense. Cumulative to Management Plan Adj. EBITDA Margin Cumulative to Management Plan Adj. EBITDA Margin 0.6% 1.6% 2.6% 3.6% 4.6% 0.6% 1.6% 2.6% 3.6% 4.6% (100) ($11) ($9) ($8) ($6) ($4) 9.4% (50) (8) (7) (5) (3) (1) 9.9% – (6) (4) (2) $42 2 10.4% 50 (3) (1) 1 3 5 10.9% 100 (0) 2 4 6 8 11.4% (100) ($12) ($10) ($8) ($6) ($3) 9.4% (50) (10) (7) (5) (3) (0) 9.9% – (7) (5) (2) $41 2 10.4% 50 (5) (2) 0 3 5 10.9% 100 (2) 0 3 6 8 11.4%
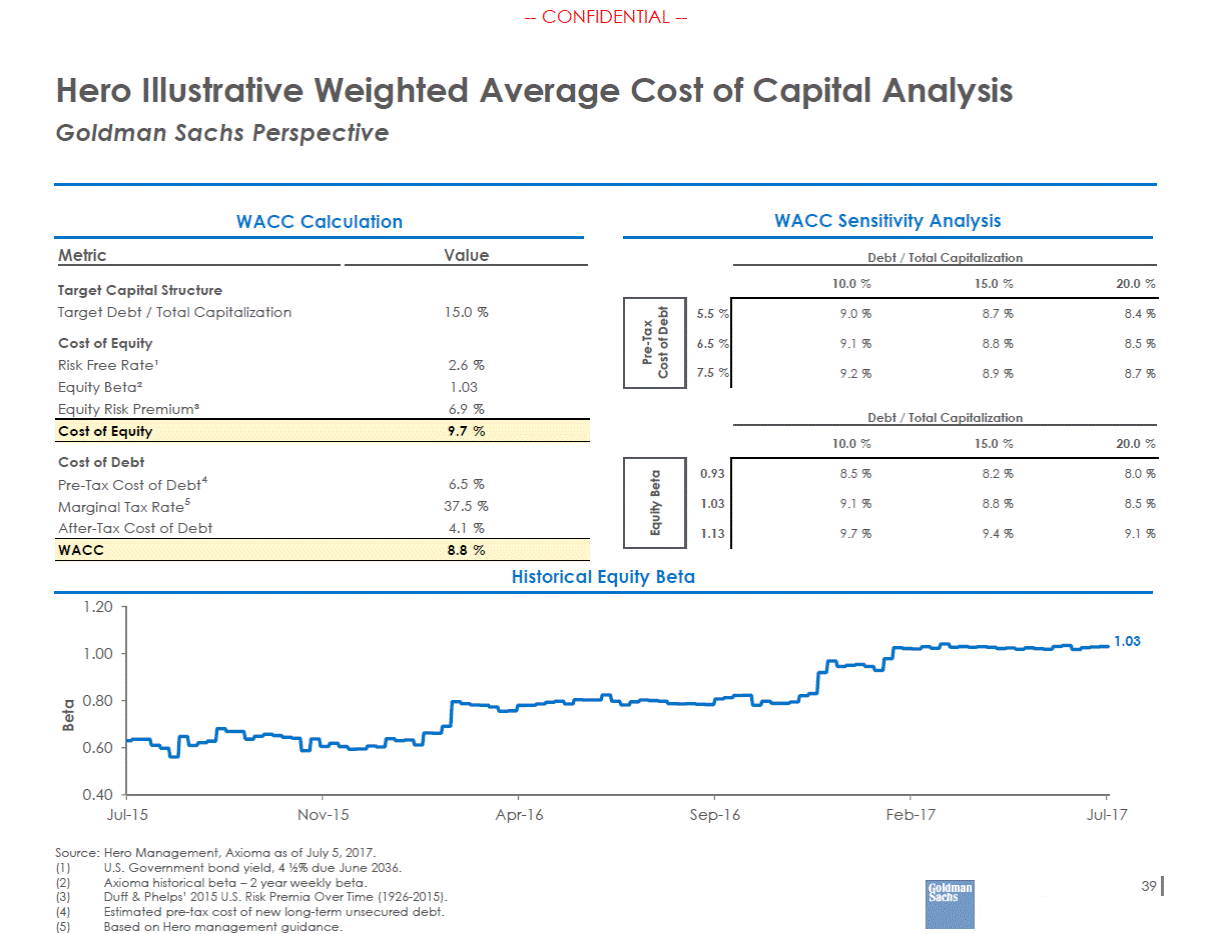
--CONFIDENTIAL --Hero Illustrative Weighted Average Goldman Sachs Perspective Cost of Capital Analysis WACC Calculation WACC Sensitivity Analysis Metric Value Debt / Total Capitalization 10.0 % 15.0 % 20.0 % Target Capital Structure Target Debt / Total Capitalization 15.0 % 5.5 % Cost of Equity Risk Free Rate¹ Equity Beta² Equity Risk Premium³ 6.5 % 2.6 % 1.03 6.9 % 7.5 % Debt / Total Capitalization 10.0 % 15.0 % 20.0 % Cost of Debt Pre-Tax Cost of Debt4 Marginal Tax Rate5 After-Tax Cost of Debt 0.93 6.5 % 37.5 % 4.1 % 1.03 1.13 Historical Equity Beta 1.20 1.03 1.00 0.80 0.60 0.40 Jul-15 Nov-15 Apr-16 Sep-16 Feb-17 Jul-17 Source: Hero Management, Axioma as of July 5, 2017. (1) (2) (3) (4) (5) U.S. Government bond yield, 4 ½% due June 2036. Axioma historical beta – 2 year weekly beta. Duff & Phelps’ 2015 U.S. Risk Premia Over Time (1926-2015). Estimated pre-tax cost of new long-term unsecured debt. Based on Hero management guidance. 39 Beta WACC8.8 % 8.5 %8.2 %8.0 % 9.1 %8.8 %8.5 % 9.7 %9.4 %9.1 % Equity Beta Cost of Equity9.7 % 9.0 %8.7 %8.4 % 9.1 %8.8 %8.5 % 9.2 %8.9 %8.7 % Pre-Tax Cost of Debt
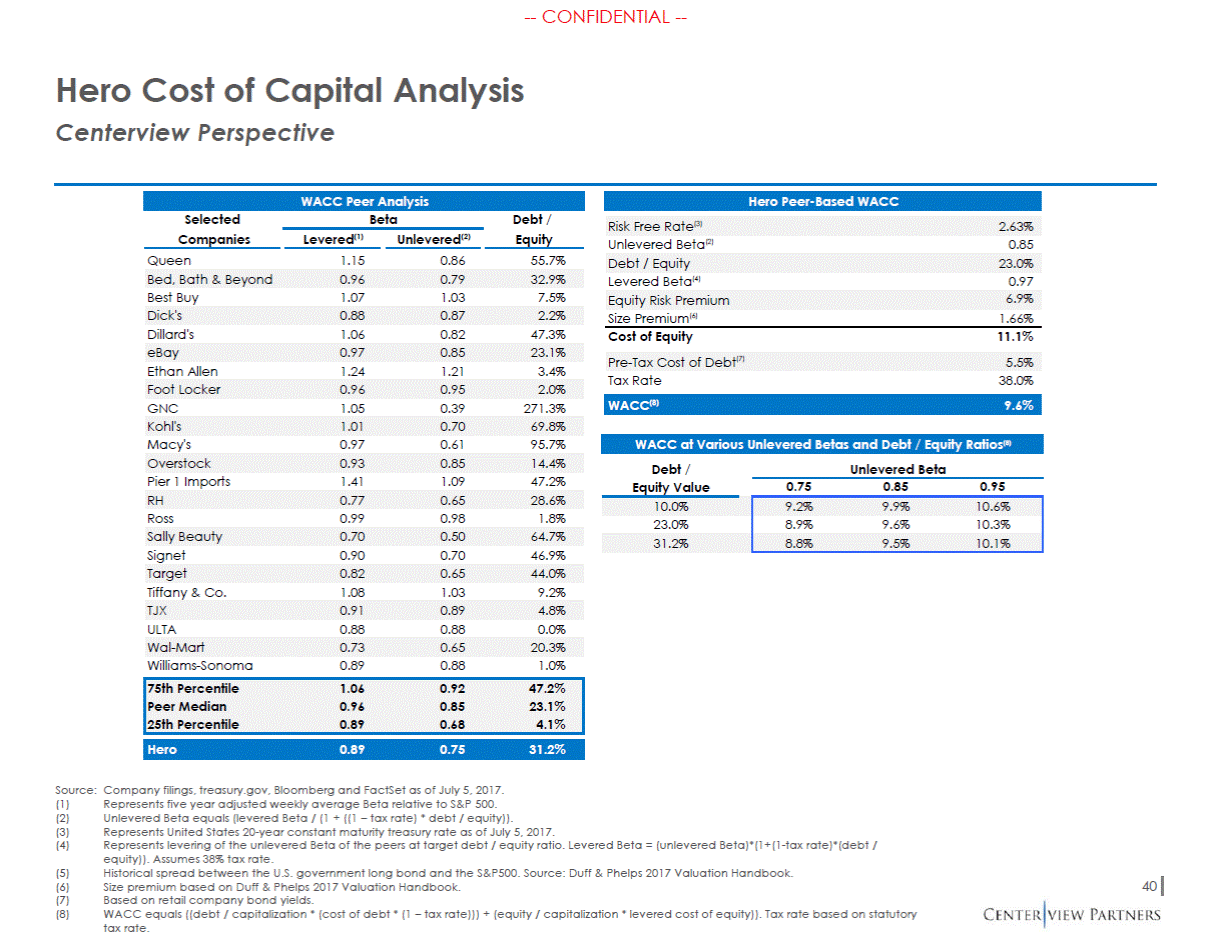
--CONFIDENTIAL --Hero Cost of Capital Analysis Centerview Perspective Selected Beta Debt / Unlevered Beta(2) 0.85 Queen 1.15 0.86 55.7% Levered Beta(4) 0.97 Best Buy 1.07 1.03 7.5% Size Premium(6) 1.66% Dillard's 1.06 0.82 47.3% Cost of Equity 11.1% Ethan Allen 1.24 1.21 3.4% Tax Rate 38.0% GNC 1.05 0.39 271.3% Macy's 0.97 0.61 95.7% Debt / Equity Value Unlevered Beta Pier 1 Imports 1.41 1.09 47.2% 0.75 0.85 0.95 Ross 0.99 0.98 1.8% Signet 0.90 0.70 46.9% Tiffany & Co. 1.08 1.03 9.2% ULTA 0.88 0.88 0.0% Williams-Sonoma 0.89 0.88 1.0% Source: Company filings, treasury.gov, Bloomberg and FactSet as of July 5, 2017. (1) (2) (3) (4) Represents five year adjusted weekly average Beta relative to S&P 500. Unlevered Beta equals (levered Beta / (1 + ((1 – tax rate) * debt / equity)). Represents United States 20-year constant maturity treasury rate as of July 5, 2017. Represents levering of the unlevered Beta of the peers at target debt / equity ratio. Levered Beta = (unlevered Beta)*(1+(1-tax rate)*(debt / equity)). Assumes 38% tax rate. Historical spread between the U.S. government long bond and the S&P500. Source: Duff & Phelps 2017 Valuation Handbook. Size premium based on Duff & Phelps 2017 Valuation Handbook. Based on retail company bond yields. WACC equals ((debt / capitalization * (cost of debt * (1 – tax rate))) + (equity / capitalization * levered cost of equity)). Tax rate based on statutory tax rate. (5) (6) (7) (8) 40 75th Percentile1.060.9247.2% Peer Median0.960.8523.1% 25th Percentile0.890.684.1% Hero0.890.7531.2% Wal-Mart0.730.6520.3% TJX0.910.894.8% Target0.820.6544.0% Sally Beauty0.700.5064.7% 10.0% 9.2%9.9%10.6% 23.0% 8.9%9.6%10.3% 31.2% 8.8%9.5%10.1% RH0.770.6528.6% Overstock0.930.8514.4% WACC at Various Unlevered Betas and Debt / Equity Ratios(8) Kohl's1.010.7069.8% WACC(8)9.6% Foot Locker0.960.952.0% Pre-Tax Cost of Debt(7)5.5% eBay0.970.8523.1% Dick's0.880.872.2% Equity Risk Premium6.9% Bed, Bath & Beyond0.960.7932.9% Debt / Equity23.0% Companies Levered(1) Unlevered(2) Equity Risk Free Rate(3)2.63% WACC Peer Analysis Hero Peer-Based WACC
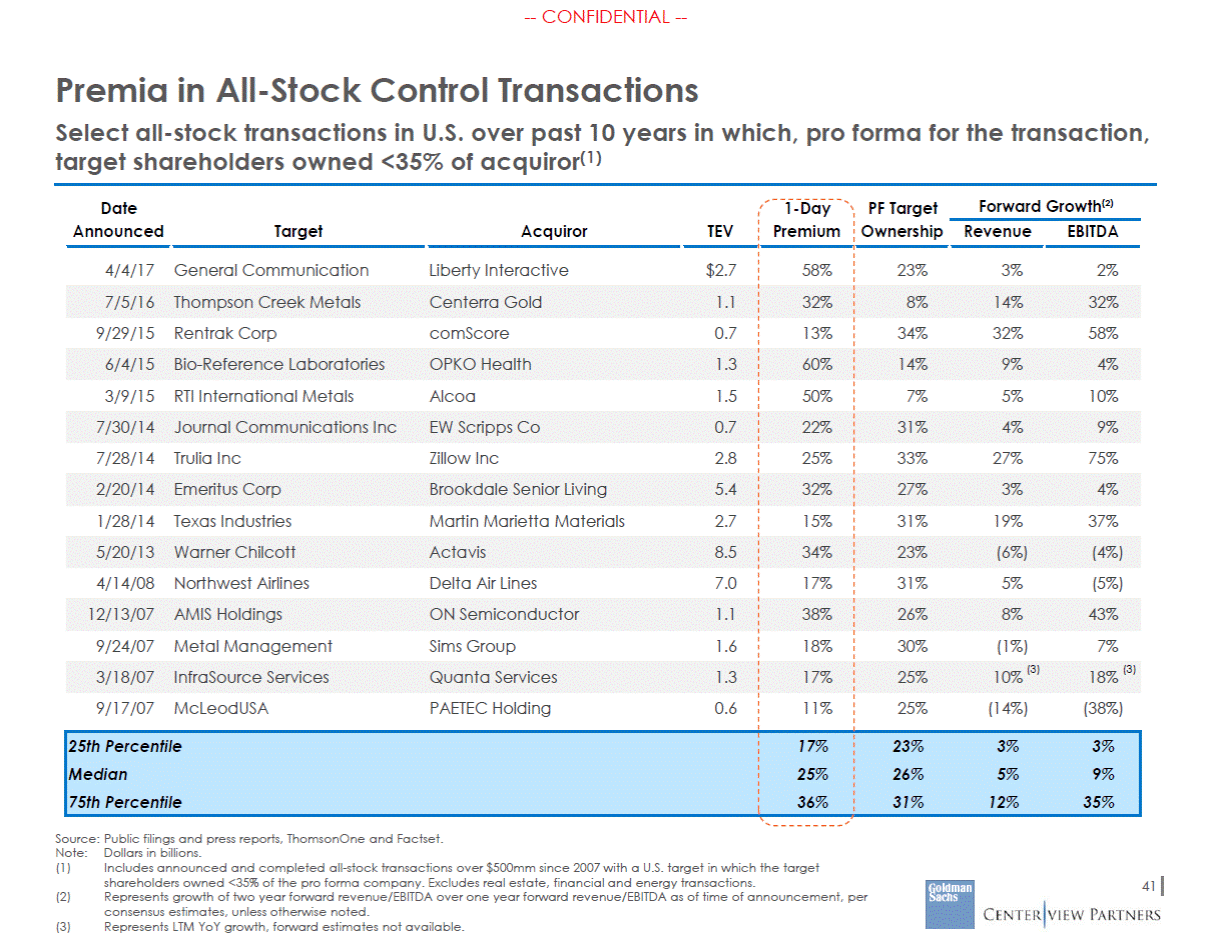
--CONFIDENTIAL --Premia in All-Stock Control Transactions Select all-stock transactions in U.S. over past 10 years in which, pro forma for the transaction, target shareholders owned <35% of acquiror(1) Forward Growth(2) Date Announced 1-Day PF Target Ownership Target Acquiror TEV Premium Revenue EBITDA 4/4/17 General Communication Liberty Interactive $2.7 58% 23% 3% 2% 9/29/15 Rentrak Corp comScore 0.7 13% 34% 32% 58% 3/9/15 RTI International Metals Alcoa 1.5 50% 7% 5% 10% 7/28/14 Trulia Inc Zillow Inc 2.8 25% 33% 27% 75% 1/28/14 Texas Industries Martin Marietta Materials 2.7 15% 31% 19% 37% 4/14/08 Northwest Airlines Delta Air Lines 7.0 17% 31% 5% (5%) 9/24/07 Metal Management Sims Group 1.6 18% 30% (1%) 7% 3/18/07 InfraSource Services Quanta Services 1.3 17% 25% 10% 18% 9/17/07 McLeodUSA PAETEC Holding 0.6 11% 25% (14%) (38%) Source: Public filings and press reports, ThomsonOne and Factset. Note: (1) Dollars in billions. Includes announced and completed all-stock transactions over $500mm since 2007 with a U.S. target in which the target shareholders owned <35% of the pro forma company. Excludes real estate, financial and energy transactions. Represents growth of two year forward revenue/EBITDA over one year forward revenue/EBITDA as of time of announcement, per consensus estimates, unless otherwise noted. Represents LTM YoY growth, forward estimates not available. 41 (2) (3) 25th Percentile17%23%3%3% Median25%26%5%9% 75th Percentile36%31%12%35% (3)(3) 12/13/07AMIS HoldingsON Semiconductor1.138%26%8%43% 5/20/13Warner ChilcottActavis8.534%23%(6%)(4%) 2/20/14Emeritus CorpBrookdale Senior Living5.432%27%3%4% 7/30/14Journal Communications IncEW Scripps Co0.722%31%4%9% 6/4/15Bio-Reference LaboratoriesOPKO Health1.360%14%9%4% 7/5/16Thompson Creek MetalsCenterra Gold1.132%8%14%32%
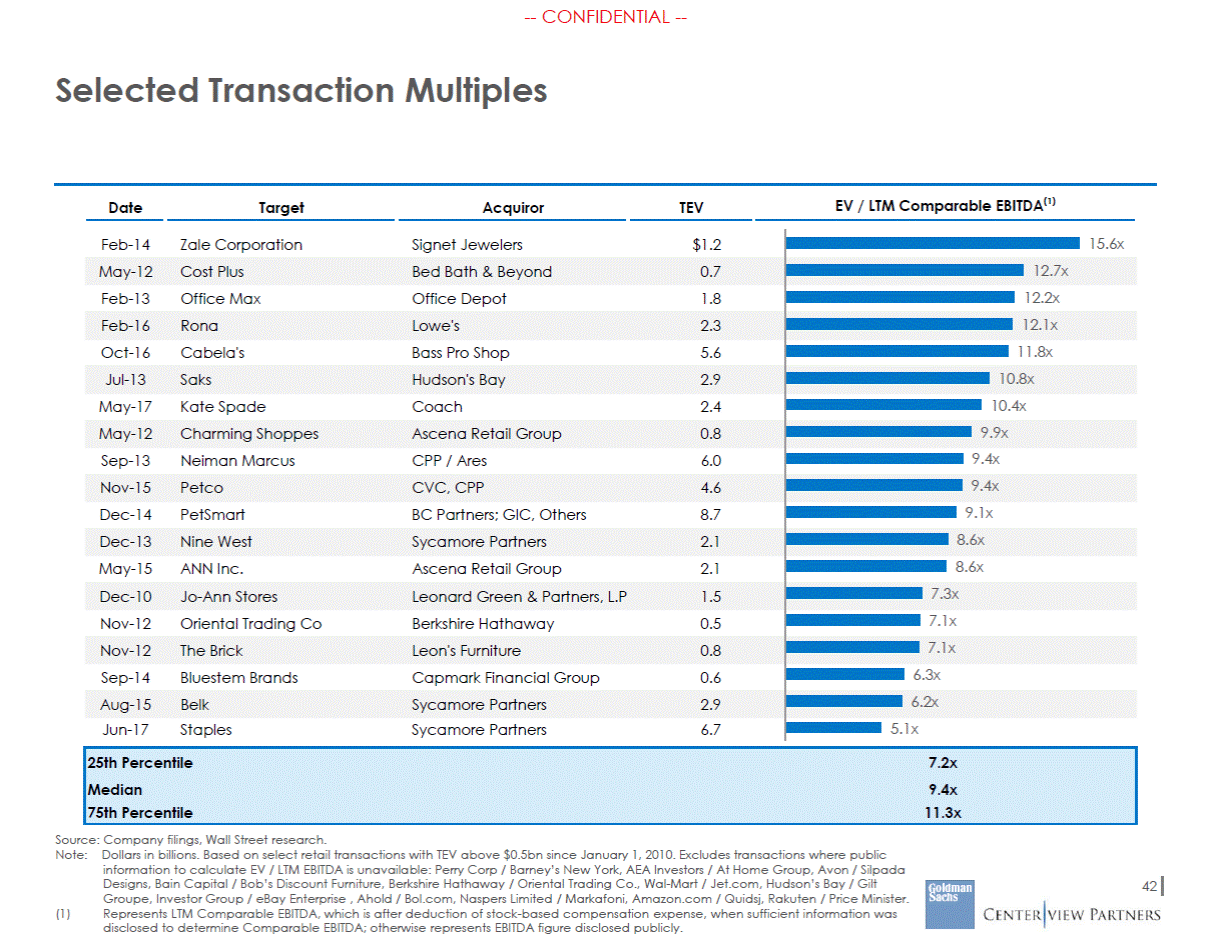
--CONFIDENTIAL --Selected Transaction Multiples EV / LTM Comparable EBITDA(1) Date Target Acquiror TEV 15.6x Feb-14 Zale Corporation Signet Jewelers $1.2 12.7x 12.2x Feb-13 Office Max Office Depot 1.8 12.1x Oct-16 Cabela's Bass Pro Shop 5.6 11.8x 10.8x 10.4x May-17 Kate Spade Coach 2.4 9.9x 9.4x Sep-13 Neiman Marcus CPP / Ares 6.0 9.4x 9.1x Dec-14 PetSmart BC Partners; GIC, Others 8.7 8.6x 8.6x May-15 ANN Inc. Ascena Retail Group 2.1 7.3x 7.1x Nov-12 Oriental Trading Co Berkshire Hathaway 0.5 7.1x 6.3x Sep-14 Bluestem Brands Capmark Financial Group 0.6 6.2x 5.1x Jun-17 Staples Sycamore Partners 6.7 Source: Company filings, Wall Street research. Note: Dollars in billions. Based on select retail transactions with TEV above $0.5bn since January 1, 2010. Excludes transactions where public information to calculate EV / LTM EBITDA is unavailable: Perry Corp / Barney’s New York, AEA Investors / At Home Group, Avon / Silpada Designs, Bain Capital / Bob’s Discount Furniture, Berkshire Hathaway / Oriental Trading Co., Wal-Mart / Jet.com, Hudson’s Bay / Gilt Groupe, Investor Group / eBay Enterprise , Ahold / Bol.com, Naspers Limited / Markafoni, Amazon.com / Quidsj, Rakuten / Price Minister. 42 (1) Represents LTM Comparable EBITDA, which is after deduction of stock-based compensation expense, when sufficient information was disclosed to determine Comparable EBITDA; otherwise represents EBITDA figure disclosed publicly. 25th Percentile 7.2x Median 9.4x 75th Percentile 11.3x May-12 Cost Plus Bed Bath & Beyond 0.7 Feb-16 Rona Lowe's 2.3 Jul-13 Saks Hudson's Bay 2.9 May-12 Charming Shoppes Ascena Retail Group 0.8 Nov-15 Petco CVC, CPP 4.6 Dec-13 Nine West Sycamore Partners 2.1 Dec-10 Jo-Ann Stores Leonard Green & Partners, L.P 1.5 Nov-12 The Brick Leon's Furniture 0.8 Aug-15 Belk Sycamore Partners 2.9
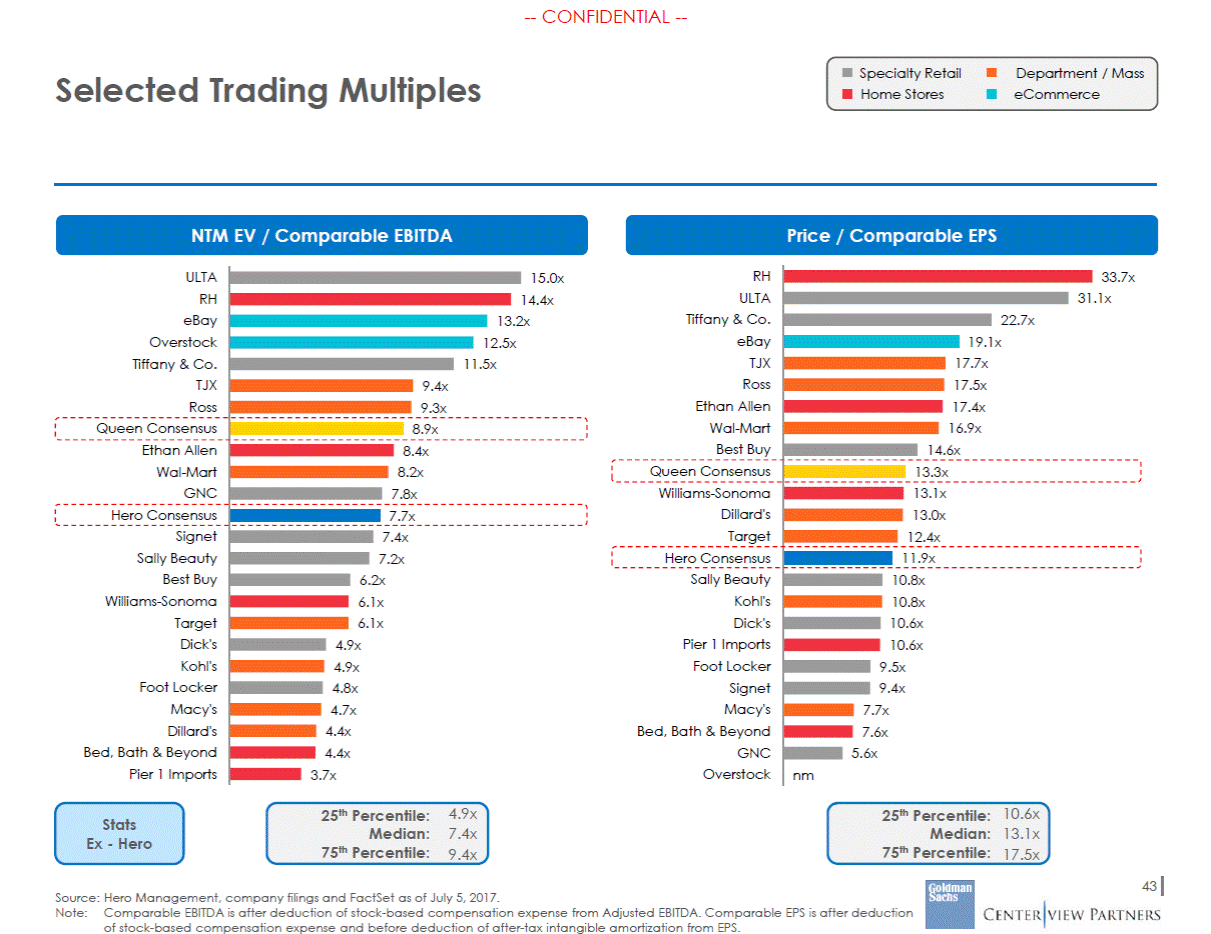
--CONFIDENTIAL --Specialty Retail Home Stores Department / Mass eCommerce Selected Trading Multiples NTM EV / Comparable EBITDA Price / Comparable EPS RH ULTA Tiffany & Co. eBay TJX Ross Ethan Allen Wal-Mart Best Buy ULTA RH eBay Overstock Tiffany & Co. TJX Ross 33.7x 15.0x Queen Consensus Queen Consensus Williams-Sonoma Dillard's Target Hero Consensus 4.9x 7.4x 9.4x 10.6x 25th Percentile: Median: 75th Percentile: 25th Percentile: Stats Ex - Hero Median: 13.1x 75th Percentile: 17.5x 43 Source: Hero Management, company filings and FactSet as of July 5, 2017. Note:Comparable EBITDA is after deduction of stock-based compensation expense from Adjusted EBITDA. Comparable EPS is after deduction of stock-based compensation expense and before deduction of after-tax intangible amortization from EPS. 14.4x 13.2x 12.5x 11.5x 9.4x 9.3x 8.9x Ethan Allen Wal-Mart GNC 8.4x 8.2x 7.8x Hero Consensus Signet Sally Beauty Best Buy Williams-Sonoma Target Dick's Kohl's Foot Locker Macy's Dillard's Bed, Bath & Beyond Pier 1 Imports 7.7x 7.4x 7.2x 6.2x 6.1x 6.1x 4.9x 4.9x 4.8x 4.7x 4.4x 4.4x 3.7x 31.1x 22.7x 19.1x 17.7x 17.5x 17.4x 16.9x 14.6x 13.3x 13.1x 13.0x 12.4x 11.9x Sally Beauty Kohl's Dick's Pier 1 Imports Foot Locker Signet Macy's Bed, Bath & Beyond GNC Overstock 10.8x 10.8x 10.6x 10.6x 9.5x 9.4x 7.7x 7.6x 5.6x nm
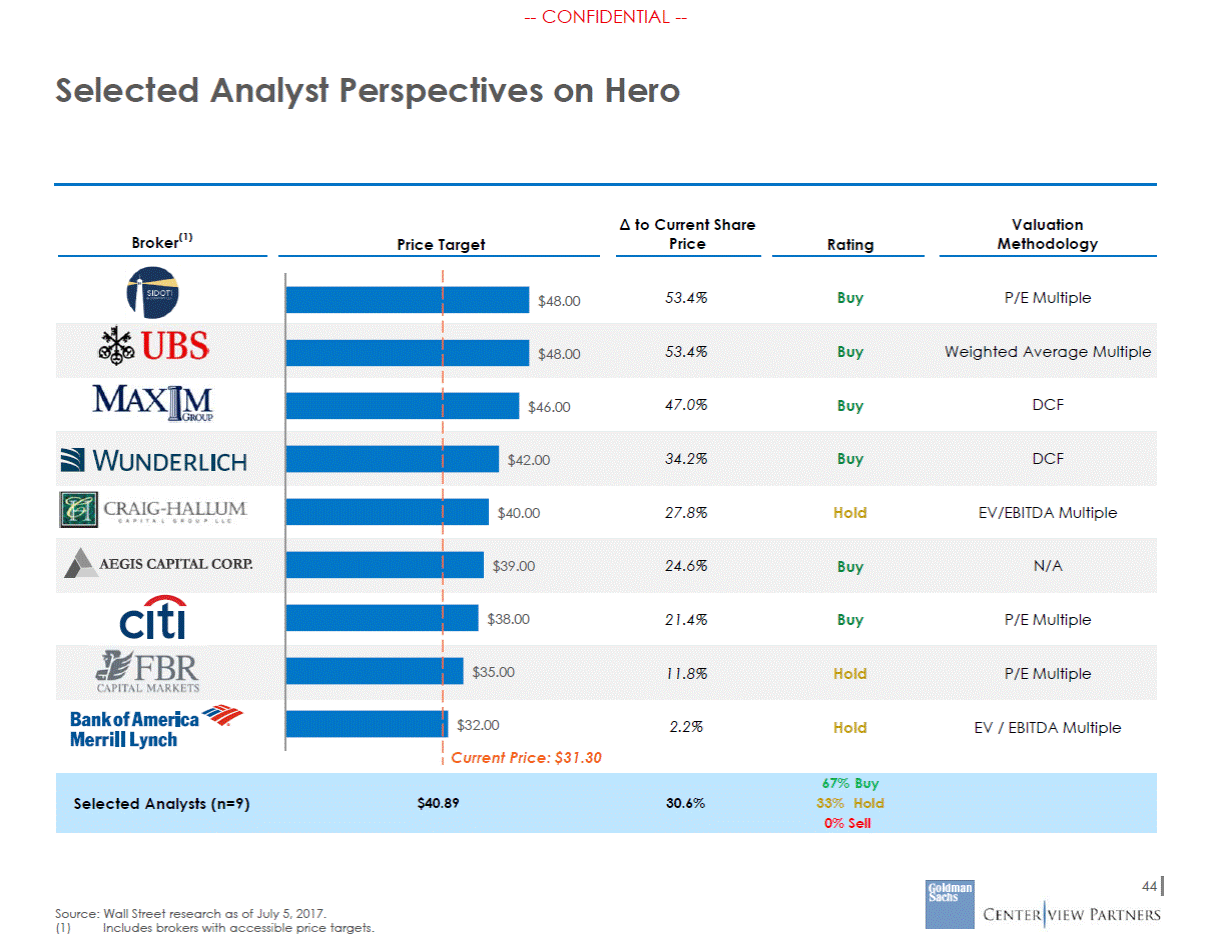
--CONFIDENTIAL --Selected Analyst Perspectives on Hero to Current Share Price Valuation Methodology Broker(1) Price Target Rating 44 Source: Wall Street research as of July 5, 2017. (1) Includes brokers with accessible price targets. 67% Buy Selected Analysts (n=9) $40.89 30.6% 33% Hold 0% Sell $48.00 53.4% Buy P/E Multiple $48.00 53.4% Buy Weighted Average Multiple $46.00 47.0% Buy DCF $42.00 34.2% Buy DCF $40.00 27.8% Hold EV/EBITDA Multiple $39.00 24.6% Buy N/A $38.00 21.4% Buy P/E Multiple $35.00 11.8% Hold P/E Multiple $32.00 2.2% Hold EV / EBITDA Multiple Current Price: $31.30
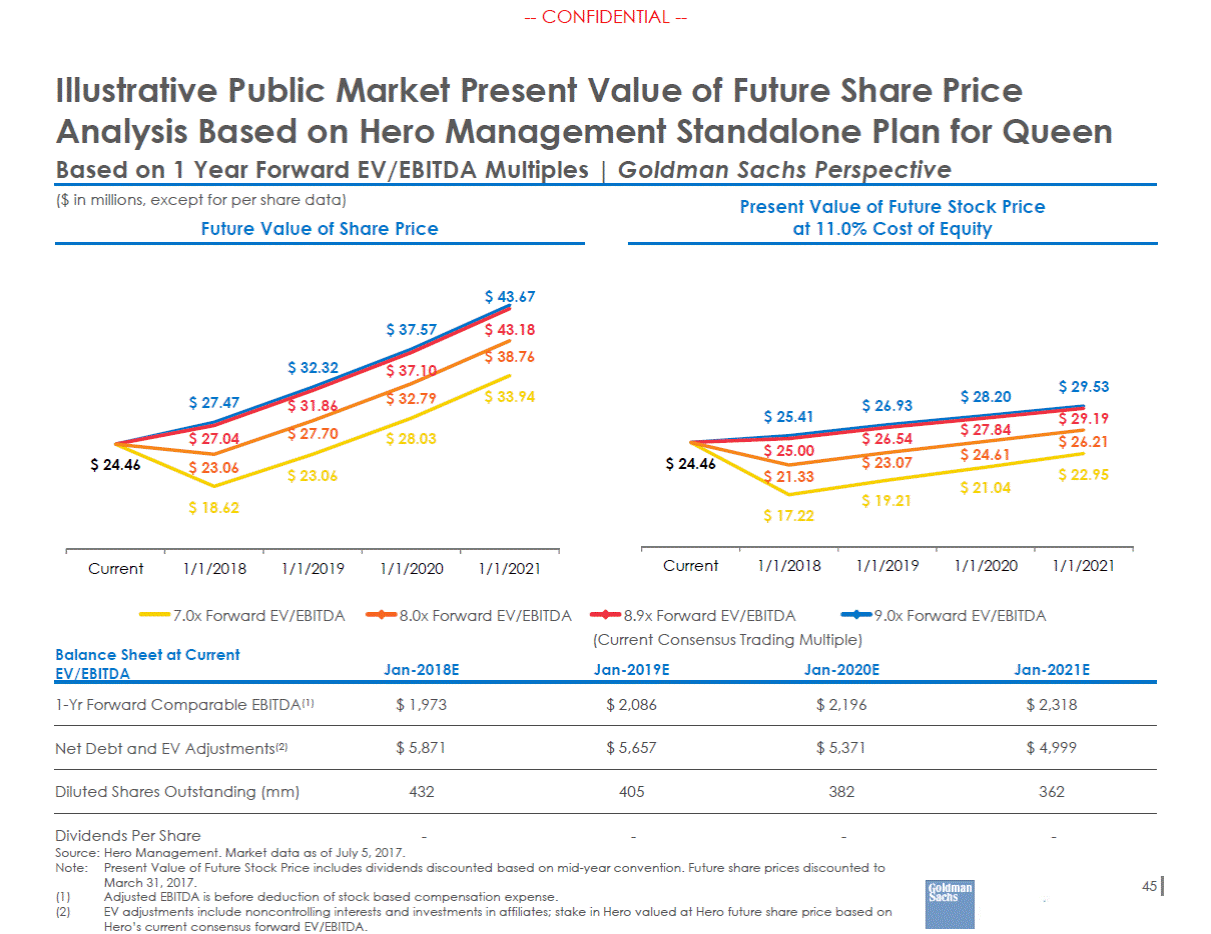
--CONFIDENTIAL --Illustrative Public Market Present Value of Future Share Price Analysis Based on Hero Management Standalone Plan for Queen Based on 1 Year Forward EV/EBITDA Multiples | Goldman Sachs Perspective ($ in millions, except for per share data) Future Value of Share Price Present Value of Future Stock Price at 11.0% Cost of Equity $ 43.67 $ 37.57 $ 43.18 $ 38.76 $ 32.32 $ 37.10 $ 32.79 $ 29.53 $ 33.94 $ 28.20 $ 27.47 $ 31.86 $ 27.70 $ 26.93 $ 25.41 $ 29.19 $ 26.21 $ 27.84 $ 24.61 $ 27.04 $ 23.06 $ 28.03 $ 26.54 $ 23.07 $ 25.00 $ 21.33 $ 24.46 $ 24.46 $ 23.06 $ 22.95 $ 21.04 $ 19.21 $ 18.62 $ 17.22 Current 1/1/2018 1/1/2019 1/1/2020 1/1/2021 Current 1/1/2018 1/1/2019 1/1/2020 1/1/2021 7.0x Forward EV/EBITDA 8.0x Forward EV/EBITDA 8.9x Forward EV/EBITDA 9.0x Forward EV/EBITDA (Current Consensus Trading Multiple) Balance Sheet at Current EV/EBITDA Jan-2018E Jan-2019E Jan-2020E Jan-2021E 1-Yr Forward Comparable EBITDA(1) $ 1,973 $ 2,086 $ 2,196 $ 2,318 Net Debt and EV Adjustments(2) $ 5,871 $ 5,657 $ 5,371 $ 4,999 Diluted Shares Outstanding (mm) 432 405 382 362 - - - - Dividends Per Share Source: Hero Management. Market data as of July 5, 2017. Note: Present Value of Future Stock Price includes dividends discounted based on mid-year convention. Future share prices discounted to March 31, 2017. Adjusted EBITDA is before deduction of stock based compensation expense. EV adjustments include noncontrolling interests and investments in affiliates; stake in Hero valued at Hero future share price based on Hero’s current consensus forward EV/EBITDA. 45 (1) (2)
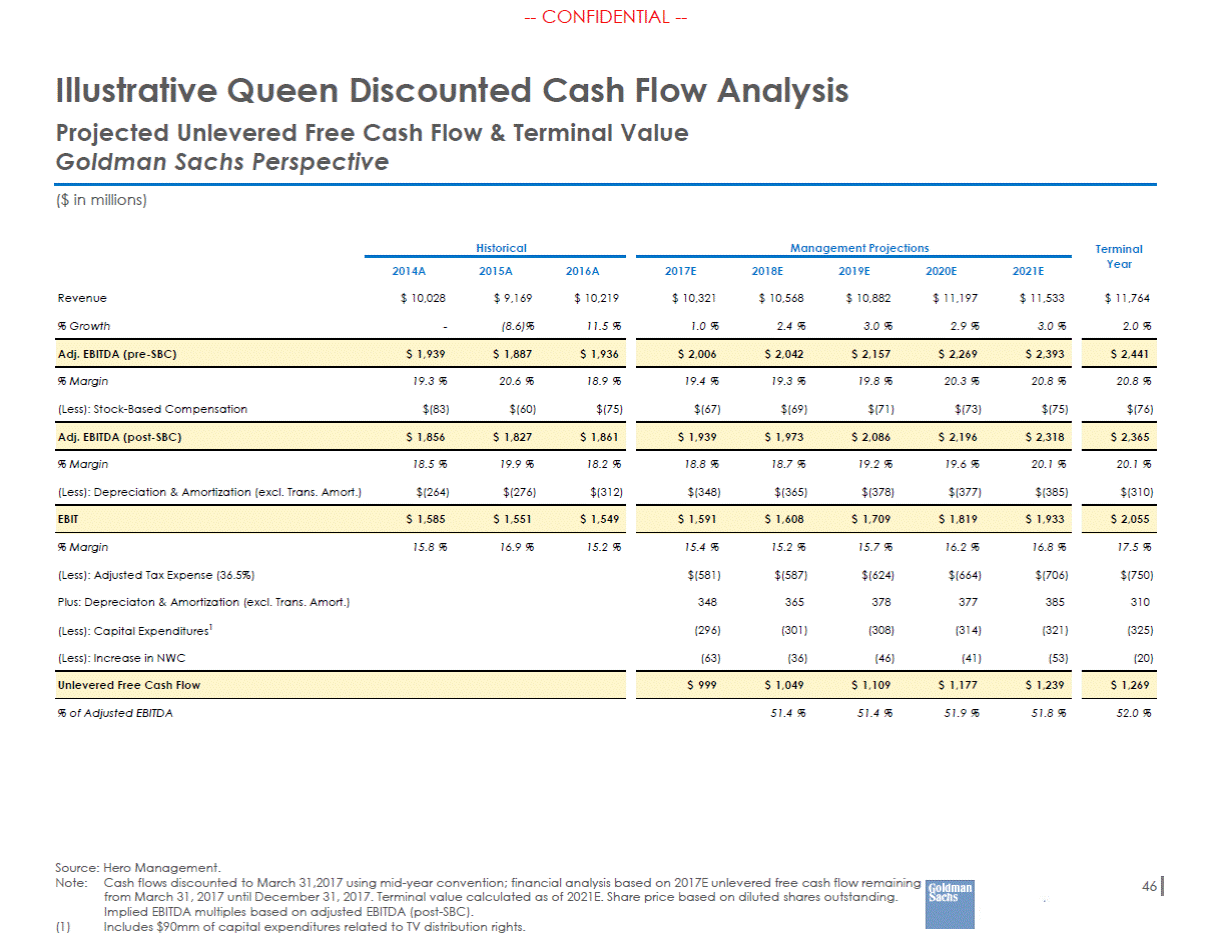
--CONFIDENTIAL --Illustrative Queen Discounted Cash Flow Projected Unlevered Free Cash Flow & Terminal Value Goldman Sachs Perspective Analysis ($ in millions) Historical Management Projections Terminal Year 2014A 2015A 2016A 2017E 2018E 2019E 2020E 2021E Revenue $ 10,028 $ 9,169 $ 10,219 $ 10,321 $ 10,568 $ 10,882 $ 11,197 $ 11,533 $ 11,764 % Growth - (8.6)% 11.5 % 1.0 % 2.4 % 3.0 % 2.9 % 3.0 % 2.0 % % Margin 19.3 % 20.6 % 18.9 % 19.4 % 19.3 % 19.8 % 20.3 % 20.8 % 20.8 % (Less): Stock-Based Compensation $(83) $(60) $(75) $(67) $(69) $(71) $(73) $(75) $(76) % Margin 18.5 % 19.9 % 18.2 % 18.8 % 18.7 % 19.2 % 19.6 % 20.1 % 20.1 % (Less): Depreciation & Amortization (excl. Trans. Amort.) $(264) $(276) $(312) $(348) $(365) $(378) $(377) $(385) $(310) % Margin 15.8 % 16.9 % 15.2 % 15.4 % 15.2 % 15.7 % 16.2 % 16.8 % 17.5 % (Less): Adjusted Tax Expense (36.5%) $(581) $(587) $(624) $(664) $(706) $(750) Plus: Depreciaton & Amortization (excl. Trans. Amort.) 348 365 378 377 385 310 (Less): Capital Expenditures1 (296) (301) (308) (314) (321) (325) (Less): Increase in NWC (63) (36) (46) (41) (53) (20) % of Adjusted EBITDA 51.4 % 51.4 % 51.9 % 51.8 % 52.0 % Source: Hero Management. Note:Cash flows discounted to March 31,2017 using mid-year convention; financial analysis based on 2017E unlevered free cash flow remaining from March 31, 2017 until December 31, 2017. Terminal value calculated as of 2021E. Share price based on diluted shares outstanding. Implied EBITDA multiples based on adjusted EBITDA (post-SBC). 46 (1) Includes $90mm of capital expenditures related to TV distribution rights. $ 1,269 $ 999$ 1,049$ 1,109$ 1,177$ 1,239 Unlevered Free Cash Flow $ 2,055 $ 1,591$ 1,608$ 1,709$ 1,819$ 1,933 EBIT$ 1,585$ 1,551$ 1,549 $ 2,365 $ 1,939$ 1,973$ 2,086$ 2,196$ 2,318 Adj. EBITDA (post-SBC)$ 1,856$ 1,827$ 1,861 $ 2,441 $ 2,006$ 2,042$ 2,157$ 2,269$ 2,393 Adj. EBITDA (pre-SBC)$ 1,939$ 1,887$ 1,936
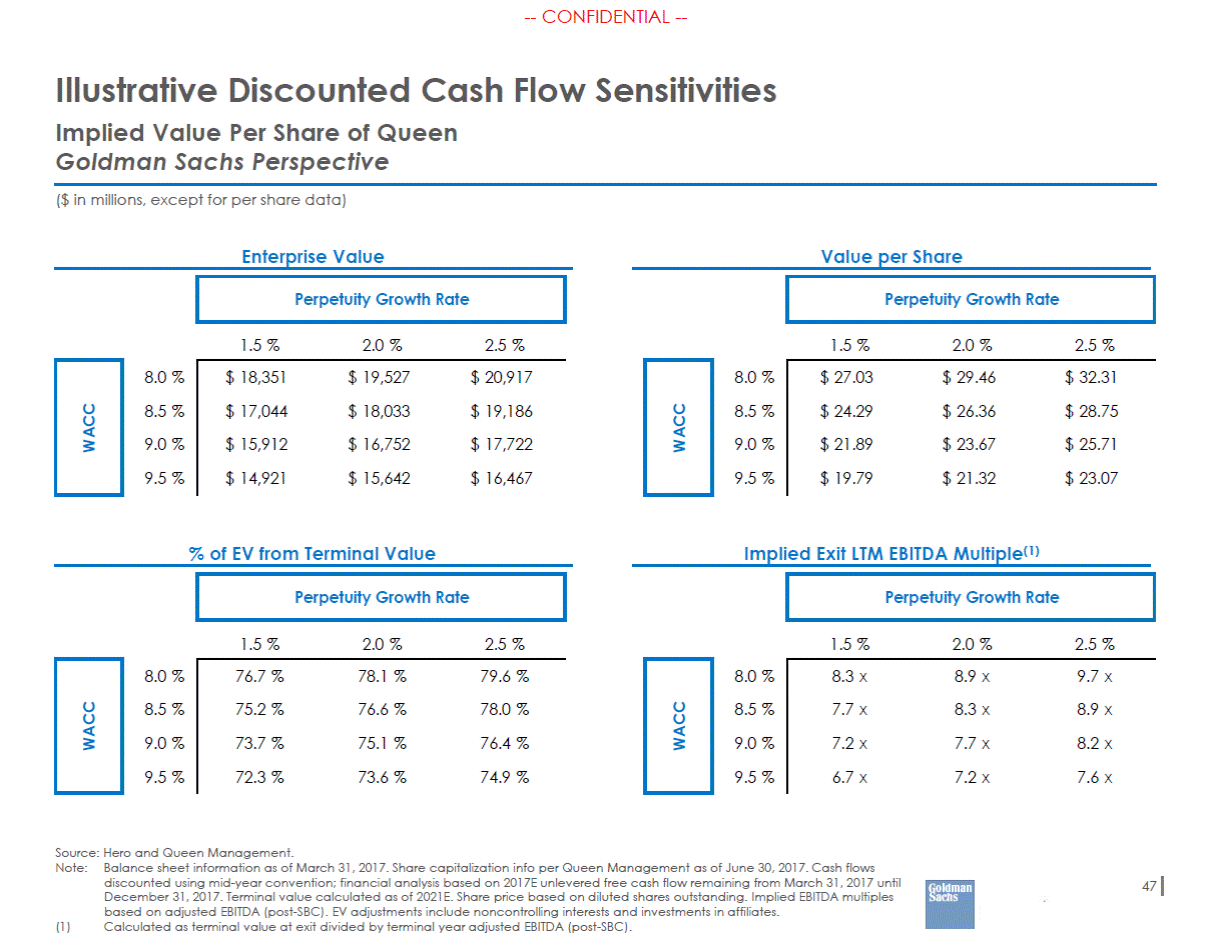
--CONFIDENTIAL --Illustrative Discounted Cash Flow Implied Value Per Share of Queen Goldman Sachs Perspective Sensitivities ($ in millions, except for per share data) Enterprise Value Value per Share 1.5 % 2.0 % 2.5 % 1.5 % 2.0 % 2.5 % 8.0 % 8.0 % 8.5 % 8.5 % 9.0 % 9.0 % 9.5 % 9.5 % Implied Exit LTM EBITDA Multiple(1) % of EV from Terminal Value 1.5 % 2.0 % 2.5 % 1.5 % 2.0 % 2.5 % 8.0 % 8.0 % 8.5 % 8.5 % 9.0 % 9.0 % 9.5 % 9.5 % Source: Hero and Queen Management. Note:Balance sheet information as of March 31, 2017. Share capitalization info per Queen Management as of June 30, 2017. Cash flows discounted using mid-year convention; financial analysis based on 2017E unlevered free cash flow remaining from March 31, 2017 until December 31, 2017. Terminal value calculated as of 2021E. Share price based on diluted shares outstanding. Implied EBITDA multiples based on adjusted EBITDA (post-SBC). EV adjustments include noncontrolling interests and investments in affiliates. 47 (1) Calculated as terminal value at exit divided by terminal year adjusted EBITDA (post-SBC). 8.3 x 8.9 x 9.7 x 7.7 x 8.3 x 8.9 x 7.2 x 7.7 x 8.2 x 6.7 x 7.2 x 7.6 x WACC 76.7 % 78.1 % 79.6 % 75.2 % 76.6 % 78.0 % 73.7 % 75.1 % 76.4 % 72.3 % 73.6 % 74.9 % WACC Perpetuity Growth Rate Perpetuity Growth Rate $ 27.03 $ 29.46 $ 32.31 $ 24.29 $ 26.36 $ 28.75 $ 21.89 $ 23.67 $ 25.71 $ 19.79 $ 21.32 $ 23.07 WACC $ 18,351 $ 19,527 $ 20,917 $ 17,044 $ 18,033 $ 19,186 $ 15,912 $ 16,752 $ 17,722 $ 14,921 $ 15,642 $ 16,467 WACC Perpetuity Growth Rate Perpetuity Growth Rate
--CONFIDENTIAL --Illustrative Queen Discounted Cash Flow Analysis Centerview Perspective Queen Standalone Unlevered Free Cash Flows Fiscal Year Ending December 31, 2016A 2017E 2018E 2019E 2020E 2021E Adjusted EBITDA (Less): Stock-Based Compensation Comparable EBITDA (Less): D&A (Excluding Trans. Amort.)(1) Adjusted EBIT (Excluding Trans. Amort.)(1) (Less): Taxes Plus: D&A (Exluding Trans. Amort.)(1) (Less): in Net Working Capital (Less): Capital Expenditures(2) Unlevered Free Cash Flow YoY Growth $1,936 (75) $1,861 (312) $1,549 $2,006 (67) $1,939 (348) $1,591 (581) 348 (63) (296) $999 $2,042 (69) $1,973 (365) $1,608 (587) 365 (36) (301) $1,049 5.0% $2,157 (71) $2,086 (378) $1,709 (624) 378 (46) (308) $1,109 5.7% $2,269 (73) $2,196 (377) $1,819 (664) 377 (41) (314) $1,177 6.1% $2,393 (75) $2,318 (385) $1,933 (706) 385 (53) (321) $1,239 5.3% Enterprise Value ($bn) Perpetuity Growth Rate Implied LTM Exit Multiple Perpetuity Growth Rate Value per Share ($) Perpetuity Growth Rate Discount Rate 1.0% 2.0% 3.0% 1.0% 2.0% 3.0% 1.0% 2.0% 3.0% 8.5% 9.0% 9.5% $16.1 15.2 14.3 $18.1 16.8 15.7 $20.8 19.1 17.6 7.4x 6.9x 6.5x 8.6x 8.0x 7.5x 10.2x 9.4x 8.7x $22.37 20.29 18.45 $26.49 23.85 21.53 $31.98 28.51 0.01 Source: Hero Management. Note: Dollars in millions, unless otherwise noted. Assumes mid-year discounting convention. Balance sheet information as of March 31, 2017. Share capitalization info per Queen Management as of June 30, 2017. Financial analysis based on unlevered free cash flow from March 31, 2017 until December 31, 2021. Terminal value calculated as of 2021E. Does not include transaction amortization. Assumes transaction amortization is not tax deductible for cash tax purposes, per Queen company filings. Includes capitalized TV distribution fees of ~$90mm per year. 48 (1) (2)
--CONFIDENTIAL --Queen Illustrative Weighted Average Goldman Sachs Perspective Cost of Capital Analysis WACC Calculation WACC Sensitivity Analysis Metric Value Debt / Total Capitalization Target Capital Structure Target Debt / Total Capitalization 30.0 % 35.0 % 40.0 % 35.0 % 5.5 % Cost of Equity Risk Free Rate¹ Equity Beta² Equity Risk Premium³ 6.5 % 2.6 % 1.22 6.9 % 7.5 % Debt / Total Capitalization 30.0 % 35.0 % 40.0 % Cost of Debt Pre-Tax Cost of Debt4 Marginal Tax Rate5 After-Tax Cost of Debt 1.12 6.5 % 36.5 % 4.1 % 1.22 1.32 Historical Equity Beta 1.40 1.25 1.22 1.10 0.95 0.80 Jul-15 Nov-15 Apr-16 Sep-16 Feb-17 Jul-17 Source: Hero Management, Axioma as of July 5, 2017. (1) (2) (3) (4) (5) U.S. Government bond yield, 4 ½% due June 2036. Axioma historical beta – 2 year weekly beta. Duff & Phelps’ 2015 U.S. Risk Premia Over Time (1926-2015). Estimated pre-tax cost of new long-term unsecured debt. Based on Hero management guidance. 49 Beta WACC8.6 % 8.4 %8.1 %7.8 % 8.9 %8.6 %8.2 % 9.4 %9.0 %8.7 % Equity Beta Cost of Equity10.9 % 8.7 %8.3 %8.0 % 8.9 %8.6 %8.2 % 9.1 %8.8 %8.5 % Pre-Tax Cost of Debt
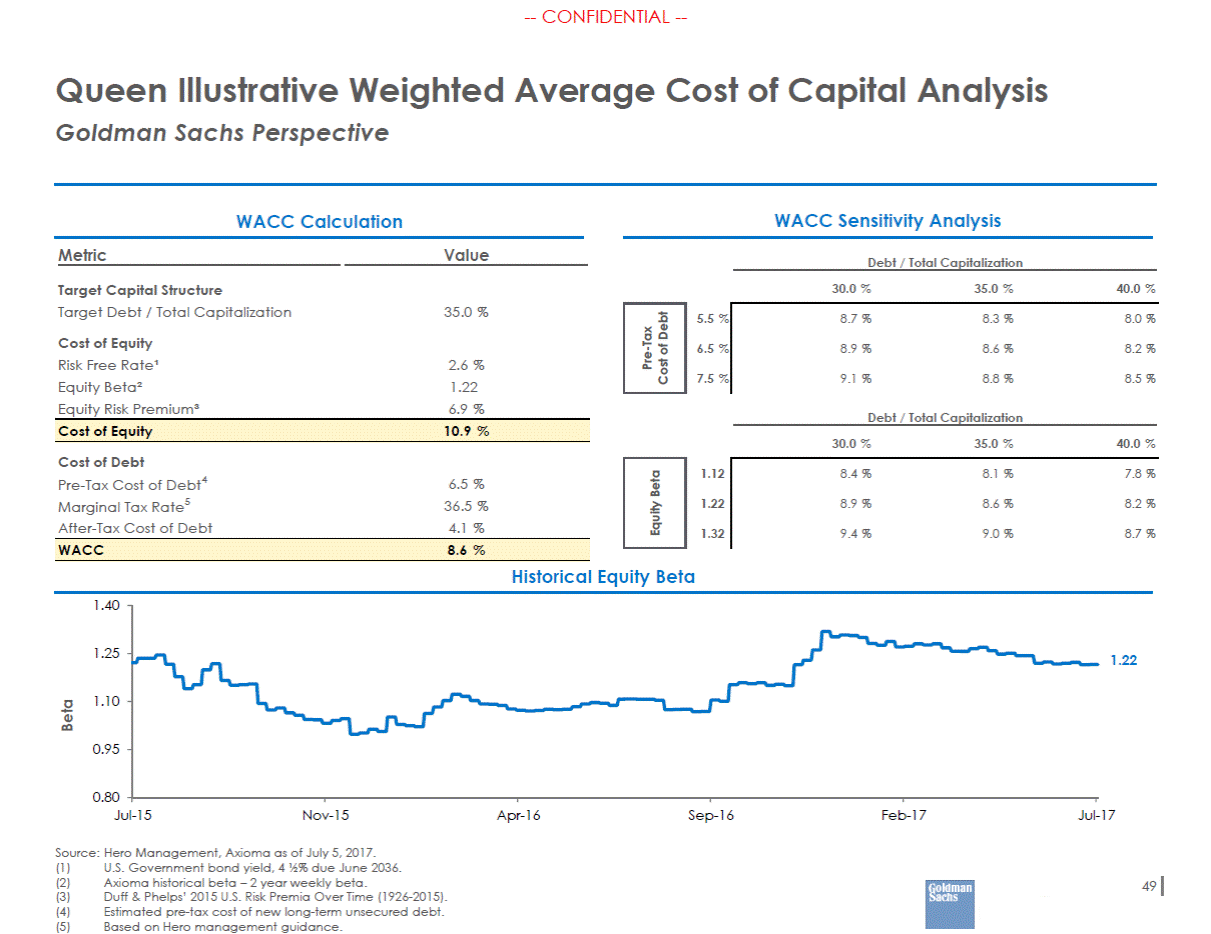
--CONFIDENTIAL --Queen Cost of Capital Centerview Perspective Analysis Selected Beta Debt / Unlevered Beta(2) 0.85 Hero 0.89 0.75 31.2% Levered Beta(4) 0.97 Best Buy 1.07 1.03 7.5% Size Premium(6) 0.61% Dillard's 1.06 0.82 47.3% Cost of Equity 9.9% Ethan Allen 1.24 1.21 3.4% Tax Rate 38.0% GNC 1.05 0.36 307.3% Macy's 0.97 0.61 95.7% Debt / Equity Value Unlevered Beta Pier 1 Imports 1.41 1.09 48.1% 0.75 0.85 0.95 Ross 0.99 0.98 1.8% Signet 0.90 0.70 46.9% Tiffany & Co. 1.08 1.03 9.2% ULTA 0.88 0.88 0.0% Williams-Sonoma 0.89 0.88 1.0% Source: Company filings, treasury.gov, Bloomberg and FactSet as of July 5, 2017. (1) (2) (3) (4) Represents five year adjusted weekly average Beta relative to S&P 500. Unlevered Beta equals (levered Beta / (1 + ((1 – tax rate) * debt / equity)). Represents United States 20-year constant maturity treasury rate as of July 5, 2017. Represents levering of the unlevered Beta of the peers at target debt / equity ratio. Levered Beta = (unlevered Beta)*(1+(1-tax rate)*(debt / equity)). Assumes 38% tax rate. Historical spread between the U.S. government long bond and the S&P500. Source: Duff & Phelps 2017 Valuation Handbook. Size premium based on Duff & Phelps 2017 Valuation Handbook. Based on retail company bond yields. WACC equals ((debt / capitalization * (cost of debt * (1 – tax rate))) + (equity / capitalization * levered cost of equity)). Tax rate based on statutory tax rate. (5) (6) (7) (8) 50 75th Percentile1.030.9247.1% Peer Median0.960.8523.1% 25th Percentile0.890.684.1% Queen1.150.8655.7% Wal-Mart0.730.6520.3% TJX0.910.894.8% Target0.820.6544.0% Sally Beauty0.700.5064.9% 10.0% 8.3%8.9%9.6% 23.0% 8.1%8.7%9.4% 55.7% 7.8%8.4%9.0% RH0.770.6528.6% Overstock0.930.8514.4% WACC at Various Unlevered Betas and Debt / Equity Ratios(8) Kohl's1.010.7069.8% WACC(8)8.7% Foot Locker0.960.952.0% Pre-Tax Cost of Debt(7)5.5% eBay0.970.8523.1% Dick's0.880.872.2% Equity Risk Premium6.9% Bed, Bath & Beyond0.960.7933.7% Debt / Equity23.0% Companies Levered(1) Unlevered(2) Equity Risk Free Rate(3)2.63% WACC Peer Analysis Queen Peer-Based WACC
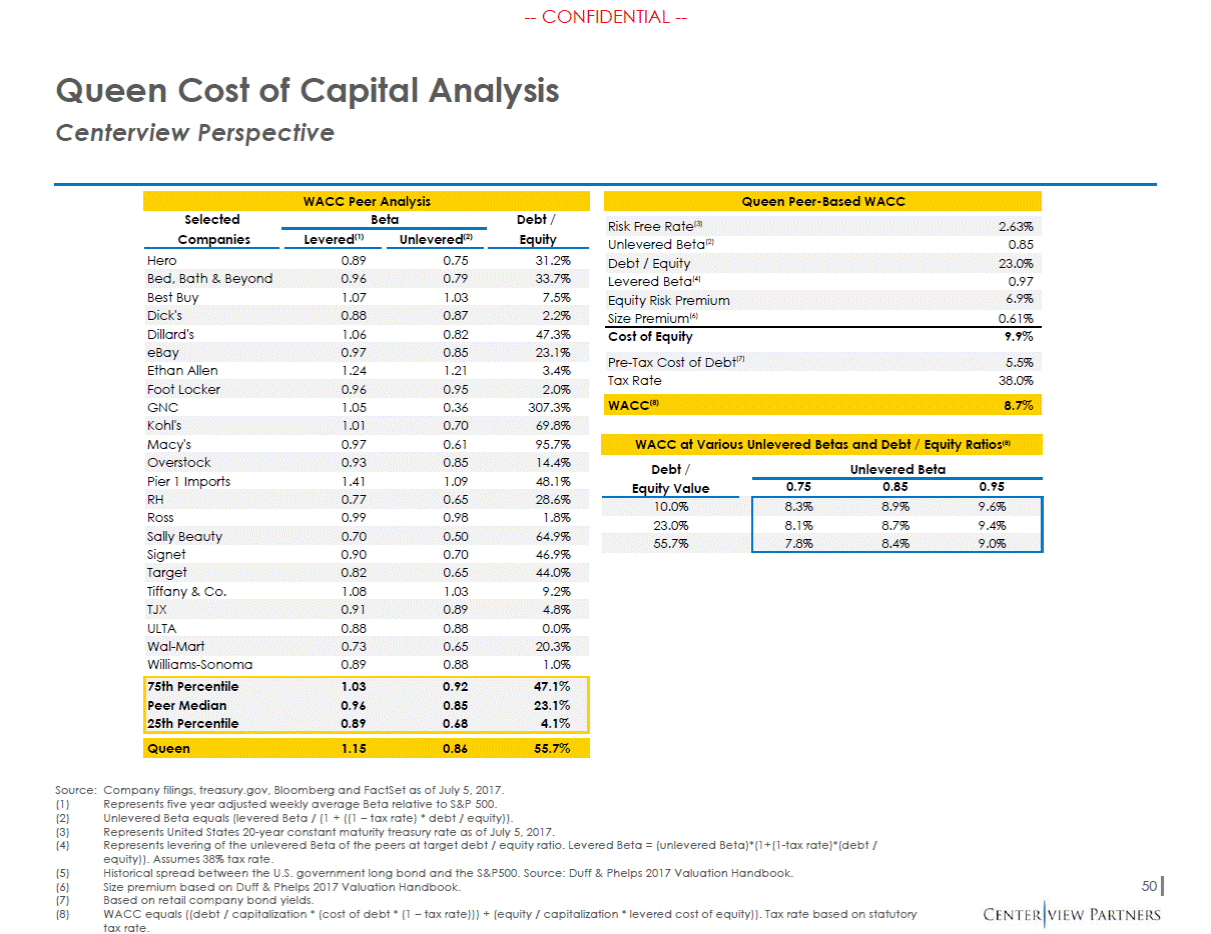
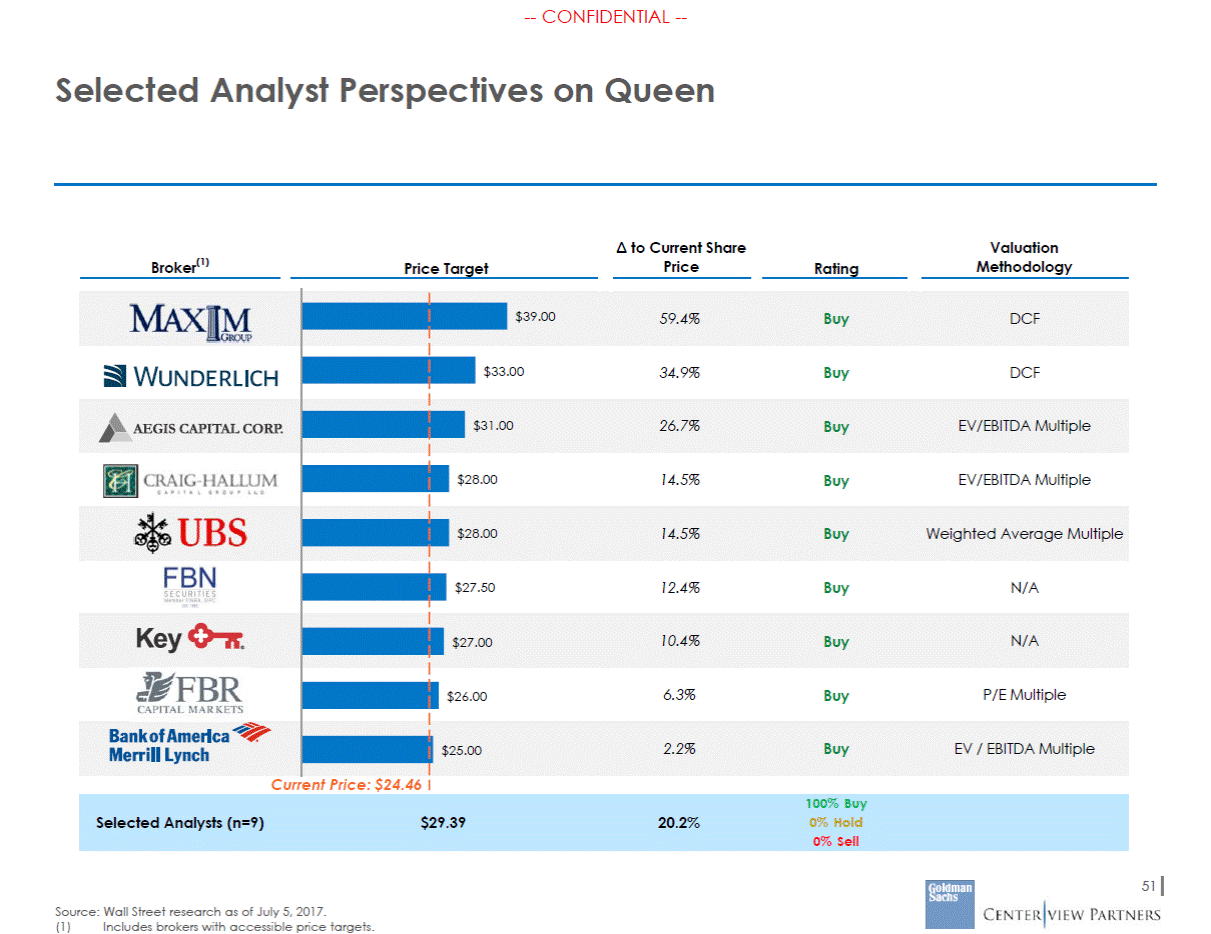
--CONFIDENTIAL --Selected Analyst Perspectives on Queen to Current Share Price Valuation Methodology Broker(1) Price Target Rating 51 Source: Wall Street research as of July 5, 2017. (1) Includes brokers with accessible price targets. 100% Buy Selected Analysts (n=9) $29.39 20.2% 0% Hold 0% Sell $39.00 59.4% Buy DCF $33.00 34.9% Buy DCF $31.00 26.7% Buy EV/EBITDA Multiple $28.00 14.5% Buy EV/EBITDA Multiple $28.00 14.5% Buy Weighted Average Multiple $27.50 12.4% Buy N/A $27.00 10.4% Buy N/A $26.00 6.3% Buy P/E Multiple $25.00 2.2% Buy EV / EBITDA Multiple Current Price: $24.46
Supplementary Reference Materials
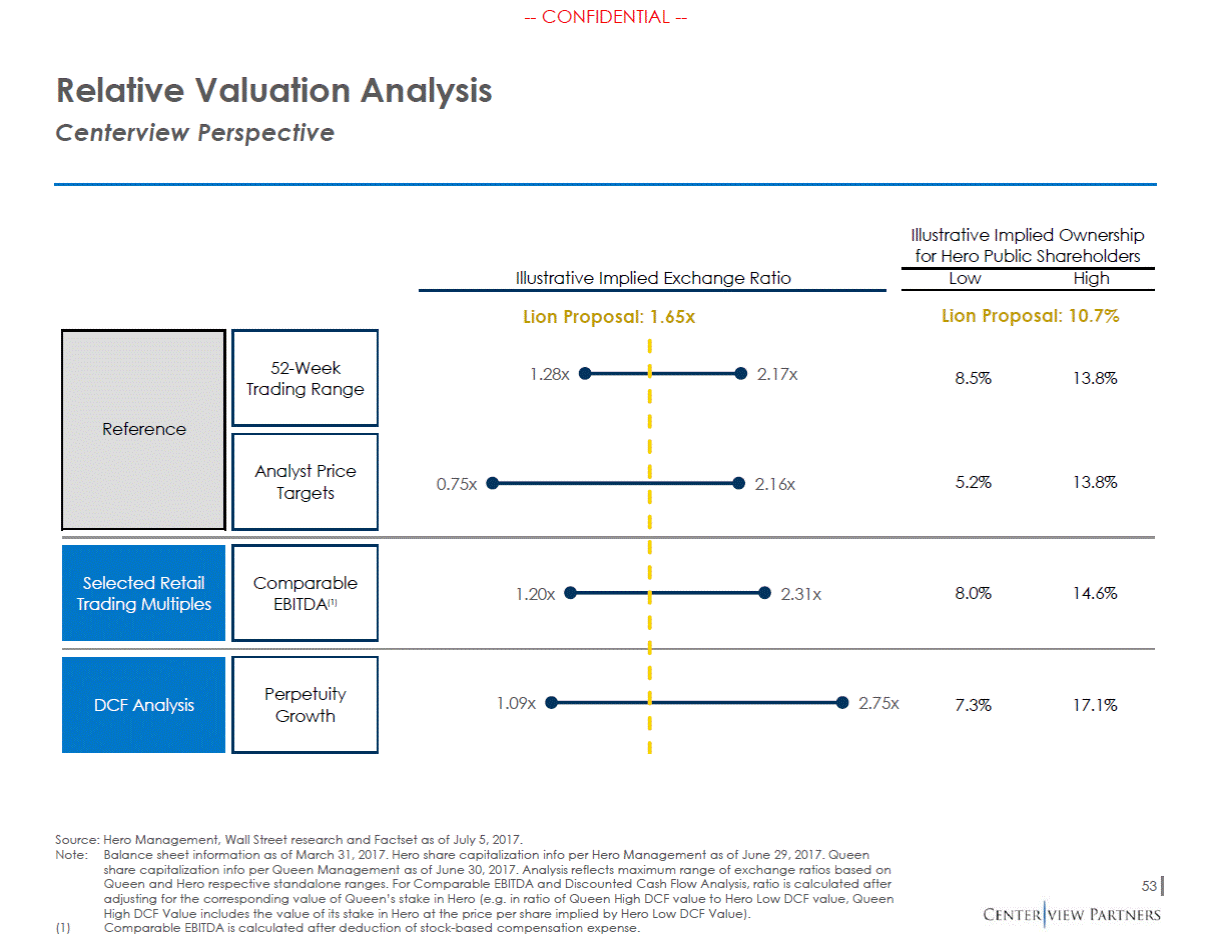
--CONFIDENTIAL --Relative Valuation Centerview Perspective Analysis Illustrative Implied Ownership for Hero Public Shareholders Illustrative Implied Exchange Ratio Low High Lion Proposal: 10.7% Lion Proposal: 1.65x 1.28x 2.17x 8.5% 13.8% 5.2% 13.8% 0.75x 2.16x 8.0% 14.6% 1.20x 2.31x 1.09x 2.75x 7.3% 17.1% Source: Hero Management, Wall Street research and Factset as of July 5, 2017. Note:Balance sheet information as of March 31, 2017. Hero share capitalization info per Hero Management as of June 29, 2017. Queen share capitalization info per Queen Management as of June 30, 2017. Analysis reflects maximum range of exchange ratios based on Queen and Hero respective standalone ranges. For Comparable EBITDA and Discounted Cash Flow Analysis, ratio is calculated after adjusting for the corresponding value of Queen’s stake in Hero (e.g. in ratio of Queen High DCF value to Hero Low DCF value, Queen High DCF Value includes the value of its stake in Hero at the price per share implied by Hero Low DCF Value). 53 (1) Comparable EBITDA is calculated after deduction of stock-based compensation expense. DCF Analysis Perpetuity Growth Selected Retail Trading Multiples Comparable EBITDA(1) Analyst Price Targets 52-Week Trading Range Reference
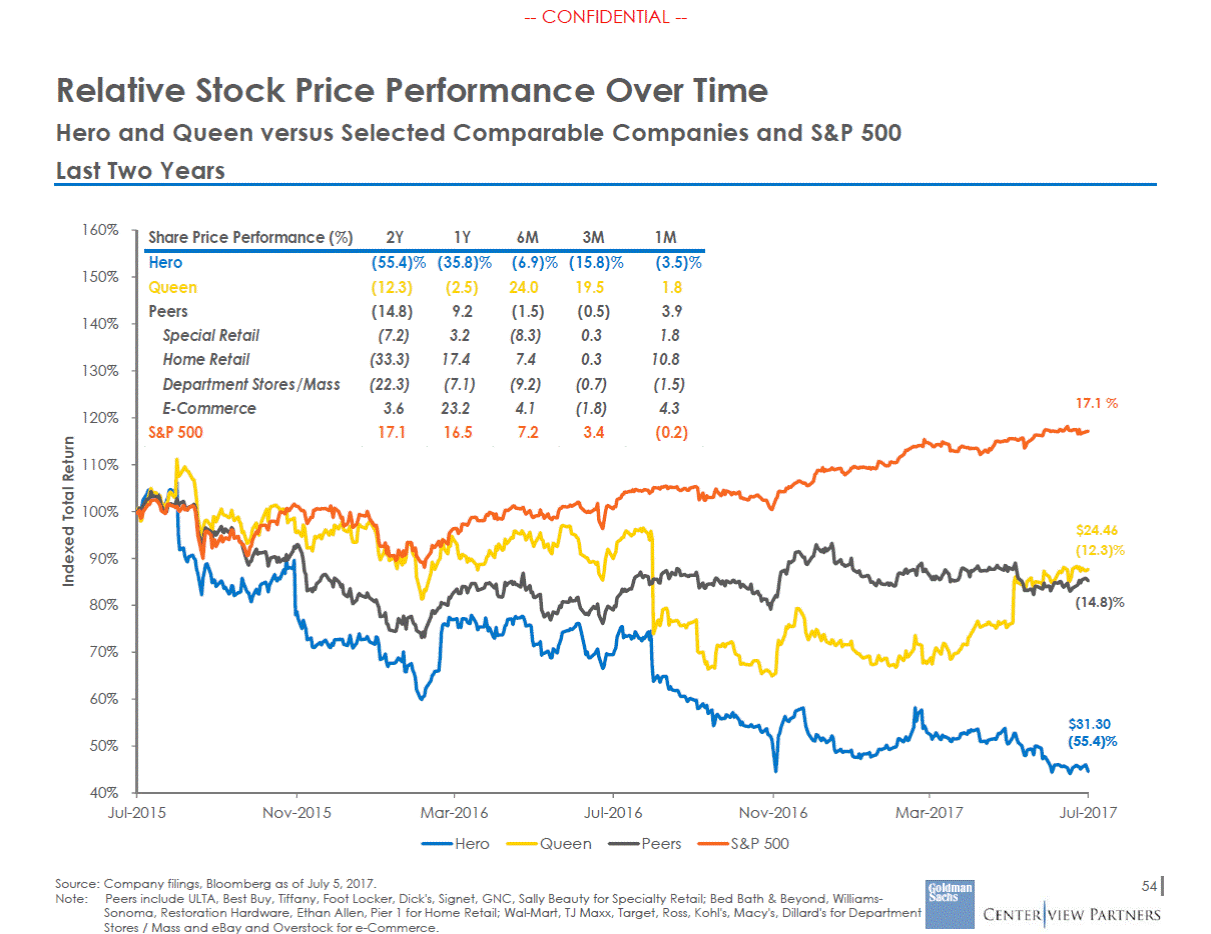
--CONFIDENTIAL --Relative Stock Price Performance Over Time Hero and Queen versus Selected Comparable Companies and S&P 500 Last Two Years 160% 150% 140% 130% .1 % 120% 110% 100% $24.46 2.3)% 90% 14.8)% 80% 70% 60% .30 55.4)% 50% 40% Jul-2015 Nov-2015 Mar-2016 Hero Jul-2016 Nov-2016 S&P 500 Mar-2017 Jul-2017 Queen Peers Source: Company filings, Bloomberg as of July 5, 2017. Note:Peers include ULTA, Best Buy, Tiffany, Foot Locker, Dick's, Signet, GNC, Sally Beauty for Specialty Retail; Bed Bath & Beyond, Williams-Sonoma, Restoration Hardware, Ethan Allen, Pier 1 for Home Retail; Wal-Mart, TJ Maxx, Target, Ross, Kohl's, Macy's, Dillard's for Department Stores / Mass and eBay and Overstock for e-Commerce. 54 Indexed Total Return Share Price Performance (%)2Y1Y6M3M1M Hero(55.4)% (35.8)% (6.9)% (15.8)%(3.5)% Queen(12.3)(2.5)24.019.51.8 Peers(14.8)9.2(1.5)(0.5)3.9 Special Retail(7.2)3.2(8.3)0.31.8 Home Retail(33.3)17.47.40.310.8 Department Stores/Mass(22.3)(7.1)(9.2)(0.7)(1.5) E-Commerce3.623.24.1(1.8)4.317 S&P 50017.116.57.23.4(0.2) (1 ( $31 (
