Disclaimer (Centerview Partners) This presentation has been prepared by Centerview Partners LLC (“Centerview”) for use solely by the Special Committee of the Board of Directors of HSN, Inc. (“Hero” or the “Company”) in connection with its evaluation of a proposed transaction involving the Company and for no other purpose. The information contained herein is based upon information supplied by Hero and publicly available information, and portions of the information contained herein may be based upon statements, estimates and forecasts provided by the Company. Centerview has relied upon the accuracy and completeness of the foregoing information, and have not assumed any responsibility for any independent verification of such information or for any independent evaluation or appraisal of any of the assets or liabilities (contingent or otherwise) of the Company or any other entity, or concerning the solvency or fair value of the Company or any other entity. With respect to financial forecasts, including with respect to estimates of potential synergies, Centerview has assumed that such forecasts have been reasonably prepared on bases reflecting the best currently available estimates and judgments of the management of the Company as to its financial performances, and at your direction Centerview has relied upon such forecasts, as provided by the Company’s management, with respect to the Company, including as to expected synergies. Centerview assumes no responsibility for and expresses no view as to such forecasts or the assumptions on which they are based. The information set forth herein is based upon economic, monetary, market and other conditions as in effect on, and the information made available to us as of, the date hereof, unless indicated otherwise and Centerview assumes no obligation to update or otherwise revise these materials. The financial analysis in this presentation is complex and is not necessarily susceptible to a partial analysis or summary description. In performing this financial analysis, Centerview has considered the results of its analysis as a whole and did not necessarily attribute a particular weight to any particular portion of the analysis considered. Furthermore, selecting any portion of Centerview’s analysis, without considering the analysis as a whole, would create an incomplete view of the process underlying its financial analysis. Centerview may have deemed various assumptions more or less probable than other assumptions, so the reference ranges resulting from any particular portion of the analysis described above should not be taken to be Centerview’s view of the actual value of the Company. These materials and the information contained herein are confidential, were not prepared with a view toward public disclosure, and may not be disclosed publicly or made available to third parties without the prior written consent of Centerview. These materials and any other advice, written or oral, rendered by Centerview are intended solely for the benefit and use of the Special Committee of the Board of Directors of the Company (in its capacity as such) in its consideration of the proposed transaction, and are not for the benefit of, and do not convey any rights or remedies for any holder of securities of the Company or any other person. Centerview will not be responsible for and has not provided any tax, accounting, actuarial, legal or other specialist advice. These materials are not intended to provide the sole basis for evaluating the proposed transaction, and this presentation does not represent a fairness opinion, recommendation, valuation or opinion of any kind, and is necessarily incomplete and should be viewed solely in conjunction with the oral presentation provided by Centerview. 1
Disclaimer (Goldman Sachs) These materials have been prepared and are provided by Goldman Sachs on a confidential basis solely for the information and assistance of the Special Committee of the Board of Directors (the "Special Committee") of Hero (the "Company") in connection with its consideration of the matters referred to herein. These materials and Goldman Sachs’ presentation relating to these materials (the “Confidential Information”) may not be disclosed to any third party or circulated or referred to publicly or used for or relied upon for any other purpose without the prior written consent of Goldman Sachs. The Confidential Information was not prepared with a view to public disclosure or to conform to any disclosure standards under any state, federal or international securities laws or other laws, rules or regulations, and Goldman Sachs does not take any responsibility for the use of the Confidential Information by persons other than those set forth above. Notwithstanding anything in this Confidential Information to the contrary, the Company may disclose to any person the US federal income and state income tax treatment and tax structure of any transaction described herein and all materials of any kind (including tax opinions and other tax analyses) that are provided to the Company relating to such tax treatment and tax structure, without Goldman Sachs imposing any limitation of any kind. The Confidential Information has been prepared by the Investment Banking Division of Goldman Sachs and is not a product of its research department. Goldman Sachs and its affiliates are engaged in advisory, underwriting and financing, principal investing, sales and trading, research, investment management and other financial and non-financial activities and services for various persons and entities. Goldman Sachs and its affiliates and employees, and funds or other entities they manage or in which they invest or have other economic interests or with which they co-invest, may at any time purchase, sell, hold or vote long or short positions and investments in securities, derivatives, loans, commodities, currencies, credit default swaps and other financial instruments of the Company, any other party to any transaction and any of their respective affiliates or any currency or commodity that may be involved in any transaction. Goldman Sachs’ investment banking division maintains regular, ordinary course client service dialogues with clients and potential clients to review events, opportunities, and conditions in particular sectors and industries and, in that connection, Goldman Sachs may make reference to the Company, but Goldman Sachs will not disclose any confidential information received from the Company. The Confidential Information has been prepared based on historical financial information, forecasts and other information obtained by Goldman Sachs from publicly available sources, the management of the Company or other sources (approved for our use by the Company in the case of information from management and non-public information). In preparing the Confidential Information, Goldman Sachs has relied upon and assumed, without assuming any responsibility for independent verification, the accuracy and completeness of all of the financial, legal, regulatory, tax, accounting and other information provided to, discussed with or reviewed by us, and Goldman Sachs does not assume any liability for any such information. Goldman Sachs does not provide accounting, tax, legal or regulatory advice. Goldman Sachs has not made an independent evaluation or appraisal of the assets and liabilities (including any contingent, derivative or other off-balance sheet assets and liabilities) of the Company or any other party to any transaction or any of their respective affiliates and has no obligation to evaluate the solvency of the Company or any other party to any transaction under any state or federal laws relating to bankruptcy, insolvency or similar matters. The analyses contained in the Confidential Information do not purport to be appraisals nor do they necessarily reflect the prices at which businesses or securities actually may be sold or purchased. Goldman Sachs’ role in any due diligence review is limited solely to performing such a review as it shall deem necessary to support its own advice and analysis and shall not be on behalf of the Company. Analyses based upon forecasts of future results are not necessarily indicative of actual future results, which may be significantly more or less favorable than suggested by these analyses, and Goldman Sachs does not assume responsibility if future results are materially different from those forecast. The Confidential Information does not address the underlying business decision of the Company to engage in any transaction, or the relative merits of any transaction or strategic alternative referred to herein as compared to any other transaction or alternative that may be available to the Company. The Confidential Information is necessarily based on economic, monetary, market and other conditions as in effect on, and the information made available to Goldman Sachs as of, the date of such Confidential Information and Goldman Sachs assumes no responsibility for updating or revising the Confidential Information based on circumstances, developments or events occurring after such date. The Confidential Information does not constitute any opinion, nor does the Confidential Information constitute a recommendation to the Special Committee, any security holder of the Company or any other person as to how to vote or act with respect to any transaction or any other matter. The Confidential Information, including this disclaimer, is subject to, and governed by, any written agreement between the Company, the Board and/or any committee thereof, on the one hand, and Goldman Sachs, on the other hand. 2
Introduction and Agenda for Today’s Discussion In December, Greg Maffei, President and CEO of Lion Interactive, approached Hero’s Board of Directors (the “Board”) and suggested the parties explore a potential combination between Hero and Queen As a result, the Board formed a Special Committee (the “Committee”)and in early January 2017 engaged Centerview and Goldman Sachs (the “advisors”) to assist the Committee with its evaluation of strategic alternatives and a potential transaction The purpose of today’s discussion is to brief the Board on: —The current status of the process —Key work streams and topics advisors will cover during Committee / Board discussions in the coming weeks —Review of Management’s 2017-2021 financial projections (the “Projections”) —Next steps 3

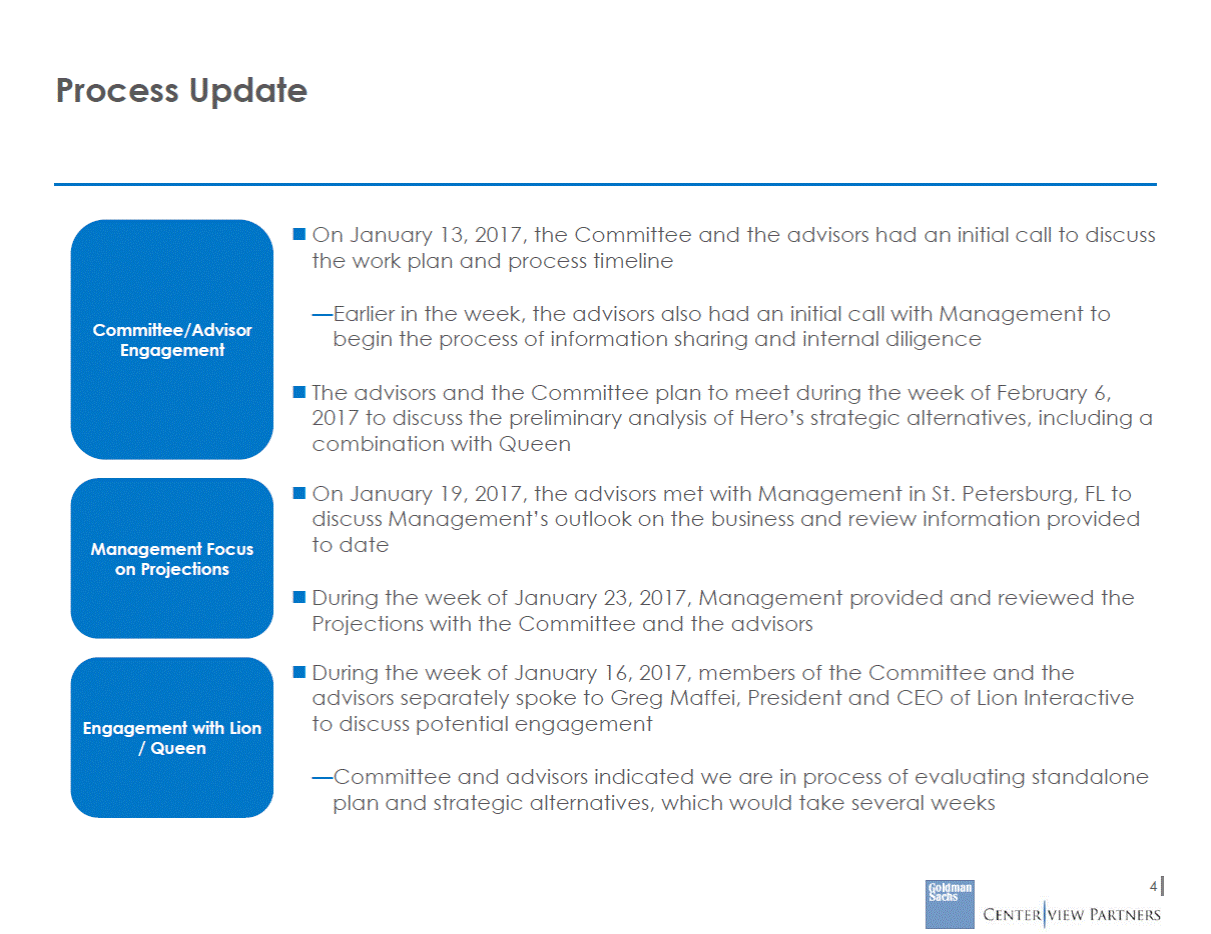
Process Update On January 13, 2017, the Committee and the advisors had an initial call to discuss the work plan and process timeline —Earlier in the week, the advisors also had an initial call with Management to begin the process of information sharing and internal diligence Committee/Advisor Engagement The advisors and the Committee plan to meet during the week of February 6, 2017 to discuss the preliminary analysis of Hero’s strategic alternatives, including a combination with Queen On January 19, 2017, the advisors met with Management in St. Petersburg, FL to discuss Management’s outlook on the business and review information provided to date Management Focus on Projections During the week of January 23, 2017, Management provided and reviewed the Projections with the Committee and the advisors During the week of January 16, 2017, members of the Committee and the advisors separately spoke to Greg Maffei, President and CEO of Lion Interactive to discuss potential engagement Engagement with Lion / Queen —Committee and advisors indicated we are in process of evaluating standalone plan and strategic alternatives, which would take several weeks 4
Key Work Streams and Objectives Work Stream Objectives Parties Responsible Progress Committee approval of projected income statement, balance sheet and cash flow items for 2017-2021 Management Committee approval Finalization of Projections Consolidation of business and financial information required for 3rd-parties to evaluate Hero opportunity Management, with assistance from advisors Virtual Data Room Preparation Conduct financial analysis on the Projections and potential initiatives Evaluate potential “self-help” options for improving shareholder value, e.g., share repurchases, dividends and business development alternatives Evaluation of Projections and “Self-Help” Alternatives Advisors, with input from Management Evaluate potential strategic alternatives Determine likelihood of other parties participating in a sale process for Hero Identification of Potential Strategic Alternatives and Potential Third Parties Management and advisors If Committee decides to engage with Queen, coordinate initial outreach Scenario planning, including communications strategy Exploration of alternative transaction structures Evaluation of a pro forma combination with Queen Advisors and Committee No substantial dialogue to date Engagement with Queen Close coordination between Hero Board, Committee, Management and advisors Near-term timeline driven by timing of 4Q earnings releases and any potential messages from Queen Board, Committee, Management and advisors Next Steps 5
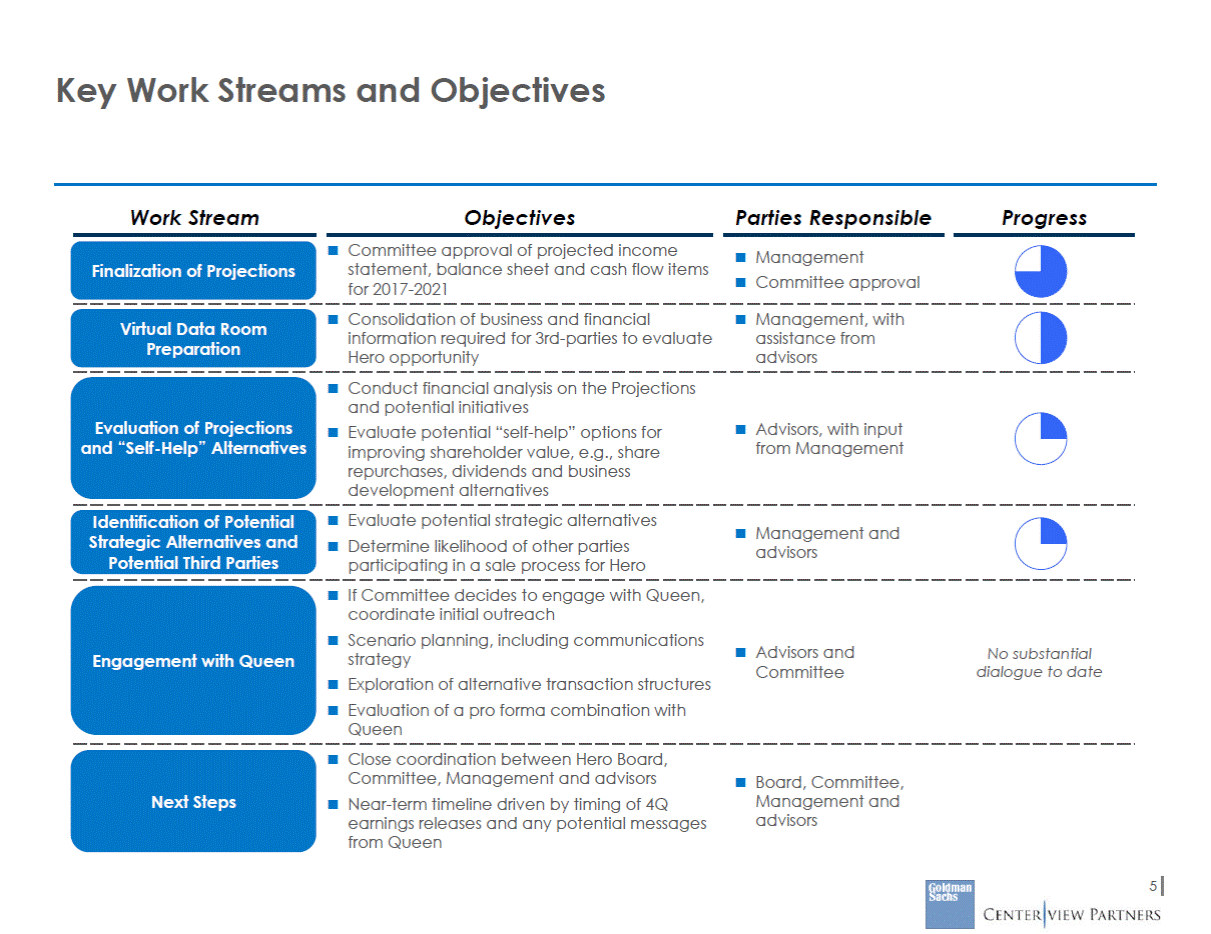
Key Valuation Questions for the Special Committee Committee and advisors will work closely to conduct thorough evaluation of alternatives Focus Areas Questions To Be Validated Macroeconomic environment Assessment of Projections and potential value creation Risks and ability to deliver Current valuation and credibility with investors How much value can be created by the plan? Standalone Plan Assessment as the “Base Line” How confident is Management and the Committee in the achievability of the Projections? What do we believe are the likely macro impacts on the business going forward? Evaluation of other alternatives for shareholder value creation, including execution risk of each Impact on growth, profitability and valuation What are Hero’s strategic alternatives (self-help, acquisitions, separation of segments, broader process, etc.) and how do those compare? Other Alternatives Reverse diligence on Queen Pro forma strategic positioning Growth, profitability and cash flow Potential synergies Pro forma ownership and leverage profile Value to Hero shareholders Transaction certainty What is the value of the pro forma entity and what does that imply for Hero shareholders? Value Creation in Queen Combination What is the synergy opportunity? Do we believe in Queen’s plan and their ability to deliver? 6
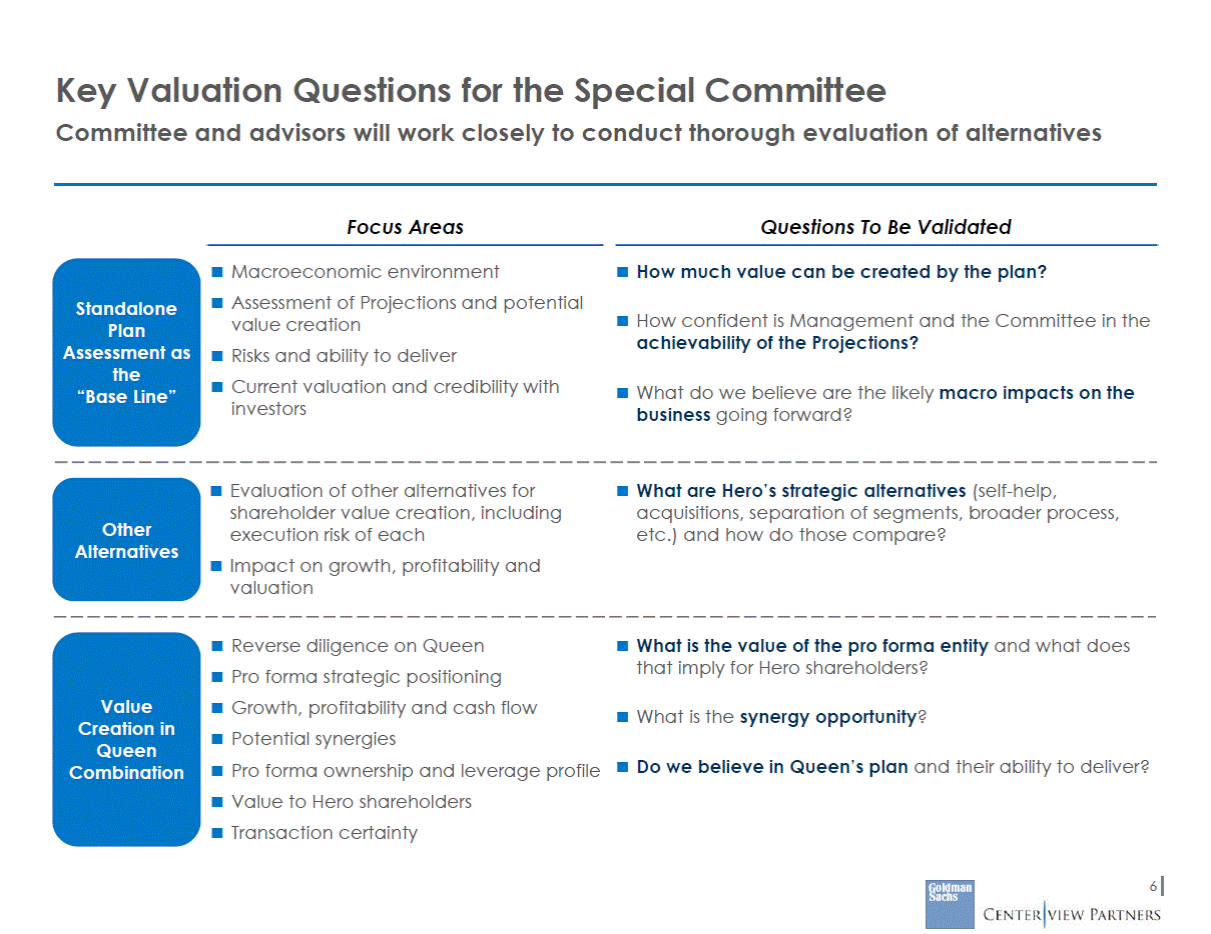
How Advisors Will Help The Committee Address Key Questions Stock price history, total shareholder returns vs. peers Analyst perspectives and their evolution Hero Public Market Update State of retail industry, recent trends and outlook Hero and Queen positioning in industry Review of Macro and Industry Trends Review of historical performance; comparisons vs. budgets Analysis of plan assumptions; risks to plan initiatives; benchmarking vs. peers and historical performance Valuation (share price, analyst price targets, premiums paid, trading and M&A multiples, DCF, PV of future share price, LBO) Review of Hero Financial Performance and Standalone Plan Preliminary Hero Valuation Analysis Analysis of spectrum of alternatives (status quo, recap/capital returns, bolt-on M&A, split/spin options, repurchase Queen stake, sale options) Evaluation of Potential Strategic Alternatives Stock price, shareholder returns vs. peers, financial performance Analyst perspectives and their evolution Queen Situation Update Pro forma strategic positioning, financial profile and synergies Accretion/dilution, contribution analysis and pro forma valuation Evaluation of Combination with Queen Key process considerations and implications Next steps Process Update and Key Next Steps 7
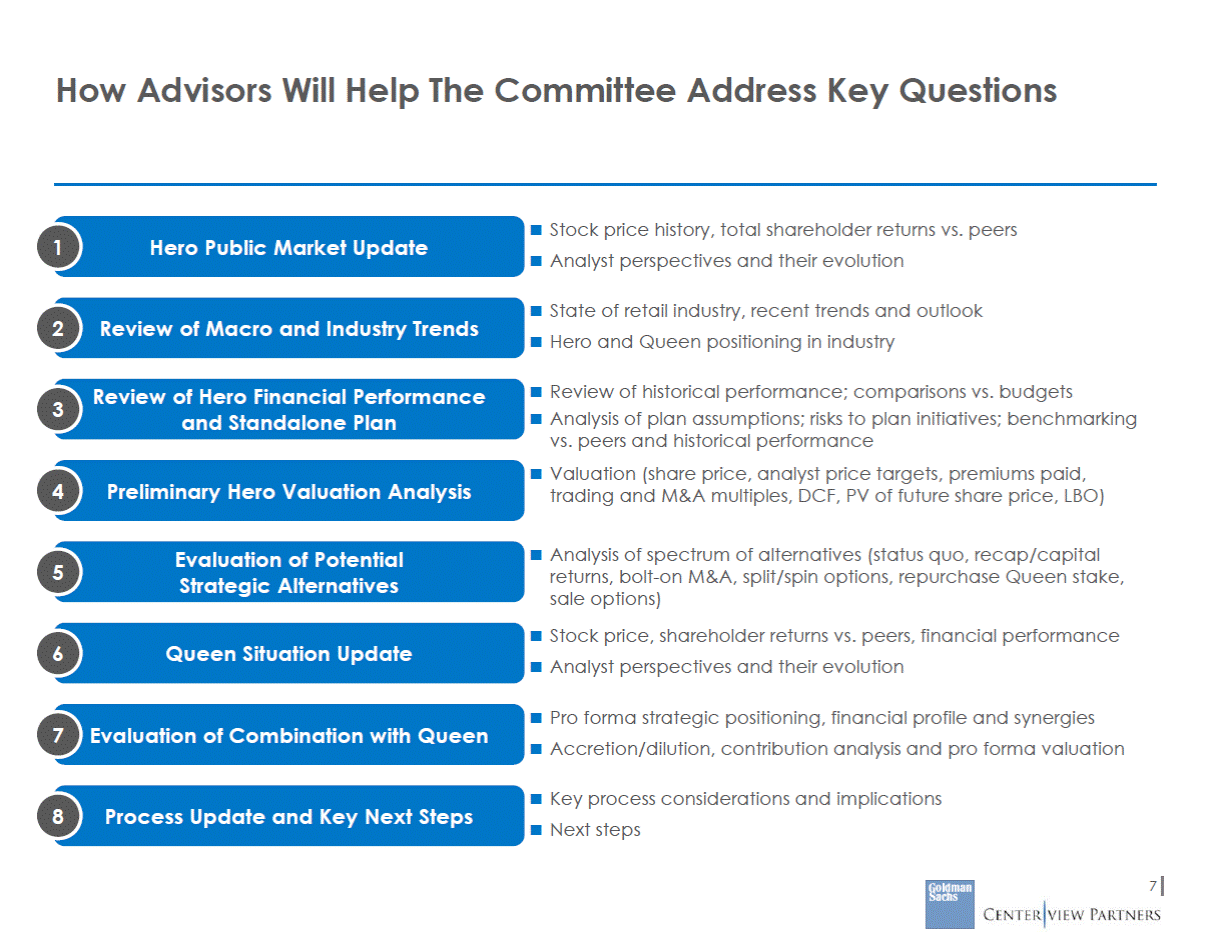
Identification of Potential Strategic Alternatives “Menu of Options” for Hero Illustrative “Menu of Options” for Hero Status Quo With Plan Enhancements Effect Separation of Hero Stake from Queen Status Quo Break-up of Hero Sale of Hero Maintain control of Hero, although Queen continues to own a 38% stake Benefit from the value creation from Hero’s standalone plan Maintain control of Hero, although Queen continues to own a 38% stake Benefit from the value creation from Hero’s standalone plan supplemented with plan enhancements such as acquisitions, upside initiatives or capital structure moves Separate Cornerstone from Hero, likely through a sale Hero to become independent from Queen with broad shareholder base Possibly achieved through: — Offer to buy Queen’s 38% stake in Hero — Queen spin-off of Hero stake — Cash rich split-off Sale of Hero to Queen or interested third party Process options include: — One-on-one negotiations with Queen — Post-signing process through a go-shop provision after signing a deal with Queen — Pre-signing process allowing interested third parties to participate 8
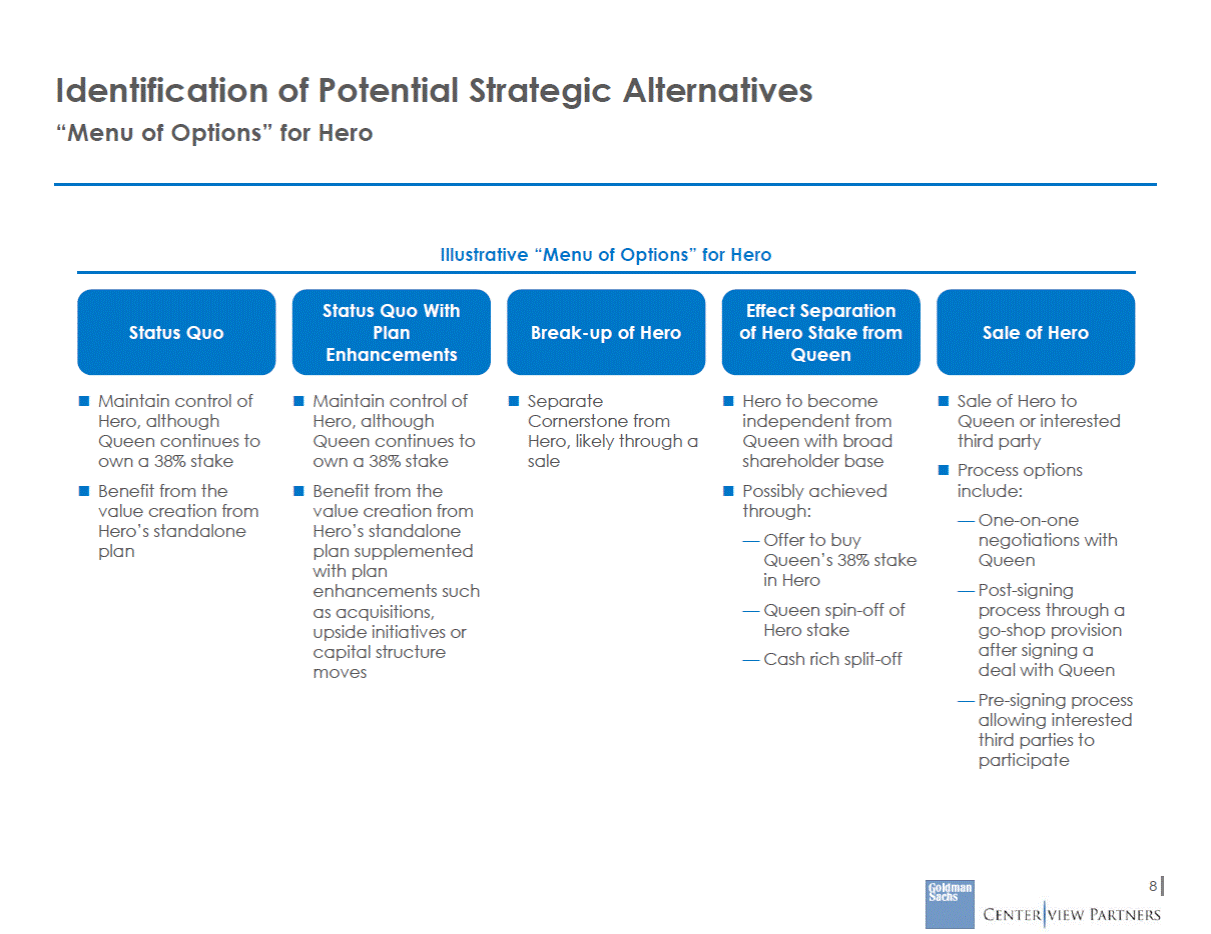
Illustrative Near-Term Process Timeline Key Events Illustrative Near-Term Calendar Timeline subject to when/how we expect to engage with Queen going forward January 30: Qualified Directors Meeting —Discuss preliminary observations and Queen background materials —Confirmation of Projections Week of January 29 – February 4: Advisors continue to evaluate alternatives Week of February 6: Committee meeting to discuss preliminary perspectives on alternatives February 23: Hero Board meeting February 28: Hero 4Q earnings release (tentative)(1) March 2: Queen Q4 earnings release (estimated)(1) 9 In 2016, Hero released Q4 earnings on Wednesday, Feb 24th, and Queen on Friday, Feb 26th. (1) Federal Holiday February S M T W Th F S 1 2 3 4 5 6 7 8 9 10 11 12 13 14 15 16 17 18 19 20 21 22 23 24 25 26 27 28 1 2 3 4 January S M T W Th F S 1 2 3 4 5 6 7 8 9 10 11 12 13 14 15 16 17 18 19 20 21 22 23 24 25 26 27 28 29 30 31
Overview of Hero Management Projections
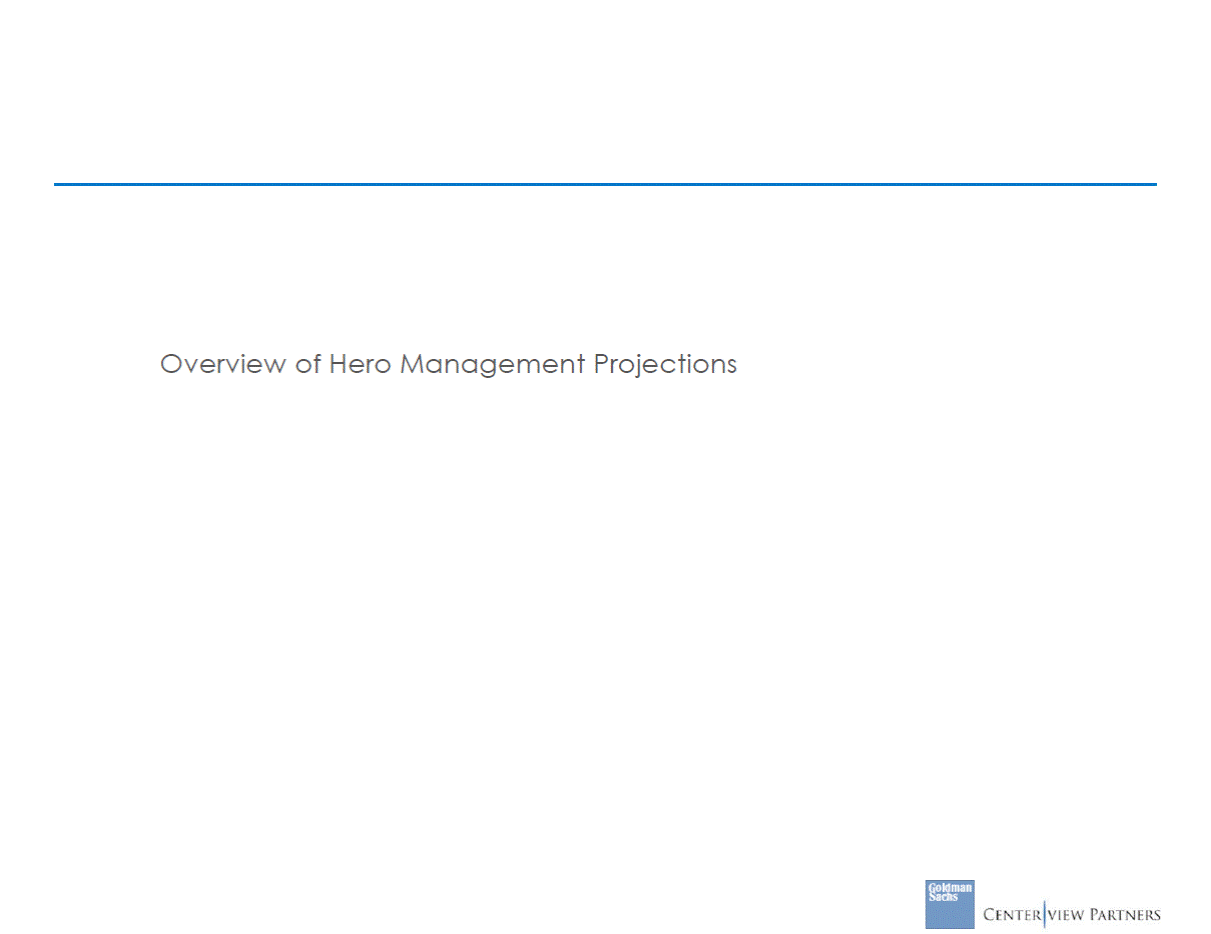
Overview of Management Projections Projections reflect a return to historical levels of growth and margin improvements driven by in-process initiatives Projections imply a return to historical levels of growth (prior to challenging 2016) — Top-line initiatives include improvements to TV distribution and viewer experience (e.g., one-click remote-buying), product pricing and expanding digital capabilities, etc. A number of in-process initiatives expected to drive margins above historical levels — Initiatives include supply chain efficiencies (tailwind from resolution of Piney Flats issues and automation), merchandising initiatives, etc. The Projections reflect a number of positive developments in December and January: — Resolution of Piney Flats issues; increased confidence in ability to drive margin improvement led by new Chief Merchandising Officer; clarified view of trends in business mix — Broker estimates do not reflect these developments and as a result lag the Projections — Resulted in stronger outlook for 2017 relative to Plan shared with Board in December Relative to Queen, Hero top-line growth is in-line but EBITDA growth and margin expansion is higher due to a low 2016 base and the initiatives discussed above Overview of Hero Projections Broad retail industry conditions have been challenging over the past two years, but positive signs seen at the end of 2016 — TBD if recent trends represent temporary or sustained reversal Hero underperformed its 2014 plan as a result of these headwinds and operating challenges; reflects difficulty of forecasting in an uncertain operating environment — Hero’s underlying key performance indicators consistent with broader industry trends Risks to Plan in Context of Retail Industry Projections subject to further review and evaluation with the Committee and Management, including review of upsides and potential risks 11
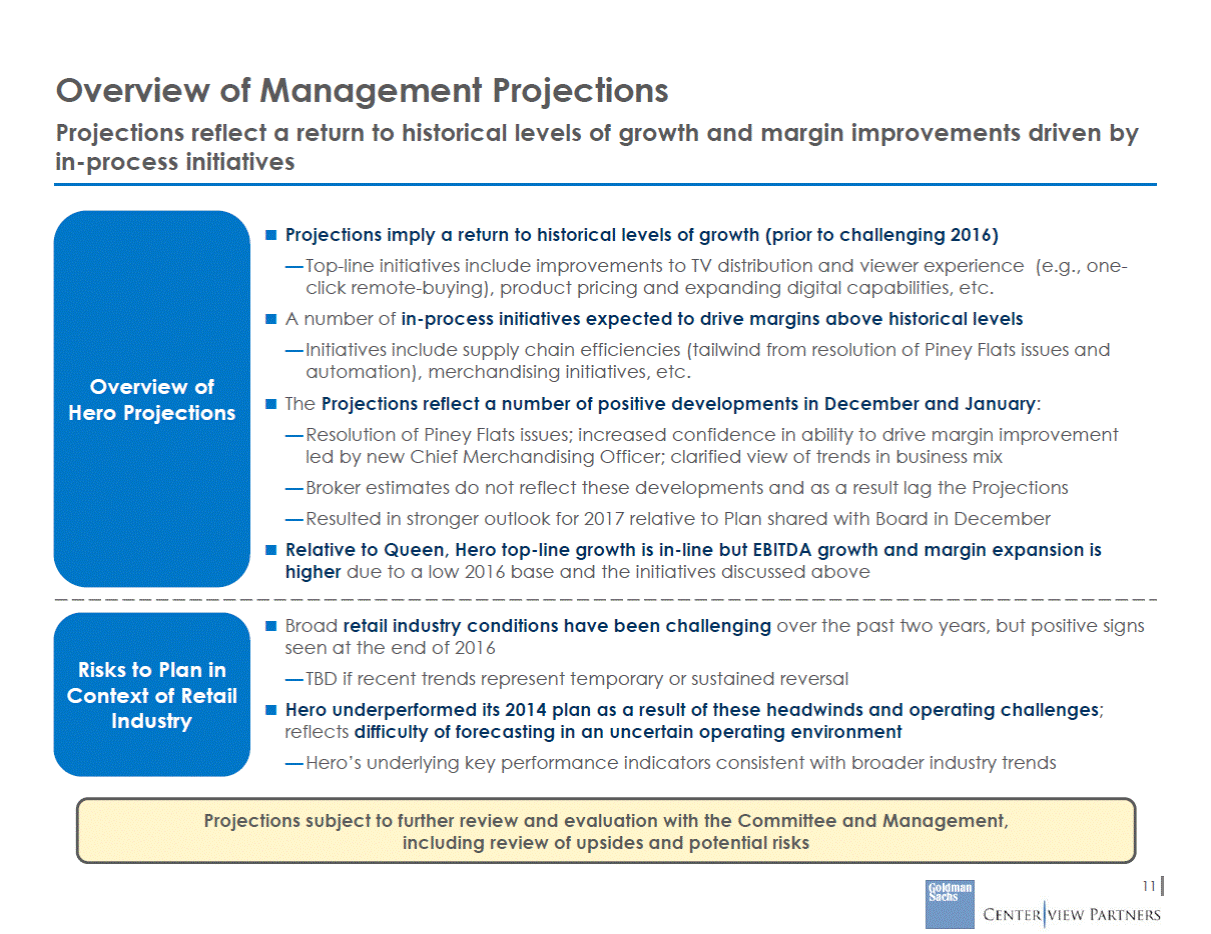
Projections Summary Projections imply 8.1% Adjusted EBITDA CAGR and 7.4% EPS CAGR from 2016A-2021E 12 Source: Hero Management. (1) (2) Adjusted EBITDA is before deduction of stock based compensation expense. Comparable EBITDA is after deduction of stock-based compensation expense. Historical 2014A2015A2016A HSN Revenue$2,476$2,542$2,475 Cornerstone Revenue1,1141,1511,095 (Less): Eliminations(2)(2)(2) Projections 2017P2018E2019E2020E2021E $2,549$2,626$2,704$2,785$2,869 1,0891,1621,2431,3161,390 (1)(1)(1)(1)(1) '14-'16A'16A-'21E CAGRCAGR (0.0%)3.0% (0.9%)4.9% Total Revenue$3,588$3,691$3,567 YoY Growth2.9%(3.3%) $3,637$3,786$3,946$4,100$4,257 1.9%4.1%4.2%3.9%3.8% (0.3%)3.6% Gross Profit$1,273$1,315$1,217 $1,251$1,316$1,383$1,447$1,513 (2.2%)4.5% % Margin35.5%35.6%34.1% 34.4%34.8%35.0%35.3%35.5% (Less): Operating Expenses($926)($957)($918) ($944)($970)($1,006)($1,039)($1,072) % of Sales25.8%25.9%25.7% 26.0%25.6%25.5%25.3%25.2% Adjusted EBITDA(1)$342$357$299 % Margin9.5%9.7%8.4% $307$346$377$408$441 8.4%9.1%9.5%9.9%10.4% (6.5%)8.1% (Less): D&A / FA Sale (44) (44) (43) (Less): SBC (16) (18) (19) (Less): Adjustments 2 (11) (31) Reported EBIT$285$284$206 (Less): Net Interest(7) (15)(16) Pre-Tax Income$278$269$190 (Less): Taxes (105) (100)(71) Net Income$173$169$119 Plus: Adjustments 0 6 20 Adjusted Net Income$173$176$138 (47)(49)(52)(56)(59) (21)(22)(22)(23)(24) ––––– $238$275$302$329$358 (18)(18)(18)(18)(18) $221$257$284$311$340 (83) (96) (107) (117)(128) $138$161$178$195$213 ––––– $138$161$178$195$213 (15.0%)11.7% (10.6%)9.0% Adjusted EPS$3.23$3.28$2.62 YoY Growth1.7%(20.3%) $2.61$2.98$3.24$3.48$3.74 (0.4%)14.4%8.5%7.6%7.4% (9.9%)7.4% Memo: Diluted Shares53.653.552.9 Tax Rate37.7%37.1%37.4% Comparable EBITDA(2) $327$339 $280 52.953.954.955.956.9 37.5%37.5%37.5%37.5%37.5% $286$324$354$385$417 (7.4%)8.3%
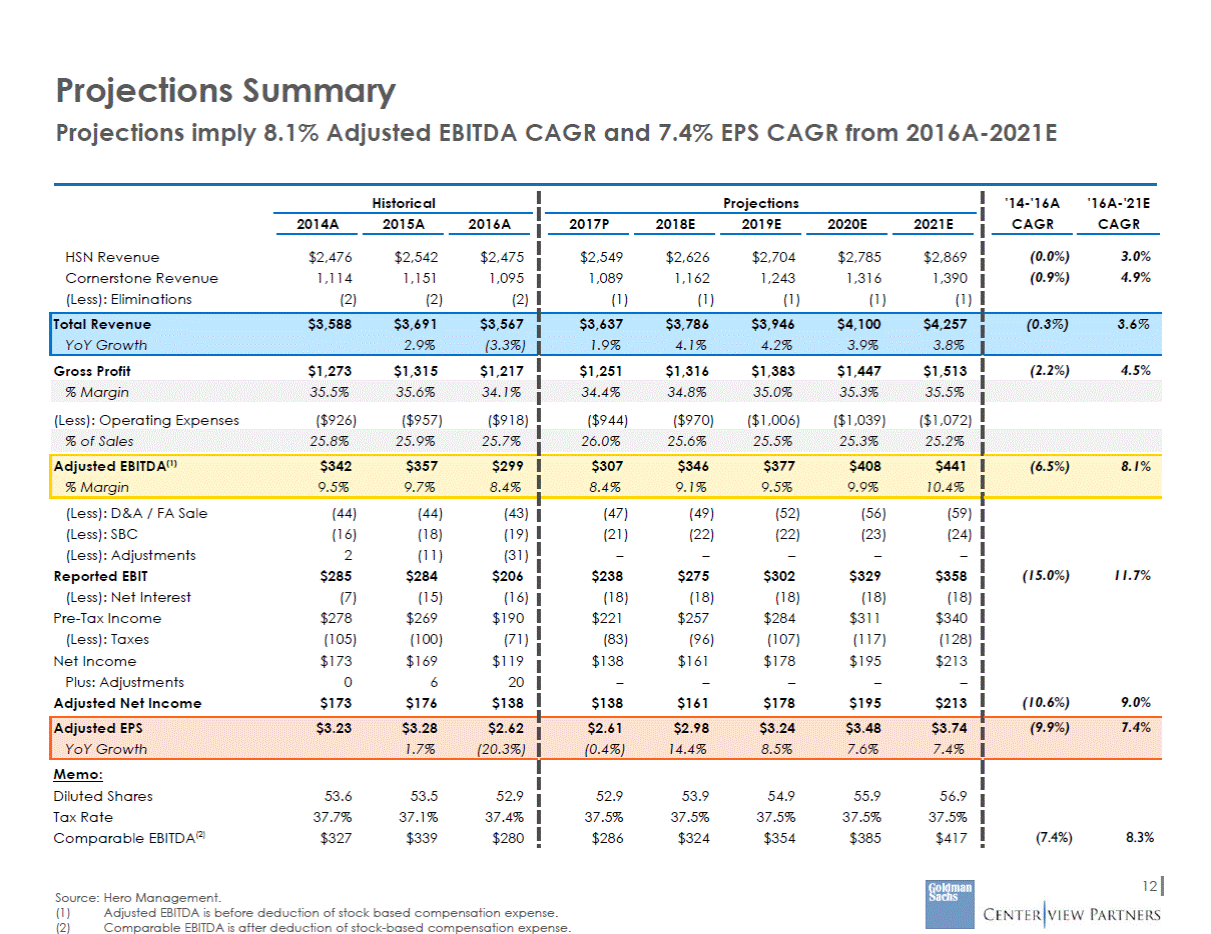
Projection Assumptions in Context Projections reflect a return to historical growth rates and HSN segment margin expansion driven by in-process initiatives Adjusted EBITDA Margin(1) Revenue CAGR 3.9% 12.9% 10.5% 10.4% HSN (2.7%) '12A - '15A HSN Avg. '16A HSN '17P HSN '21E HSN '12A - '15A HSN '16A HSN '16A - '21E HSN 4.7% 4.9% 6.1% 3.7% Cornerstone (4.9%) '12A - '15A CBI '16A CBI '16A - '21E CBI '12A - '15A CBI Avg. '16A CBI '17P CBI '21E CBI 13 Source: Hero Management. (1) Adjusted EBITDA is before deducting stock based compensation expense. 5.0% 3.9% 11.4% 3.0%
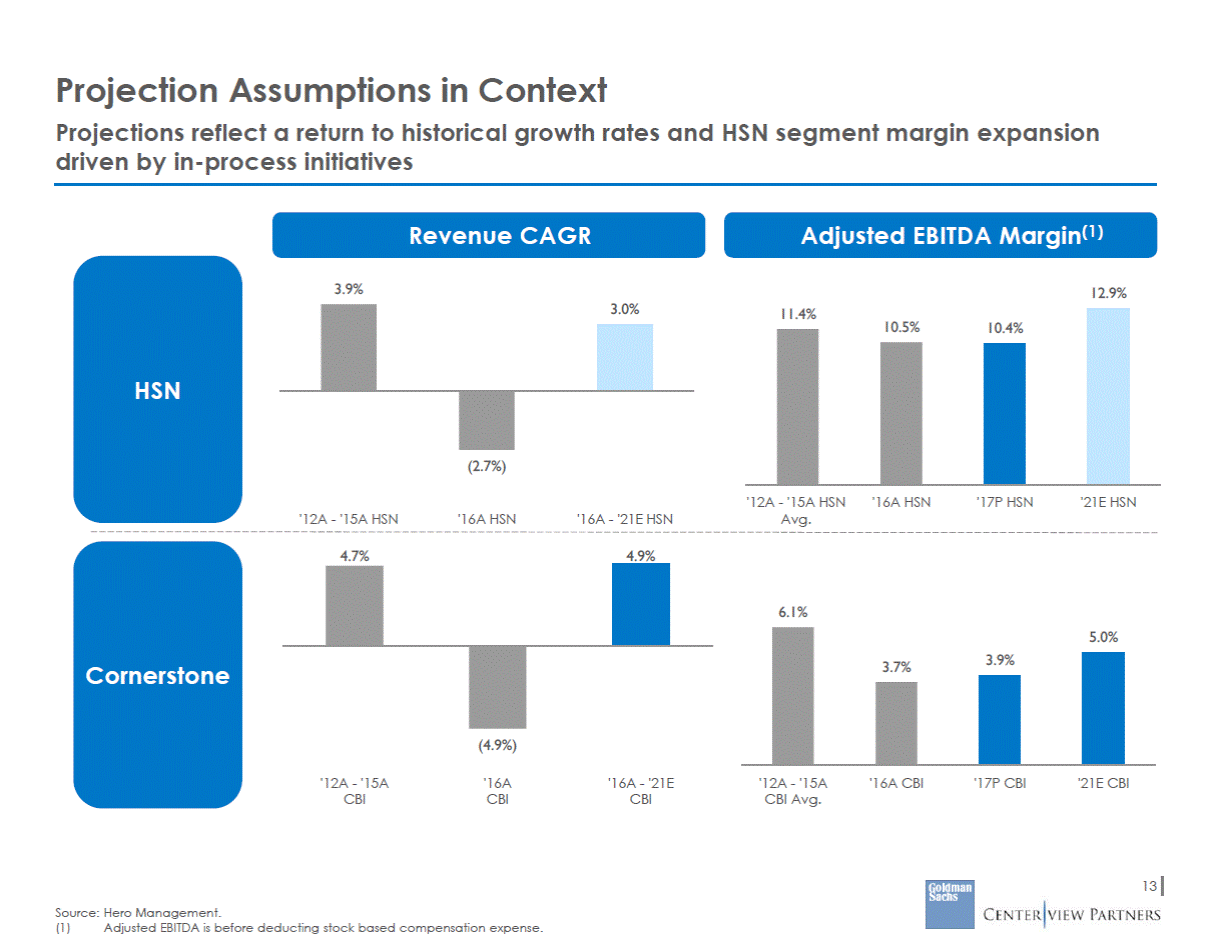
Projections Versus Consensus Projections are in excess of Street expectations; however, Broker estimates do not reflect reversal of trends and Hero’s positive performance in recent months Adjusted EBITDA(1) Revenue EPS $4.00 $4,400 $450 $408 % $4,200 $400 00 % 48 4% 7 % $3.50 $382 % $4,000 99 % $350 $3,800 $3.00 $300 $3,600 $2.50 $3,400 $250 '16A '17P '18E '19E '20E '16A '17P '18E '19E '20E '16A '17P '18E '19E '20E YoY Hero Management 1.9% 4.1% 4.2% 3.9% 2.6% 12.7% 8.9% 8.2% (0.4%) 14.4% 8.5% 7.6% Adj. EBITDA Hero Management 8.4% 8.4% 9.1% 9.5% 9.9% Hero Consensus Estimates Hero Management ’16A – ’20P CAGR 14 Source: Hero Management and Factset estimates as of January 27, 2017. Note:Dollars in millions. (1) Adjusted EBITDA is before deduction of stock based compensation expense. Margin Hero Consensus 8.2% 8.6% 9.0% 9.5% 9.8% Growth Hero Consensus 0.5% 3.6% 2.6% 3.1% 4.9% 8.6% 7.9% 6.3% 5.2% 9.9% 6.2% 7.0% Number of Analysts 7 6 3 3 5 5 3 3 7 6 2 2 $3. 7. $3.3 7.1 $2.70 $2.61 8.1 6.9 $306 $307 $4,1 3.5 $3,8 2.4 $3,637 $3,557
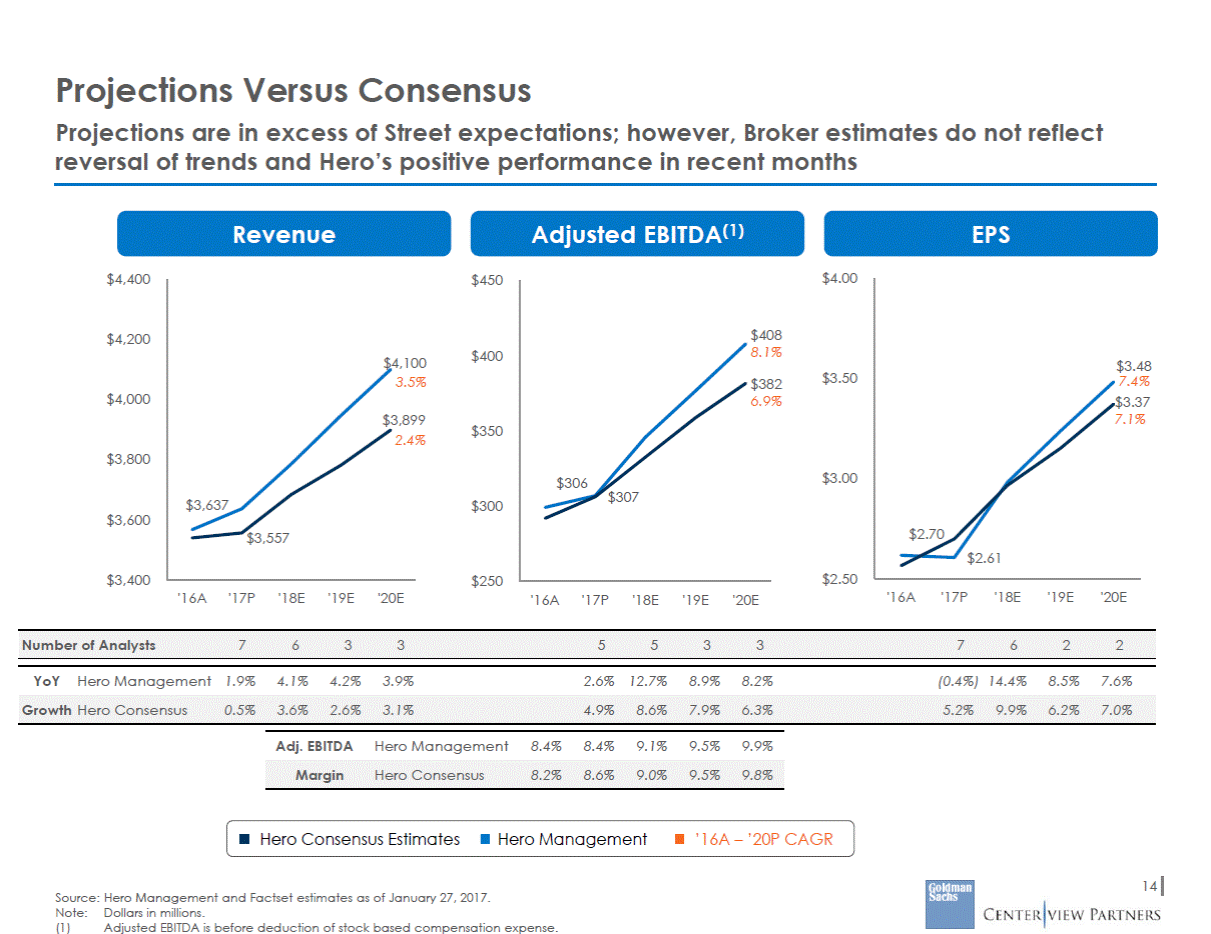
Projections vs. Management Plan Shared with Board in Dec. 2016 Positive developments in December and January contributed to better 4Q performance and a stronger outlook for 2017 Projections reflect stronger view on 2017 than Plan shared with the Board in December Changes driven by a number of positive developments in December and January — Resolution of Piney Flats issues — Increased confidence in ability to drive margin improvement led by new Chief Merchandising Officer — Clarified view on trends in business mix 2017 Revenue 2017 Gross Profit 2017 Adj. EBITDA(1) 2017 EPS $2.61 $1,251 $307 $3,637 December Plan Current Plan December Plan Current Plan December Plan Current Plan December Plan Current Plan % YoY Growth % Margin % Margin % YoY Growth 0.7% 1.9% 1.3% 2.8% (4.5%) 2.6% (9.9%) (0.5%) 15 Source: Hero Management. Note:Dollars in millions. (1) Adjusted EBITDA is before deduction of stock based compensation expense. $3,591 $286 $1,233 $2.36
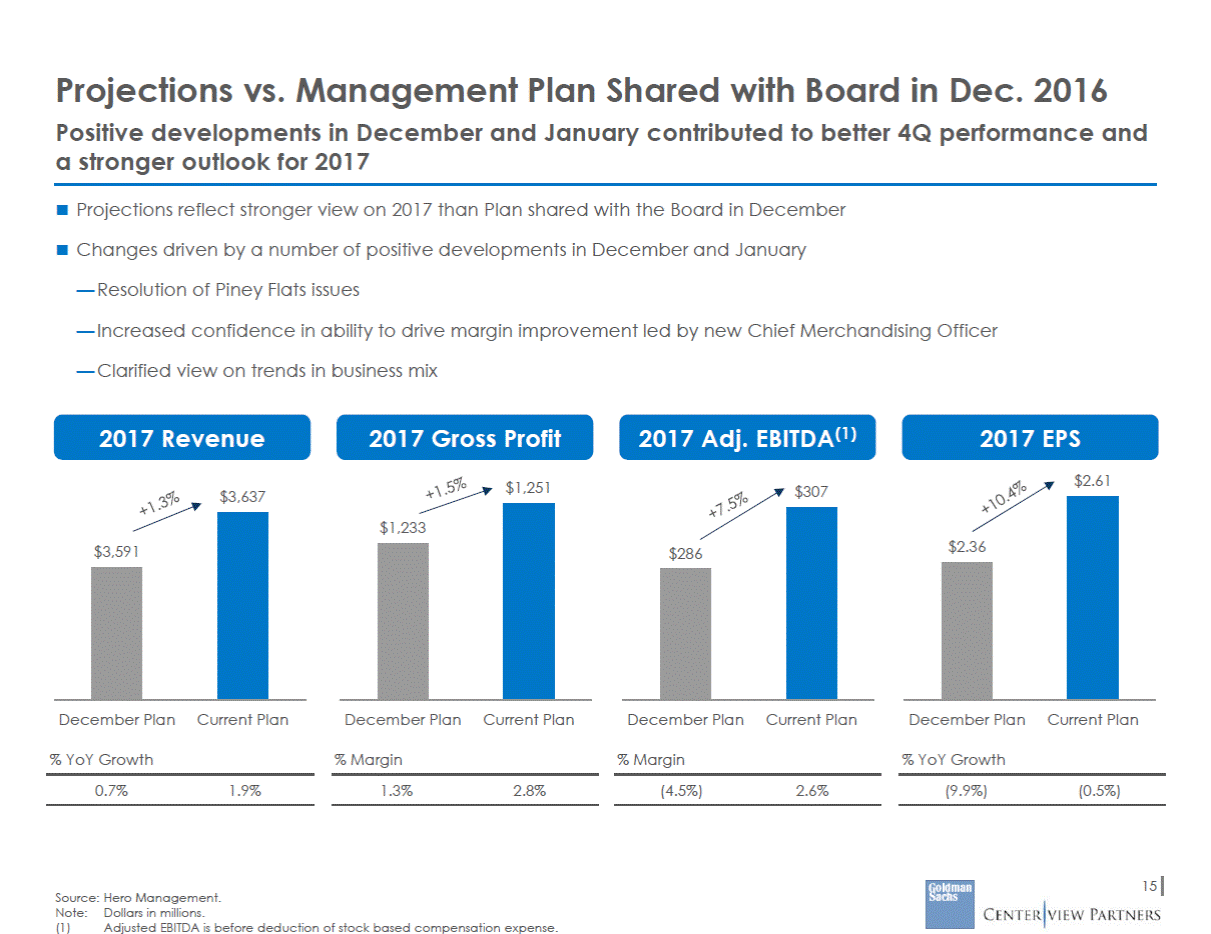
Peer Growth Benchmarking Hero’s EBITDA growth expected to outpace Queen’s over near-term due to numerous margin enhancement initiatives; perception of little room for Queen margin improvement Revenue CAGR Hero’s expected revenue growth in-line with expectations for Queen’s U.S. business Comparable EBITDA CAGR Hero’s expected EBITDA growth a function of low current base and margin enhancement initiatives over near-term Perception that Queen margin has little room for improvement Comparable EPS CAGR Hero EPS outlook below Queen’s but does not reflect total return Potential uses of Hero cash include potential debt repayment and dividends 2016E - 2018E '14A - '16E 2016E - 2018E '14A - '16E 2016E - 2018E '14A - '16E eCommerce 6.1% (9.8%) Home Stores 8.1% (7.0%) Home Stores 17.2% (10.9%) Specialty Retail 4.6% 3.1% Hero Mgmt. eCommerce 7.6% (7.4%) 9% (22.2%) (1) Queen 8% (4.1%) eCommerce Queen 7.0% (20.7%) % 3.9% Home Stores 6% 3.0% Hero Consensus Specialty Retail (8.6%) (0.4%) 6.8% 8% Hero Mgmt. 0% (0.3%) Hero Consensus (1) Queen (1.5%) (10.8%) 8% (2) Queen - U.S. 0% 1.1% Specialty Retail Hero Consensus Department/ Mass (2.3%) Hero Mgmt. (9.9%) 2% (0.7%) Department/ Mass Department/ Mass 1.2% (3.4%) (3.7%) Source: Hero Management and Factset fiscal year estimates as of January 27, 2017. Note: Specialty Retail includes BBY, DKS, FL, FOSL, GNC, TIF, ULTA. Home Stores includes BBBY, ETH, PIR, RH, WSM. Department/Mass includes DDS, KSS, M, JWN, ROST, TGT, TJX, WMT. eCommerce includes EBAY and OSTK; eCommerce EPS includes only EBAY. Comparable EBITDA is after deduction of stock-based compensation expense. Comparable EPS is after deduction of stock-based compensation expense and before deduction of after-tax intangible amortization. Queen 2014 revenue and EBITDA pro forma for zulily acquisition, not pro forma for reattribution of Digital Commerce Business. Queen U.S. represents consensus estimate for U.S. segment only. 16 (1) (2) 9. 9.1 8. 7.5% 6.7% 3.8% 5. 5. 0.9% 3. 3. 3. 3. 2.0% 2.0%
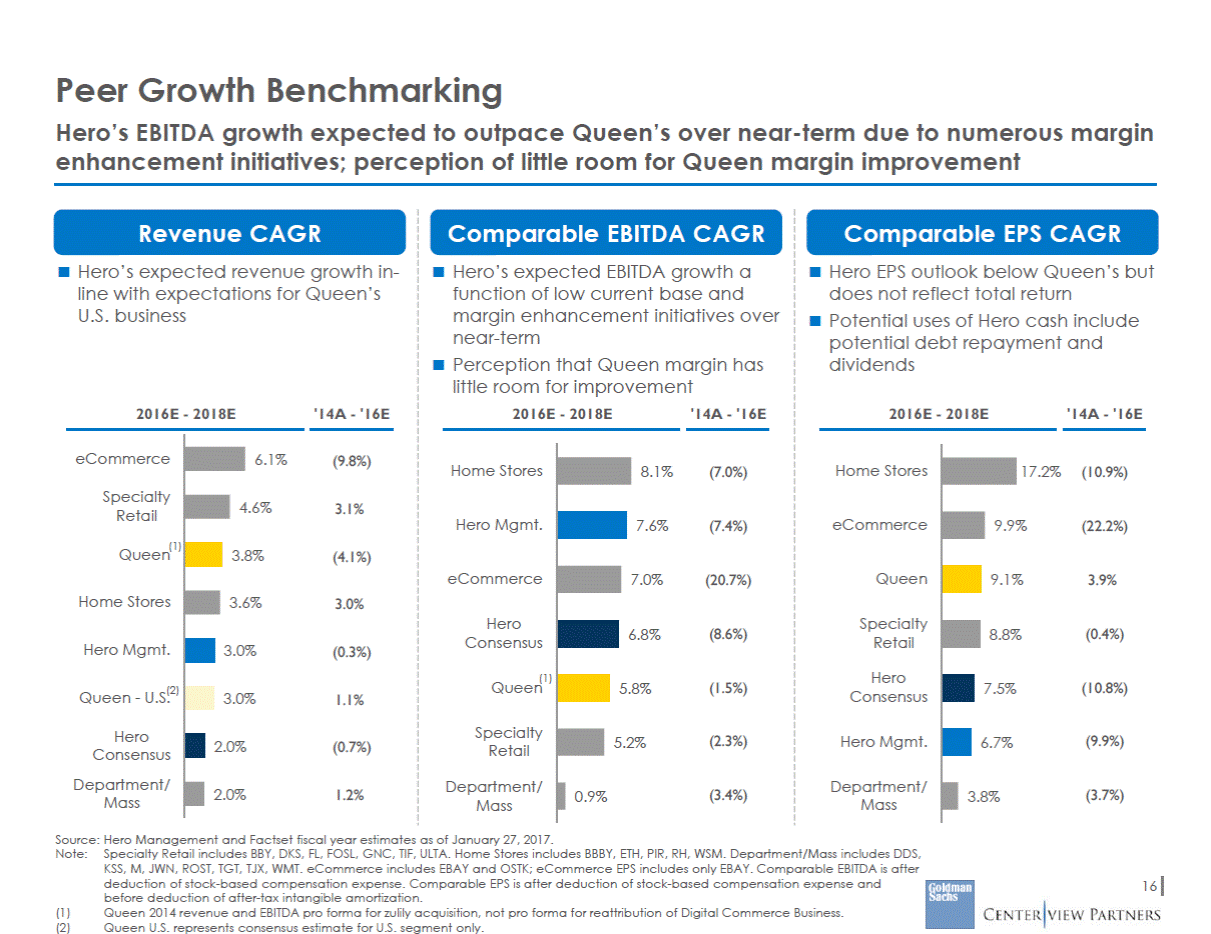
Peer Margin Benchmarking Hero’s gross margin in-line with Queen, but EBITDA margin differential reflects Hero’s higher investment in viewer content; merchandising initiatives to expand margins Gross Margin Hero current gross margin in line with Queen’s Hero gross margin outlook reflects potential cost savings from sourcing initiatives/supply chain efficiencies Comparable EBITDA Margin Lower Hero EBITDA margin relative to Queen reflects Hero’s higher investments in content/differentiated viewer experience, and economics with TV operators In-process merchandising initiatives driven by new Chief Merchandising Officer expected to expand margins Margin Exp. / Contr. Margin Exp. / Contr. 2016E Gross Margin '14A - '16E '16E - '18E 2016E EBITDA Margin '14A - '16E '16E - '18E (1) Queen eCommerce 450 bps (37) bps 17.9% 95 bps 68 bps 48.0% eCommerce Home Stores (171) bps 51 bps 17.7% 40.1% 157 bps (2) bps Specialty Retail Specialty Retail (41) bps (8) bps 5% 0% (66) bps 26 bps Department/ Mass Hero Consensus % (117) bps 23 bps (113) bps (18) bps Home Stores Hero Mgmt. 1% (138) bps 72 bps (204) bps 59 bps Hero Mgmt. Queen 135 bps (68) bps (126) bps 72 bps Hero Consensus Department/ Mass (35) bps 45 bps (140) bps 73 bps Source: Hero Management and fiscal year Factset estimates as of January 27, 2017. Note: Specialty Retail includes BBY, DKS, FL, FOSL, GNC, TIF, ULTA. Home Stores includes BBBY, ETH, PIR, RH, WSM. Department/Mass includes DDS, KSS, M, JWN, ROST, TGT, TJX, WMT. eCommerce includes EBAY, OSTK. FOSL excluded from EBITDA metrics. Comparable EBITDA is after deduction of stock-based compensation expense. Queen 2014 gross margin and EBITDA pro forma for zulily acquisition, not pro forma for reattribution of Digital Commerce Business. 17 Note: (1) 39. 34.3 34. 33.2% 32.1% 14. 11.3% 10.3% 7.8% 7.7%
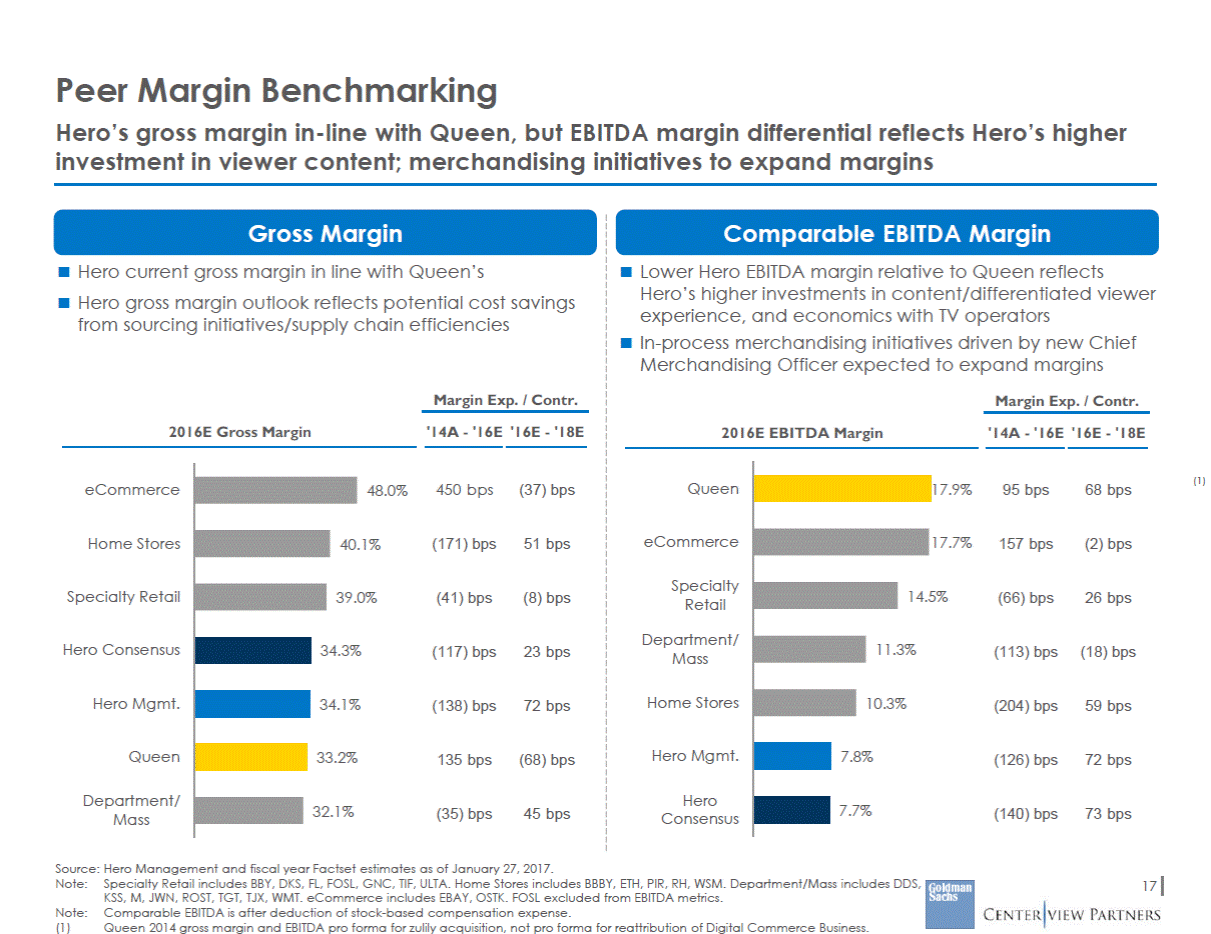
Broad Retail Industry Trends Have Been Challenging… Broad retail industry conditions have been challenging over the past two years, but positive signs seen at the end of 2016; TBD if recent trends represent temporary or sustained reversal Consumer Confidence Consumer confidence has weighed on retail over the past few years but has surged to a post-recession peak since the election Employment/Wages U.S. unemployment rate has steadily declined since 2010; however, record number of people not in labor force (~19% of working age population) Wage growth remains stagnant (real average hourly earnings up 1.4% annually from Nov. 14 – Nov. 16) Inflation CPI has been stable over past 2 years Inflation expected to be 2.1% in 2017 2.1% 2% 1% – (1%) (2%) 100 97 94 $15 $10.7 91 88 85 $10 11.1%) $5 Jan-15 Aug-15 Apr-16 Dec-16 Jan-15 Jul-15 Jan-16 Jul-16 Dec-16 Jan-15 Aug-15 Apr-16 Dec-16 Average hourly real earnings (Units: 1982 – 1984 CPI adjusted dollars) Michigan consumer confidence index All urban consumers, seasonally adj. eCommerce Growth over Traditional Retail YoY eCommerce growth has gone from 25% in 2001 to 15% in 2015; YoY retail growth excluding eCommerce has declined from 3% in 2001 to 0.5% in 2015 Amazon capturing increasing share Competitive Promotional Environment Margins have decline in many retail sectors, primarily driven by heavy promotional activity Declining Mall Traffic Mall traffic has declined YoY in 142 out of 153 weeks since February 1, 2015 Christmas and Easter are drivers of rare positive mall traffic growth 15% 40% 5% 10% 7.3% 38% (5%) 5% .6% (15%) 36% 0% Jan-15Aug-15 Apr-16 Dec-16 '00 '05 '10 '15 (25%) Feb-14 Jan-15 Dec-15 Dec-16 Weighted Avg. LTM “Home Stores” Peer Gross Margin(1) Annual eCommerce Sales as % of Total Total Weekly Traffic YoY % Growth 18 Source: Factset, U.S. Census Bureau, Wall Street research and company filings as of January 27, 2017. (1) Home Stores includes BBBY, ETH, PIR, RH, WSM. Retail Operating Environment Macroeconomic Environment 37 0.9% Bump following U.S. election0.1% ( (0.2%)
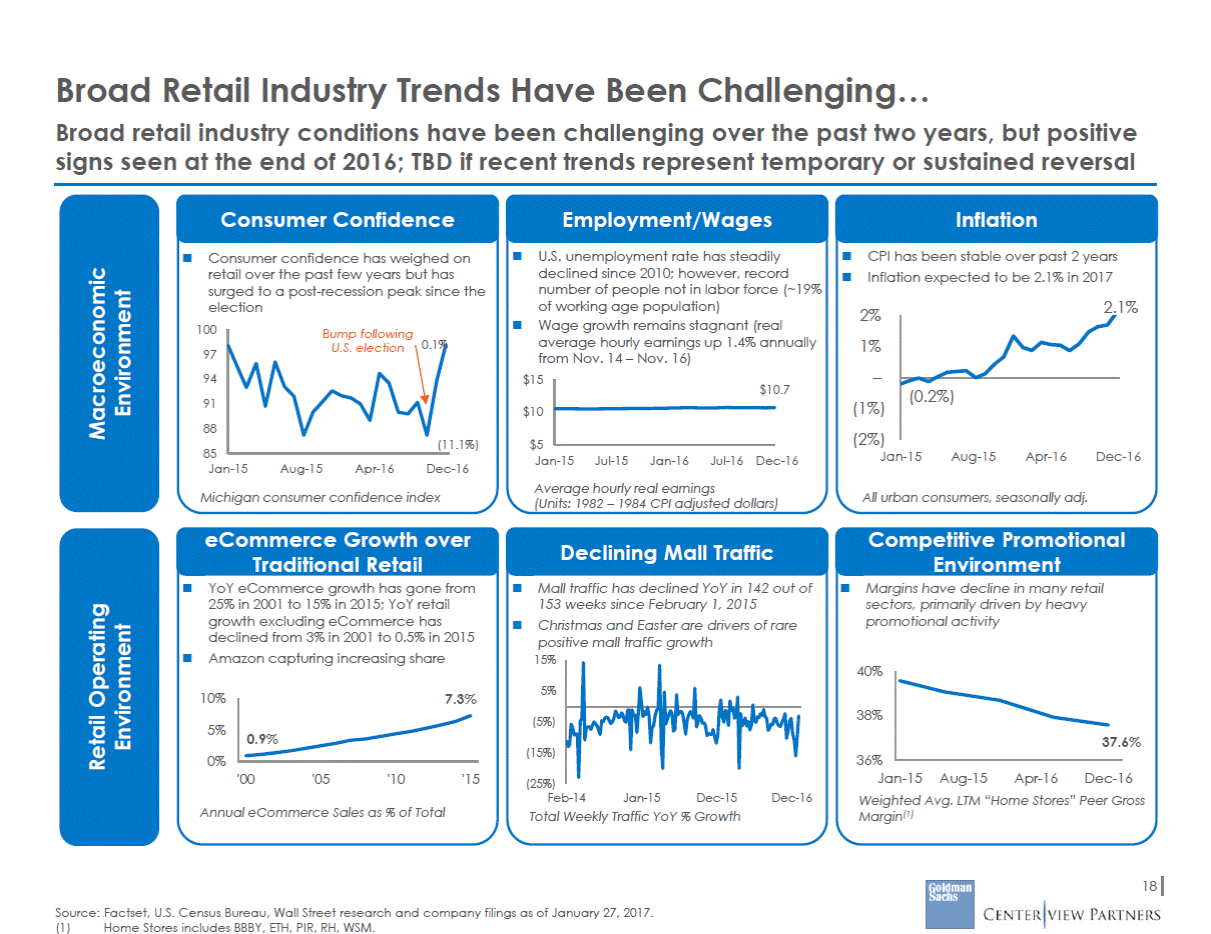
…and Have Pressured Retail Financial Performance and Valuation Weak/negative top-line growth and declines in cash flow have pressured stock prices and valuations across the retail space Same-Store Sales Growth(1) Represents average YoY comparable sales growth EBITDA(2) Represents indexed weighted average LTM peer EBITDA Retail 6% s 102 Financial Performance ment/Mass ’14-’16E CAGR: (3.3%) 100 100 4% 2% 0% -2% Dec-14 Jun-15 Dec-15 Jun-16 Dec-16 Dec-17 1Q15 2Q15 3Q15 4Q15 1Q16 2Q16 3Q16 Stock Prices Have Declined… …Largely Due to P/E Contraction $80 20x $70 4% (9%) (23%) 18x $60 (14%) (21%) (27%) (30%) Sector Valuation 15x $50 13x $40 (44%) (48%) $30 10x Jan-15 Jul-15 Jan-16 Jul-16 Jan-17 Jan-15 Jul-15 Jan-16 Jul-16 Jan-17 Hero Specialty Retail(1) Home Stores(1) Department/Mass(1) eCommerce(1) Source: Factset, Wall Street Research and company filings as of January 27, 2017. 19 (1) Specialty Retail includes BBY, DKS, FL, FOSL, GNC, TIF, Home Stores includes BBBY, ETH, PIR, RH, WSM. Department/Mass includes DDS, KSS, M, JWN, ROST, TGT, TJX, WMT. Includes BBY, DKS, FL, FOSL, GNC, TIF, ULTA, BBBY, ETH, PIR, RH, WSM, DDS, KSS, M, JWN, ROST, TGT, TJX, WMT, NILE, EBAY, OSTK. (2) 95 9394 Specialty Home Store Depart
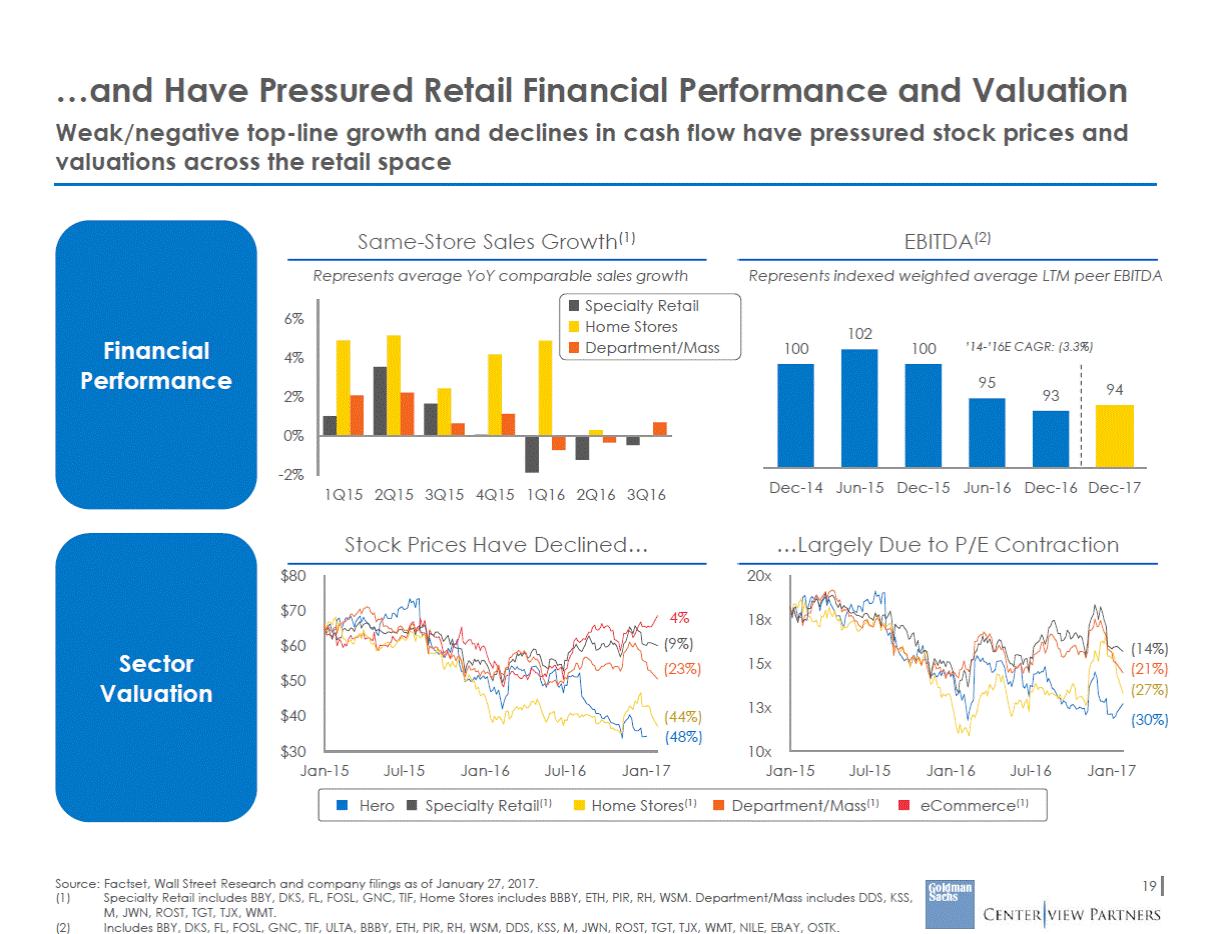
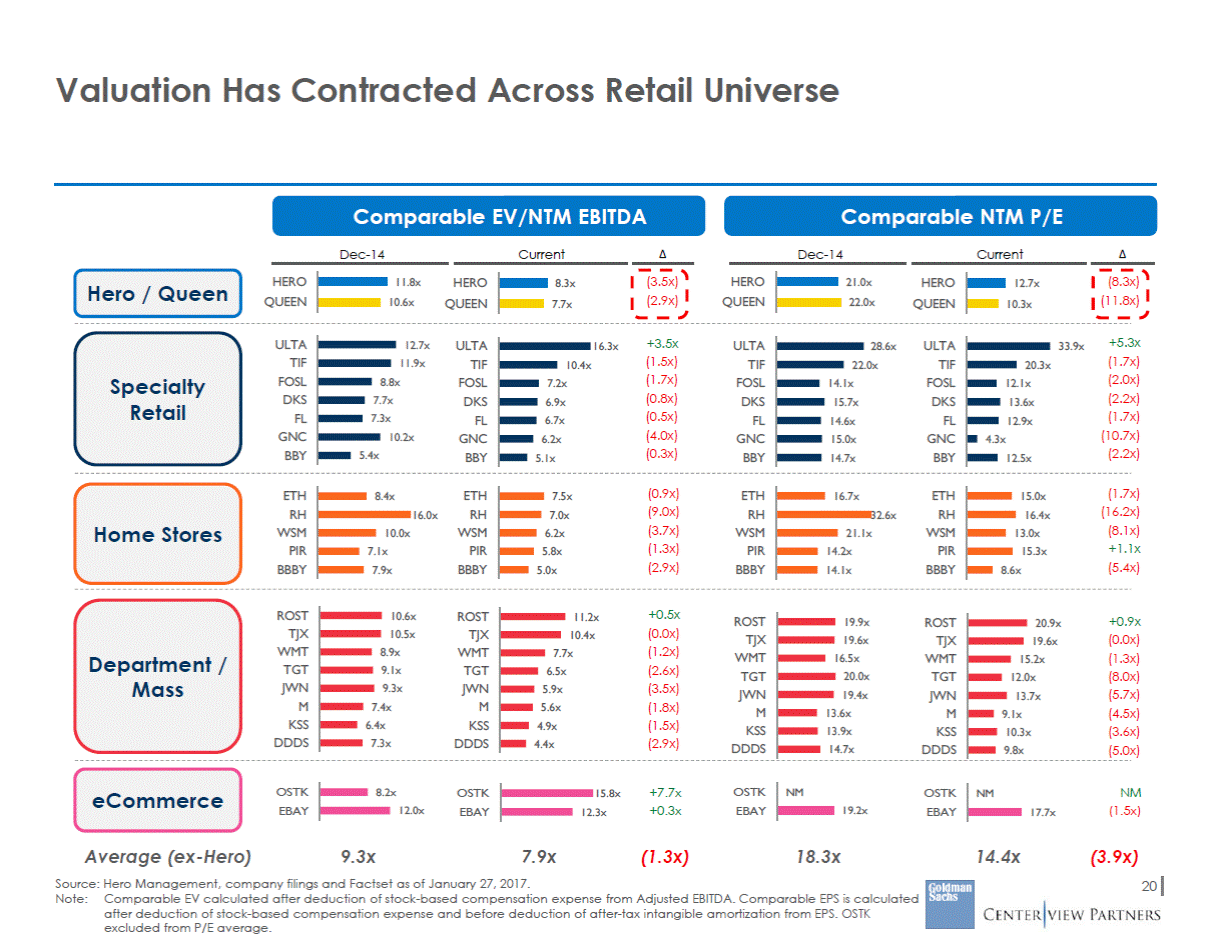
Valuation Has Contracted Across Retail Universe Comparable EV/NTM EBITDA Comparable NTM P/E Dec-14 Current Dec-14 Current HERO QUEEN (3.5x) (2.9x) HERO QUEEN (8.3x) (11.8x) 11.8x 10.6x HERO QUEEN 21.0x 22.0x HERO QUEEN 8.3x 7.7x 12.7x 10.3x Hero / Queen +3.5x (1.5x) (1.7x) (0.8x) (0.5x) (4.0x) (0.3x) +5.3x (1.7x) (2.0x) (2.2x) (1.7x) (10.7x) (2.2x) ULTA TIF FOSL DKS FL GNC BBY 12.7x 11.9x ULTA TIF FOSL DKS FL GNC BBY 16.3x ULTA TIF FOSL DKS FL GNC BBY 28.6x ULTA TIF FOSL DKS FL GNC BBY 33.9x 10.4x 22.0x 20.3x 8.8x 7.7x Specialty Retail 7.2x 6.9x 6.7x 6.2x 14.1x 15.7x 14.6x 15.0x 14.7x 12.1x 13.6x 12.9x 7.3x 10.2x 4.3x 5.4x 5.1x 12.5x (0.9x) (9.0x) (3.7x) (1.3x) (2.9x) (1.7x) (16.2x) (8.1x) +1.1x (5.4x) ETH RH WSM PIR BBBY 8.4x ETH RH WSM PIR BBBY 7.5x 7.0x 6.2x ETH RH WSM PIR BBBY 16.7x ETH RH WSM PIR BBBY 15.0x 16.4x 16.0x 32.6x Home Stores 10.0x 21.1x 13.0x 15.3x 7.1x 7.9x 5.8x 5.0x 14.2x 14.1x 8.6x 9x x) x) x) x) x) x) x) TGT 9.1x TGT (2.6x) 6.5x TGT OSTK EBAY 8.2x OSTK EBAY OSTK EBAY NM OSTK EBAY 15.8x +7.7x +0.3x NM NM (1.5x) eCommerce 12.0x 12.3x 19.2x 17.7x Average (ex-Hero) 9.3x 7.9x (1.3x) 18.3x 14.4x (3.9x) Source: Hero Management, company filings and Factset as of January 27, 2017. Note:Comparable EV calculated after deduction of stock-based compensation expense from Adjusted EBITDA. Comparable EPS is calculated after deduction of stock-based compensation expense and before deduction of after-tax intangible amortization from EPS. OSTK excluded from P/E average. 20 ROST 10.6xROST 11.2x+0.5xROST TJX 10.5xTJX 10.4x(0.0x)TJX Department /WMT 8.9xWMT 7.7x(1.2x) WMT MassJWN 9.3xJWN 5.9x(3.5x) JWN M 7.4x M 5.6x(1.8x) M KSS 6.4x KSS 4.9x(1.5x) KSS DDDS 7.3xDDDS 4.4x(2.9x)DDDS 19.9xROST 19.6xTJX 16.5xWMT 20.0xTGT 19.4xJWN 13.6xM 13.9xKSS 14.7xDDDS 20.9x+0. 19.6x(0.0 15.2x(1.3 12.0x(8.0 13.7x(5.7 9.1x(4.5 10.3x(3.6 9.8x(5.0
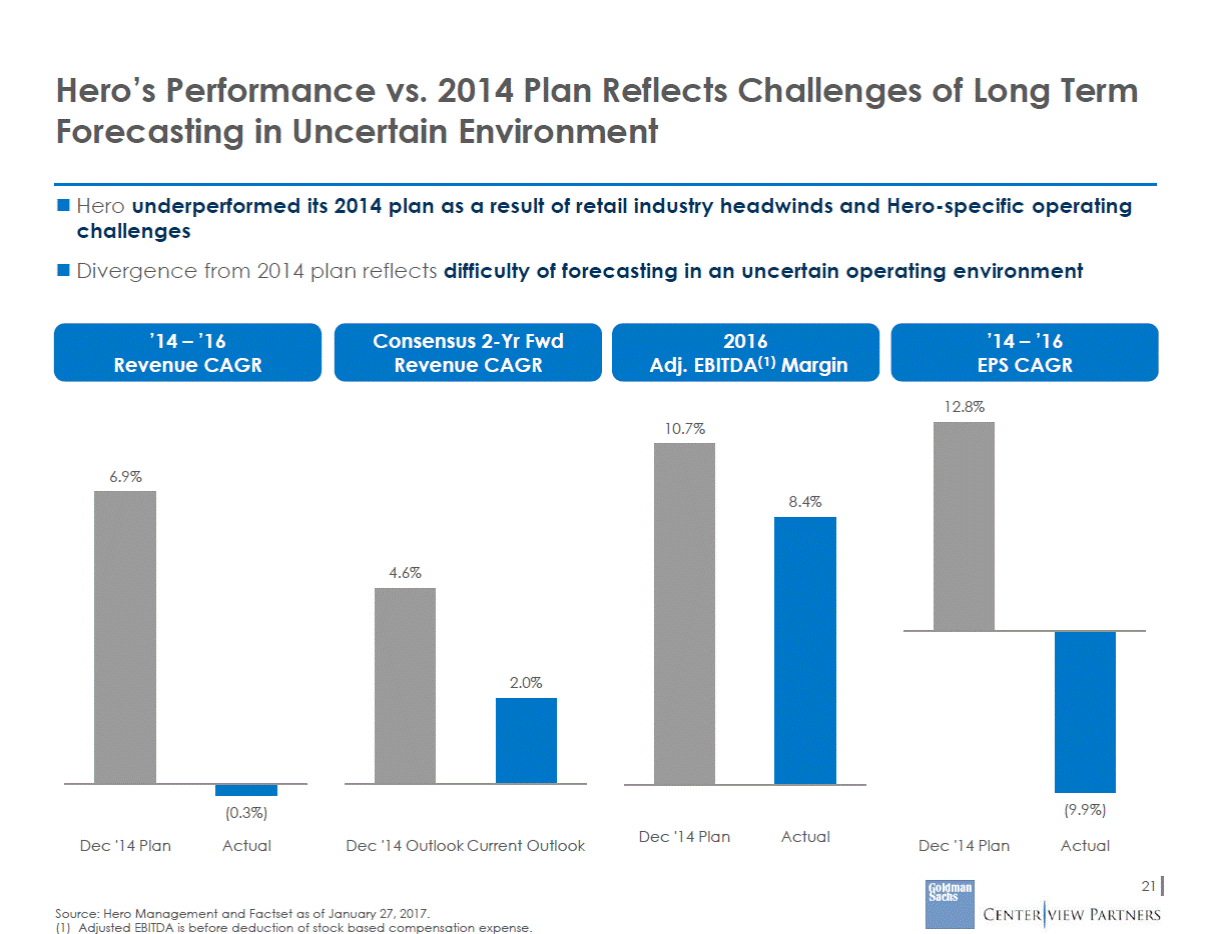
Hero’s Performance vs. 2014 Plan Reflects Challenges of Long Term Forecasting in Uncertain Environment Hero underperformed its 2014 plan as a result of retail industry headwinds and Hero-specific operating challenges Divergence from 2014 plan reflects difficulty of forecasting in an uncertain operating environment ’14 – ’16 Revenue CAGR Consensus 2-Yr Fwd Revenue CAGR 2016 Adj. EBITDA(1) Margin ’14 – ’16 EPS CAGR 12.8% 10.7% 6.9% 4.6% (9.9%) (0.3%) Dec '14 Plan Actual Dec '14 Plan Actual Dec '14 Outlook Current Outlook Dec '14 Plan Actual 21 Source: Hero Management and Factset as of January 27, 2017. (1) Adjusted EBITDA is before deduction of stock based compensation expense. 2.0% 8.4%
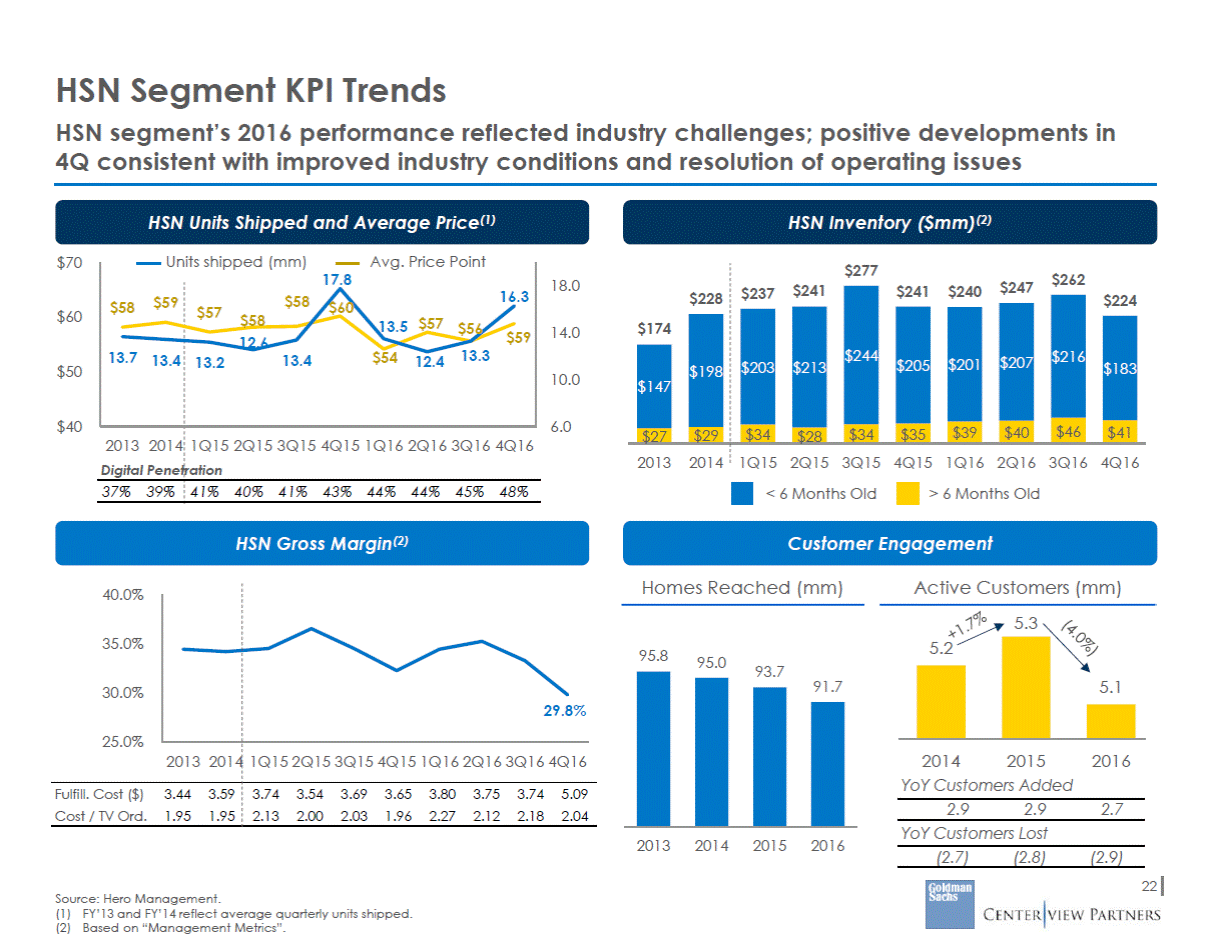
HSN Segment KPI Trends HSN segment’s 2016 performance reflected industry challenges; positive developments in 4Q consistent with improved industry conditions and resolution of operating issues HSN Units Shipped and Average Price(1) HSN Inventory ($mm)(2) $70 Units shipped (mm) Avg. Price Point $277 $262 18.0 $247 $241$240 $224 $60 14.0 13.3 13.7 $54 13.4 13.4 12.4 13.2 $50 10.0 $40 6.0 2013 2014 1Q15 2Q15 3Q15 4Q15 1Q16 2Q16 3Q16 4Q16 2013 2014 1Q15 2Q15 3Q15 4Q15 1Q16 2Q16 3Q16 4Q16 Digital Penetration 37%39%41%40%41%43%44%44% 45% 48% < 6 Months Old > 6 Months Old HSN Gross Margin(2) Customer Engagement Homes Reached (mm) Active Customers (mm) 5.3 40.0% 35.0% 95.8 95.0 93.7 91.7 30.0% 25.0% 2014 2015 2016 2013 2014 1Q15 2Q15 3Q15 4Q15 1Q16 2Q16 3Q16 4Q16 YoY Customers Added Fulfill. Cost ($) Cost / TV Ord. 3.44 1.95 3.593.743.543.693.653.803.753.745.09 2.9 2.9 2.7 1.952.132.002.031.962.272.122.182.04 YoY Customers Lost 2013 2014 2015 2016 (2.7) (2.8) (2.9) 22 Source: Hero Management. (1) FY’13 and FY’14 reflect average quarterly units shipped. (2) Based on “Management Metrics”. 29.8% 5.2 5.1 17.8 16.3 $58$59$57$58$60 $5813.5 $57 $56 12.6$59 $228$237$241 $174 $198$203$213 $147 $27$29$34$28 $244 $205$201$207 $34$35$39$40 $216 $46 $183 $41
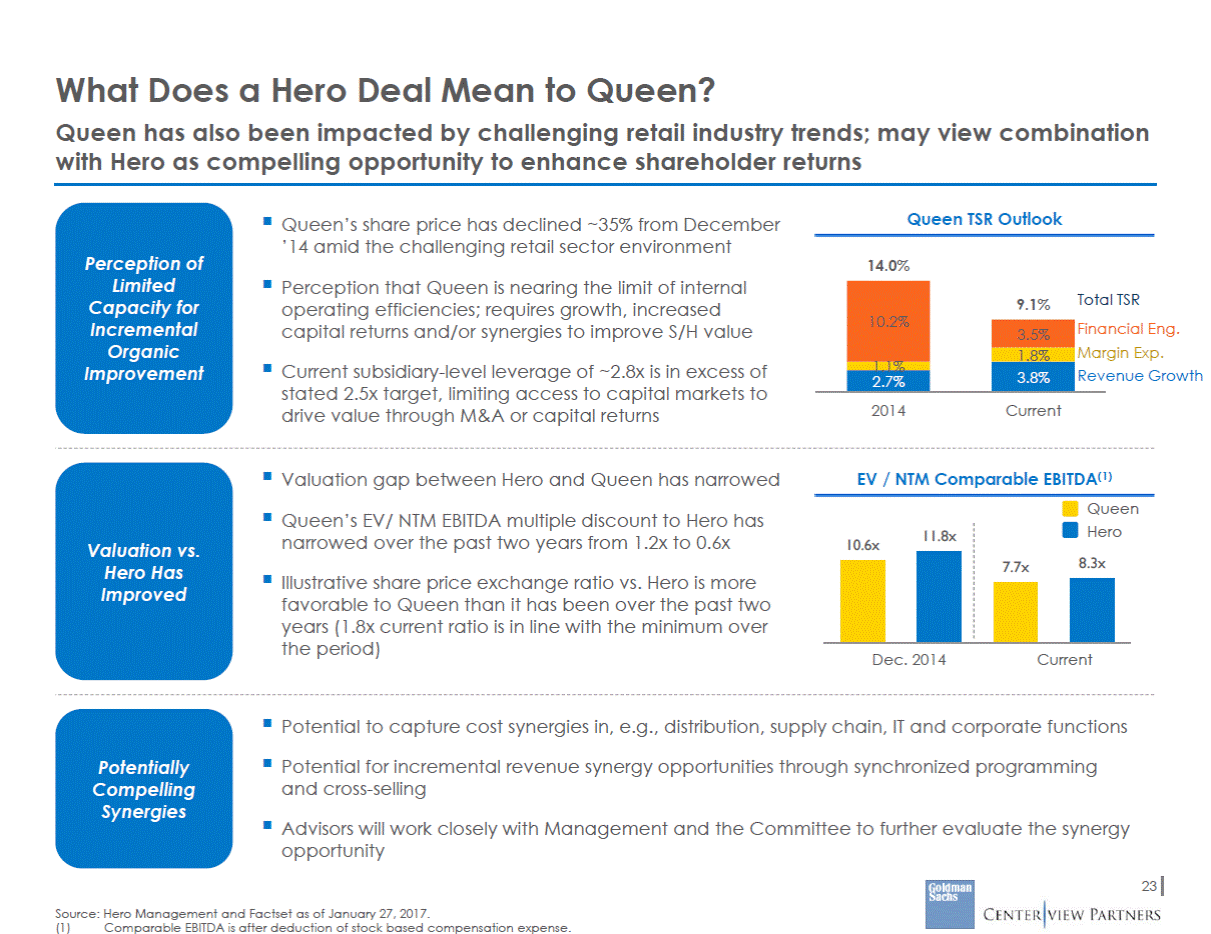
What Does a Hero Deal Mean to Queen? Queen has also been impacted by challenging retail industry trends; may view combination with Hero as compelling opportunity to enhance shareholder returns Queen TSR Outlook Queen’s share price has declined ~35% from December ’14 amid the challenging retail sector environment Perception of Limited Capacity for Incremental Organic Improvement 14.0% Perception that Queen is nearing the limit of internal operating efficiencies; requires growth, increased capital returns and/or synergies to improve S/H value Total TSR 9.1% ncial Eng. gin Exp. enue Growth Current subsidiary-level leverage of ~2.8x is in excess of stated 2.5x target, limiting access to capital markets to drive value through M&A or capital returns 2014 Current Valuation gap between Hero and Queen has narrowed EV / NTM Comparable EBITDA(1) Queen Hero Queen’s EV/ NTM EBITDA multiple discount to Hero has narrowed over the past two years from 1.2x to 0.6x 11.8x 10.6x Valuation vs. Hero Has Improved 7.7x Illustrative share price exchange ratio vs. Hero is more favorable to Queen than it has been over the past two years (1.8x current ratio is in line with the minimum over the period) Dec. 2014 Current Potential to capture cost synergies in, e.g., distribution, supply chain, IT and corporate functions Potential for incremental revenue synergy opportunities through synchronized programming and cross-selling Potentially Compelling Synergies Advisors will work closely with Management and the Committee to further evaluate the synergy opportunity 23 Source: Hero Management and Factset as of January 27, 2017. (1) Comparable EBITDA is after deduction of stock based compensation expense. 8.3x 1.1% 3.5% Fina Mar Rev 1.8% 3.8% 2.7% 10.2%
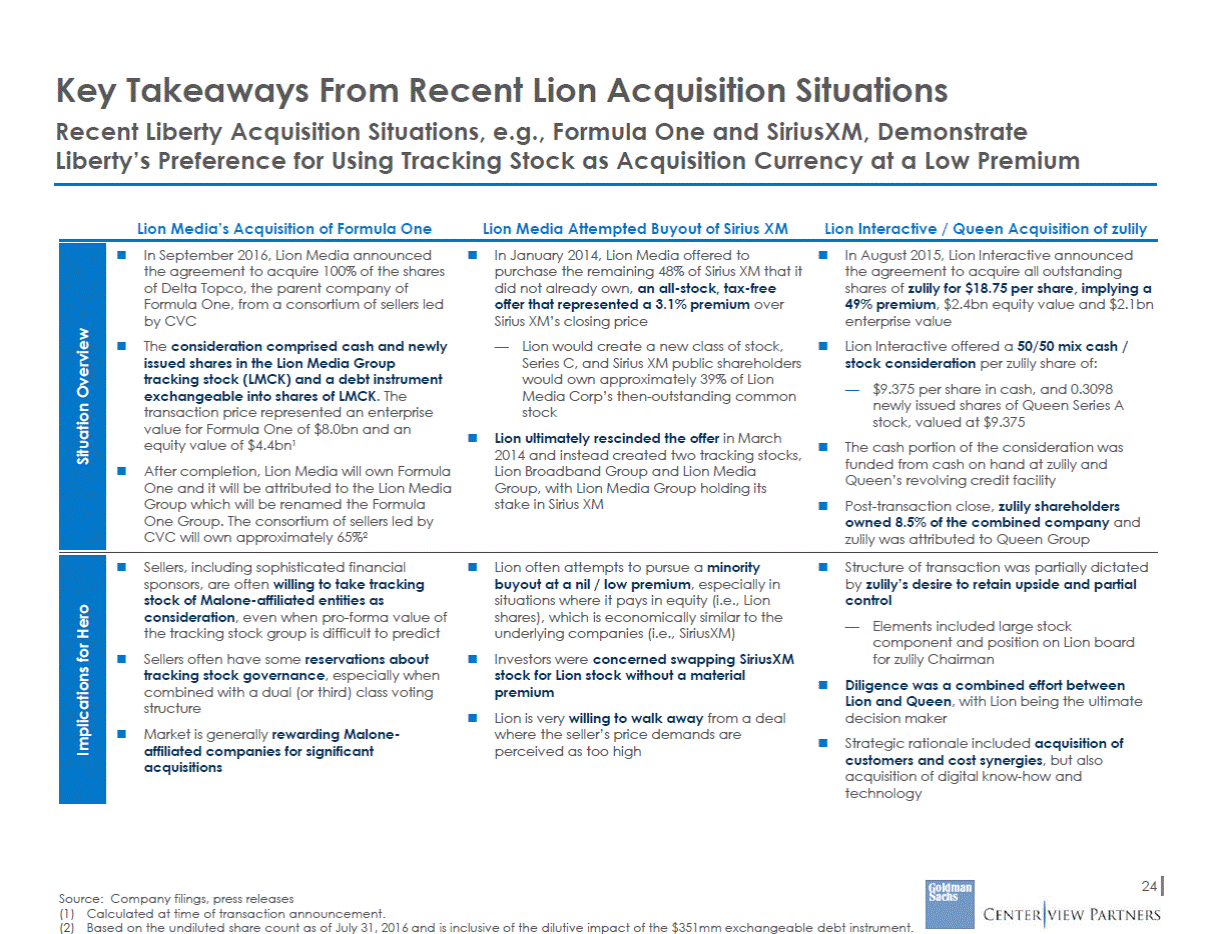
Key Takeaways From Recent Lion Acquisition Situations Recent Liberty Acquisition Situations, e.g., Formula One and SiriusXM, Demonstrate Liberty’s Preference for Using Tracking Stock as Acquisition Currency at a Low Premium Lion Media’s Acquisition of Formula One Lion Media Attempted Buyout of Sirius XM Lion Interactive / Queen Acquisition of zulily In September 2016, Lion Media announced the agreement to acquire 100% of the shares of Delta Topco, the parent company of Formula One, from a consortium of sellers led by CVC The consideration comprised cash and newly issued shares in the Lion Media Group tracking stock (LMCK) and a debt instrument exchangeable into shares of LMCK. The transaction price represented an enterprise value for Formula One of $8.0bn and an equity value of $4.4bn1 After completion, Lion Media will own Formula One and it will be attributed to the Lion Media Group which will be renamed the Formula One Group. The consortium of sellers led by CVC will own approximately 65%2 In January 2014, Lion Media offered to purchase the remaining 48% of Sirius XM that it did not already own, an all-stock, tax-free offer that represented a 3.1% premium over Sirius XM’s closing price In August 2015, Lion Interactive announced the agreement to acquire all outstanding shares of zulily for $18.75 per share, implying a 49% premium, $2.4bn equity value and $2.1bn enterprise value Lion Interactive offered a 50/50 mix cash / stock consideration per zulily share of: — Lion would create a new class of stock, Series C, and Sirius XM public shareholders would own approximately 39% of Lion Media Corp’s then-outstanding common stock — $9.375 per share in cash, and 0.3098 newly issued shares of Queen Series A stock, valued at $9.375 Lion ultimately rescinded the offer in March 2014 and instead created two tracking stocks, Lion Broadband Group and Lion Media Group, with Lion Media Group holding its stake in Sirius XM The cash portion of the consideration was funded from cash on hand at zulily and Queen’s revolving credit facility Post-transaction close, zulily shareholders owned 8.5% of the combined company and zulily was attributed to Queen Group Sellers, including sophisticated financial sponsors, are often willing to take tracking stock of Malone-affiliated entities as consideration, even when pro-forma value of the tracking stock group is difficult to predict Sellers often have some reservations about tracking stock governance, especially when combined with a dual (or third) class voting structure Market is generally rewarding Malone-affiliated companies for significant acquisitions Lion often attempts to pursue a minority buyout at a nil / low premium, especially in situations where it pays in equity (i.e., Lion shares), which is economically similar to the underlying companies (i.e., SiriusXM) Investors were concerned swapping SiriusXM stock for Lion stock without a material premium Lion is very willing to walk away from a deal where the seller’s price demands are perceived as too high Structure of transaction was partially dictated by zulily’s desire to retain upside and partial control — Elements included large stock component and position on Lion board for zulily Chairman Diligence was a combined effort between Lion and Queen, with Lion being the ultimate decision maker Strategic rationale included acquisition of customers and cost synergies, but also acquisition of digital know-how and technology 24 Source: Company filings, press releases (1) Calculated at time of transaction announcement. (2) Based on the undiluted share count as of July 31, 2016 and is inclusive of the dilutive impact of the $351mm exchangeable debt instrument. Implications for Hero Situation Overview
Key Takeaways and Next Steps The Projections developed by Management reflect a return to growth and margin expansion due to a number of in-process top-line and cost improvement initiatives Advisors continue to work on addressing a number of key questions for the Committee around standalone alternatives and the potential implications of a combination with Queen Advisors will come back to the Board in the coming weeks with more detailed analysis of Hero’s alternatives, including a combination with Queen —Like Hero, Queen has been impacted by challenging retail industry trends and may view a combination with Hero as a compelling opportunity to enhance shareholder returns Following the completion of our analysis and the Committee’s full review of Hero’s alternatives, the advisors will work with the Committee to decide how best to engage further with Queen 25
Appendix

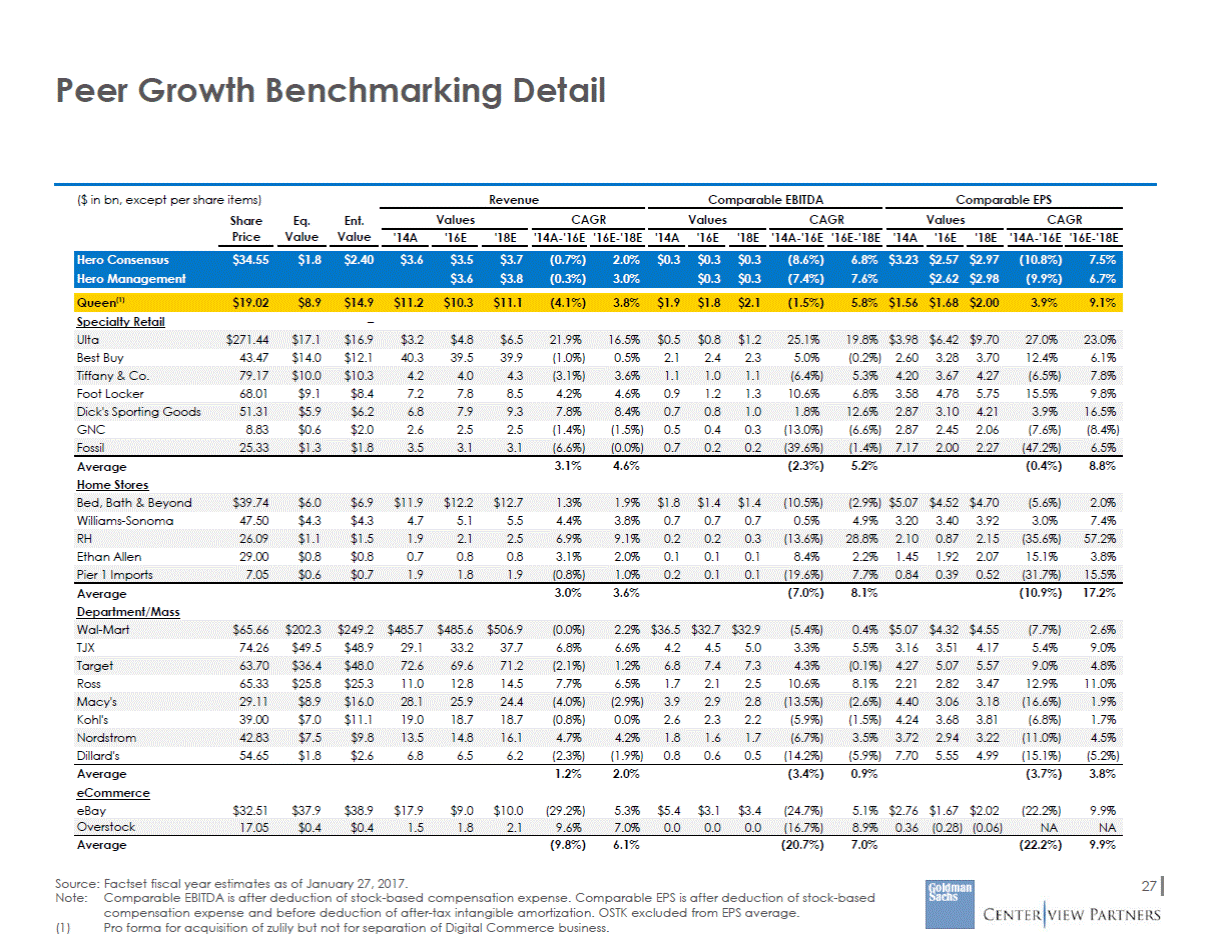
Peer Growth Benchmarking Detail ($ in bn, except per share items) Share Price Eq. Value Ent. Value '14A '16E '18E '14A-'16E '16E-'18E '14A '16E '18E '14A-'16E '16E-'18E '14A '16E '18E '14A-'16E '16E-'18E Specialty Retail – Best Buy 43.47 $14.0 $12.1 40.3 39.5 39.9 (1.0%) 0.5% 2.1 2.4 2.3 5.0% (0.2%) 2.60 3.28 3.70 12.4% 6.1% Foot Locker 68.01 $9.1 $8.4 7.2 7.8 8.5 4.2% 4.6% 0.9 1.2 1.3 10.6% 6.8% 3.58 4.78 5.75 15.5% 9.8% GNC 8.83 $0.6 $2.0 2.6 2.5 2.5 (1.4%) (1.5%) 0.5 0.4 0.3 (13.0%) (6.6%) 2.87 2.45 2.06 (7.6%) (8.4%) 3.1% 4.6% (2.3%) 5.2% (0.4%) 8.8% Average Home Stores Williams-Sonoma 47.50 $4.3 $4.3 4.7 5.1 5.5 4.4% 3.8% 0.7 0.7 0.7 0.5% 4.9% 3.20 3.40 3.92 3.0% 7.4% Ethan Allen 29.00 $0.8 $0.8 0.7 0.8 0.8 3.1% 2.0% 0.1 0.1 0.1 8.4% 2.2% 1.45 1.92 2.07 15.1% 3.8% 3.0% 3.6% (7.0%) 8.1% (10.9%) 17.2% Average Department/Mass TJX 74.26 $49.5 $48.9 29.1 33.2 37.7 6.8% 6.6% 4.2 4.5 5.0 3.3% 5.5% 3.16 3.51 4.17 5.4% 9.0% Ross 65.33 $25.8 $25.3 11.0 12.8 14.5 7.7% 6.5% 1.7 2.1 2.5 10.6% 8.1% 2.21 2.82 3.47 12.9% 11.0% Kohl's 39.00 $7.0 $11.1 19.0 18.7 18.7 (0.8%) 0.0% 2.6 2.3 2.2 (5.9%) (1.5%) 4.24 3.68 3.81 (6.8%) 1.7% Dillard's 54.65 $1.8 $2.6 6.8 6.5 6.2 (2.3%) (1.9%) 0.8 0.6 0.5 (14.2%) (5.9%) 7.70 5.55 4.99 (15.1%) (5.2%) Average eCommerce eBay 1.2% 2.0% (3.4%) 0.9% (3.7%) 3.8% $32.51 $37.9 $38.9 $17.9 $9.0 $10.0 (29.2%) 5.3% $5.4 $3.1 $3.4 (24.7%) 5.1% $2.76 $1.67 $2.02 (22.2%) 9.9% Average (9.8%) 6.1% (20.7%) 7.0% (22.2%) 9.9% Source: Factset fiscal year estimates as of January 27, 2017. Note:Comparable EBITDA is after deduction of stock-based compensation expense. Comparable EPS is after deduction of stock-based compensation expense and before deduction of after-tax intangible amortization. OSTK excluded from EPS average. 27 (1) Pro forma for acquisition of zulily but not for separation of Digital Commerce business. Overstock 17.05 $0.4 $0.4 1.5 1.8 2.1 9.6% 7.0% 0.0 0.0 0.0 (16.7%) 8.9% 0.36 (0.28) (0.06) NA NA Nordstrom 42.83 $7.5 $9.8 13.5 14.8 16.1 4.7% 4.2% 1.8 1.6 1.7 (6.7%) 3.5% 3.72 2.94 3.22 (11.0%) 4.5% Macy's 29.11 $8.9 $16.0 28.1 25.9 24.4 (4.0%) (2.9%) 3.9 2.9 2.8 (13.5%) (2.6%) 4.40 3.06 3.18 (16.6%) 1.9% Target 63.70 $36.4 $48.0 72.6 69.6 71.2 (2.1%) 1.2% 6.8 7.4 7.3 4.3% (0.1%) 4.27 5.07 5.57 9.0% 4.8% Wal-Mart $65.66 $202.3 $249.2 $485.7 $485.6 $506.9 (0.0%) 2.2% $36.5 $32.7 $32.9 (5.4%) 0.4% $5.07 $4.32 $4.55 (7.7%) 2.6% Pier 1 Imports 7.05 $0.6 $0.7 1.9 1.8 1.9 (0.8%) 1.0% 0.2 0.1 0.1 (19.6%) 7.7% 0.84 0.39 0.52 (31.7%) 15.5% RH 26.09 $1.1 $1.5 1.9 2.1 2.5 6.9% 9.1% 0.2 0.2 0.3 (13.6%) 28.8% 2.10 0.87 2.15 (35.6%) 57.2% Bed, Bath & Beyond $39.74 $6.0 $6.9 $11.9 $12.2 $12.7 1.3% 1.9% $1.8 $1.4 $1.4 (10.5%) (2.9%) $5.07 $4.52 $4.70 (5.6%) 2.0% Fossil 25.33 $1.3 $1.8 3.5 3.1 3.1 (6.6%) (0.0%) 0.7 0.2 0.2 (39.6%) (1.4%) 7.17 2.00 2.27 (47.2%) 6.5% Dick's Sporting Goods 51.31 $5.9 $6.2 6.8 7.9 9.3 7.8% 8.4% 0.7 0.8 1.0 1.8% 12.6% 2.87 3.10 4.21 3.9% 16.5% Tiffany & Co. 79.17 $10.0 $10.3 4.2 4.0 4.3 (3.1%) 3.6% 1.1 1.0 1.1 (6.4%) 5.3% 4.20 3.67 4.27 (6.5%) 7.8% Ulta $271.44 $17.1 $16.9 $3.2 $4.8 $6.5 21.9% 16.5% $0.5 $0.8 $1.2 25.1% 19.8% $3.98 $6.42 $9.70 27.0% 23.0% Queen(1) $19.02 $8.9 $14.9 $11.2 $10.3 $11.1 (4.1%) 3.8% $1.9 $1.8 $2.1 (1.5%) 5.8% $1.56 $1.68 $2.00 3.9% 9.1% Hero Consensus $34.55 $1.8 $2.40 $3.6 $3.5 $3.7 (0.7%) 2.0% $0.3 $0.3 $0.3 (8.6%) 6.8% $3.23 $2.57 $2.97 (10.8%) 7.5% Hero Management $3.6 $3.8 (0.3%) 3.0% $0.3 $0.3 (7.4%) 7.6% $2.62 $2.98 (9.9%) 6.7% Revenue Comparable EBITDA Comparable EPS Values CAGR Values CAGR Values CAGR
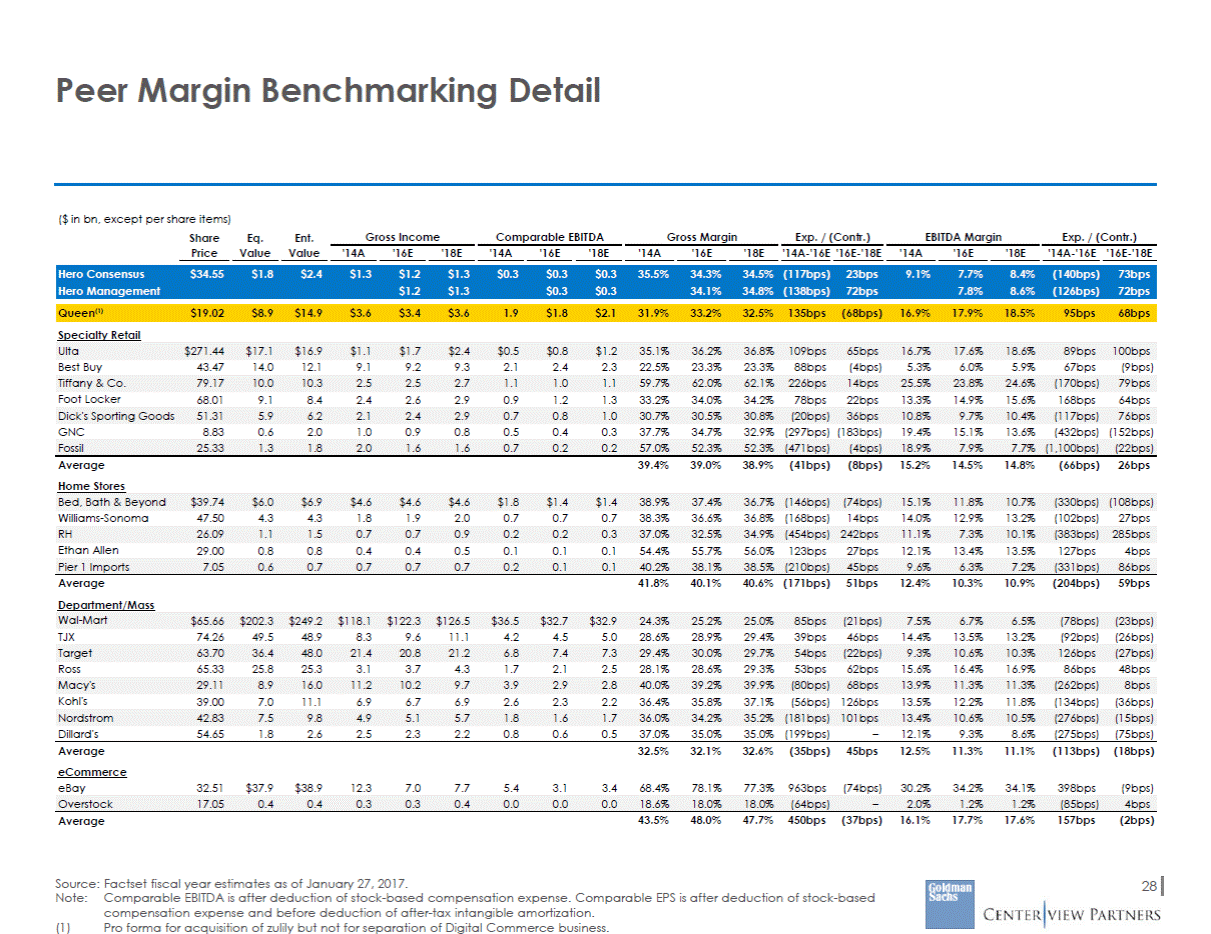
Peer Margin Benchmarking Detail ($ in bn, except per share items) Share Price Eq. Value Ent. Value '14A '16E '18E '14A '16E '18E '14A '16E '18E '14A-'16E '16E-'18E '14A '16E '18E '14A-'16E '16E-'18E Specialty Retail Best Buy 43.47 14.0 12.1 9.1 9.2 9.3 2.1 2.4 2.3 22.5% 23.3% 23.3% 88bps (4bps) 5.3% 6.0% 5.9% 67bps (9bps) Foot Locker 68.01 9.1 8.4 2.4 2.6 2.9 0.9 1.2 1.3 33.2% 34.0% 34.2% 78bps 22bps 13.3% 14.9% 15.6% 168bps 64bps GNC 8.83 0.6 2.0 1.0 0.9 0.8 0.5 0.4 0.3 37.7% 34.7% 32.9% (297bps) (183bps) 19.4% 15.1% 13.6% (432bps) (152bps) Average Home Stores 39.4% 39.0% 38.9% (41bps) (8bps) 15.2% 14.5% 14.8% (66bps) 26bps Williams-Sonoma 47.50 4.3 4.3 1.8 1.9 2.0 0.7 0.7 0.7 38.3% 36.6% 36.8% (168bps) 14bps 14.0% 12.9% 13.2% (102bps) 27bps Ethan Allen 29.00 0.8 0.8 0.4 0.4 0.5 0.1 0.1 0.1 54.4% 55.7% 56.0% 123bps 27bps 12.1% 13.4% 13.5% 127bps 4bps Average Department/Mass 41.8% 40.1% 40.6% (171bps) 51bps 12.4% 10.3% 10.9% (204bps) 59bps TJX 74.26 49.5 48.9 8.3 9.6 11.1 4.2 4.5 5.0 28.6% 28.9% 29.4% 39bps 46bps 14.4% 13.5% 13.2% (92bps) (26bps) Ross 65.33 25.8 25.3 3.1 3.7 4.3 1.7 2.1 2.5 28.1% 28.6% 29.3% 53bps 62bps 15.6% 16.4% 16.9% 86bps 48bps Kohl's 39.00 7.0 11.1 6.9 6.7 6.9 2.6 2.3 2.2 36.4% 35.8% 37.1% (56bps) 126bps 13.5% 12.2% 11.8% (134bps) (36bps) Dillard's 54.65 1.8 2.6 2.5 2.3 2.2 0.8 0.6 0.5 37.0% 35.0% 35.0% (199bps) – 12.1% 9.3% 8.6% (275bps) (75bps) Average eCommerce eBay 32.5% 32.1% 32.6% (35bps) 45bps 12.5% 11.3% 11.1% (113bps) (18bps) 32.51 $37.9 $38.9 12.3 7.0 7.7 5.4 3.1 3.4 68.4% 78.1% 77.3% 963bps (74bps) 30.2% 34.2% 34.1% 398bps (9bps) Average 43.5% 48.0% 47.7% 450bps (37bps) 16.1% 17.7% 17.6% 157bps (2bps) Source: Factset fiscal year estimates as of January 27, 2017. Note:Comparable EBITDA is after deduction of stock-based compensation expense. Comparable EPS is after deduction of stock-based compensation expense and before deduction of after-tax intangible amortization. 28 (1) Pro forma for acquisition of zulily but not for separation of Digital Commerce business. Overstock 17.05 0.4 0.4 0.3 0.3 0.4 0.0 0.0 0.0 18.6% 18.0% 18.0% (64bps) – 2.0% 1.2% 1.2% (85bps) 4bps Nordstrom 42.83 7.5 9.8 4.9 5.1 5.7 1.8 1.6 1.7 36.0% 34.2% 35.2% (181bps) 101bps 13.4% 10.6% 10.5% (276bps) (15bps) Macy's 29.11 8.9 16.0 11.2 10.2 9.7 3.9 2.9 2.8 40.0% 39.2% 39.9% (80bps) 68bps 13.9% 11.3% 11.3% (262bps) 8bps Target 63.70 36.4 48.0 21.4 20.8 21.2 6.8 7.4 7.3 29.4% 30.0% 29.7% 54bps (22bps) 9.3% 10.6% 10.3% 126bps (27bps) Wal-Mart $65.66 $202.3 $249.2 $118.1 $122.3 $126.5 $36.5 $32.7 $32.9 24.3% 25.2% 25.0% 85bps (21bps) 7.5% 6.7% 6.5% (78bps) (23bps) Pier 1 Imports 7.05 0.6 0.7 0.7 0.7 0.7 0.2 0.1 0.1 40.2% 38.1% 38.5% (210bps) 45bps 9.6% 6.3% 7.2% (331bps) 86bps RH 26.09 1.1 1.5 0.7 0.7 0.9 0.2 0.2 0.3 37.0% 32.5% 34.9% (454bps) 242bps 11.1% 7.3% 10.1% (383bps) 285bps Bed, Bath & Beyond $39.74 $6.0 $6.9 $4.6 $4.6 $4.6 $1.8 $1.4 $1.4 38.9% 37.4% 36.7% (146bps) (74bps) 15.1% 11.8% 10.7% (330bps) (108bps) Fossil 25.33 1.3 1.8 2.0 1.6 1.6 0.7 0.2 0.2 57.0% 52.3% 52.3% (471bps) (4bps) 18.9% 7.9% 7.7% (1,100bps) (22bps) Dick's Sporting Goods 51.31 5.9 6.2 2.1 2.4 2.9 0.7 0.8 1.0 30.7% 30.5% 30.8% (20bps) 36bps 10.8% 9.7% 10.4% (117bps) 76bps Tiffany & Co. 79.17 10.0 10.3 2.5 2.5 2.7 1.1 1.0 1.1 59.7% 62.0% 62.1% 226bps 14bps 25.5% 23.8% 24.6% (170bps) 79bps Ulta $271.44 $17.1 $16.9 $1.1 $1.7 $2.4 $0.5 $0.8 $1.2 35.1% 36.2% 36.8% 109bps 65bps 16.7% 17.6% 18.6% 89bps 100bps Queen(1) $19.02 $8.9 $14.9 $3.6 $3.4 $3.6 1.9 $1.8 $2.1 31.9% 33.2% 32.5% 135bps (68bps) 16.9% 17.9% 18.5% 95bps 68bps Hero Consensus $34.55 $1.8 $2.4 $1.3 $1.2 $1.3 $0.3 $0.3 $0.3 35.5% 34.3% 34.5% (117bps) 23bps 9.1% 7.7% 8.4% (140bps) 73bps Hero Management $1.2 $1.3 $0.3 $0.3 34.1% 34.8% (138bps) 72bps 7.8% 8.6% (126bps) 72bps Gross Income Comparable EBITDA Gross Margin Exp. / (Contr.) EBITDA Margin Exp. / (Contr.)
