Disclaimer (Centerview Partners) This presentation has been prepared by Centerview Partners LLC (“Centerview”) for use solely by the Special Committee of the Board of Directors of HSN, Inc. (“Hero” or the “Company”) in connection with its evaluation of a proposed transaction involving the Company and for no other purpose. The information contained herein is based upon information supplied by Hero and publicly available information, and portions of the information contained herein may be based upon statements, estimates and forecasts provided by the Company. Centerview has relied upon the accuracy and completeness of the foregoing information, and have not assumed any responsibility for any independent verification of such information or for any independent evaluation or appraisal of any of the assets or liabilities (contingent or otherwise) of the Company or any other entity, or concerning the solvency or fair value of the Company or any other entity. With respect to financial forecasts, including with respect to estimates of potential synergies, Centerview has assumed that such forecasts have been reasonably prepared on bases reflecting the best currently available estimates and judgments of the management of the Company as to its financial performances, and at your direction Centerview has relied upon such forecasts, as provided by the Company’s management, with respect to the Company, including as to expected synergies. Centerview assumes no responsibility for and expresses no view as to such forecasts or the assumptions on which they are based. The information set forth herein is based upon economic, monetary, market and other conditions as in effect on, and the information made available to us as of, the date hereof, unless indicated otherwise and Centerview assumes no obligation to update or otherwise revise these materials. The financial analysis in this presentation is complex and is not necessarily susceptible to a partial analysis or summary description. In performing this financial analysis, Centerview has considered the results of its analysis as a whole and did not necessarily attribute a particular weight to any particular portion of the analysis considered. Furthermore, selecting any portion of Centerview’s analysis, without considering the analysis as a whole, would create an incomplete view of the process underlying its financial analysis. Centerview may have deemed various assumptions more or less probable than other assumptions, so the reference ranges resulting from any particular portion of the analysis described above should not be taken to be Centerview’s view of the actual value of the Company. These materials and the information contained herein are confidential, were not prepared with a view toward public disclosure, and may not be disclosed publicly or made available to third parties without the prior written consent of Centerview. These materials and any other advice, written or oral, rendered by Centerview are intended solely for the benefit and use of the Special Committee of the Board of Directors of the Company (in its capacity as such) in its consideration of the proposed transaction, and are not for the benefit of, and do not convey any rights or remedies for any holder of securities of the Company or any other person. Centerview will not be responsible for and has not provided any tax, accounting, actuarial, legal or other specialist advice. These materials are not intended to provide the sole basis for evaluating the proposed transaction, and this presentation does not represent a fairness opinion, recommendation, valuation or opinion of any kind, and is necessarily incomplete and should be viewed solely in conjunction with the oral presentation provided by Centerview. 1
Disclaimer (Goldman Sachs) These materials have been prepared and are provided by Goldman Sachs on a confidential basis solely for the information and assistance of the Special Committee of the Board of Directors (the "Special Committee") of Hero (the "Company") in connection with its consideration of the matters referred to herein. These materials and Goldman Sachs’ presentation relating to these materials (the “Confidential Information”) may not be disclosed to any third party or circulated or referred to publicly or used for or relied upon for any other purpose without the prior written consent of Goldman Sachs. The Confidential Information was not prepared with a view to public disclosure or to conform to any disclosure standards under any state, federal or international securities laws or other laws, rules or regulations, and Goldman Sachs does not take any responsibility for the use of the Confidential Information by persons other than those set forth above. Notwithstanding anything in this Confidential Information to the contrary, the Company may disclose to any person the US federal income and state income tax treatment and tax structure of any transaction described herein and all materials of any kind (including tax opinions and other tax analyses) that are provided to the Company relating to such tax treatment and tax structure, without Goldman Sachs imposing any limitation of any kind. The Confidential Information has been prepared by the Investment Banking Division of Goldman Sachs and is not a product of its research department. Goldman Sachs and its affiliates are engaged in advisory, underwriting and financing, principal investing, sales and trading, research, investment management and other financial and non-financial activities and services for various persons and entities. Goldman Sachs and its affiliates and employees, and funds or other entities they manage or in which they invest or have other economic interests or with which they co-invest, may at any time purchase, sell, hold or vote long or short positions and investments in securities, derivatives, loans, commodities, currencies, credit default swaps and other financial instruments of the Company, any other party to any transaction and any of their respective affiliates or any currency or commodity that may be involved in any transaction. Goldman Sachs’ investment banking division maintains regular, ordinary course client service dialogues with clients and potential clients to review events, opportunities, and conditions in particular sectors and industries and, in that connection, Goldman Sachs may make reference to the Company, but Goldman Sachs will not disclose any confidential information received from the Company. The Confidential Information has been prepared based on historical financial information, forecasts and other information obtained by Goldman Sachs from publicly available sources, the management of the Company or other sources (approved for our use by the Company in the case of information from management and non-public information). In preparing the Confidential Information, Goldman Sachs has relied upon and assumed, without assuming any responsibility for independent verification, the accuracy and completeness of all of the financial, legal, regulatory, tax, accounting and other information provided to, discussed with or reviewed by us, and Goldman Sachs does not assume any liability for any such information. Goldman Sachs does not provide accounting, tax, legal or regulatory advice. Goldman Sachs has not made an independent evaluation or appraisal of the assets and liabilities (including any contingent, derivative or other off-balance sheet assets and liabilities) of the Company or any other party to any transaction or any of their respective affiliates and has no obligation to evaluate the solvency of the Company or any other party to any transaction under any state or federal laws relating to bankruptcy, insolvency or similar matters. The analyses contained in the Confidential Information do not purport to be appraisals nor do they necessarily reflect the prices at which businesses or securities actually may be sold or purchased. Goldman Sachs’ role in any due diligence review is limited solely to performing such a review as it shall deem necessary to support its own advice and analysis and shall not be on behalf of the Company. Analyses based upon forecasts of future results are not necessarily indicative of actual future results, which may be significantly more or less favorable than suggested by these analyses, and Goldman Sachs does not assume responsibility if future results are materially different from those forecast. The Confidential Information does not address the underlying business decision of the Company to engage in any transaction, or the relative merits of any transaction or strategic alternative referred to herein as compared to any other transaction or alternative that may be available to the Company. The Confidential Information is necessarily based on economic, monetary, market and other conditions as in effect on, and the information made available to Goldman Sachs as of, the date of such Confidential Information and Goldman Sachs assumes no responsibility for updating or revising the Confidential Information based on circumstances, developments or events occurring after such date. The Confidential Information does not constitute any opinion, nor does the Confidential Information constitute a recommendation to the Special Committee, any security holder of the Company or any other person as to how to vote or act with respect to any transaction or any other matter. The Confidential Information, including this disclaimer, is subject to, and governed by, any written agreement between the Company, the Board and/or any committee thereof, on the one hand, and Goldman Sachs, on the other hand. 2
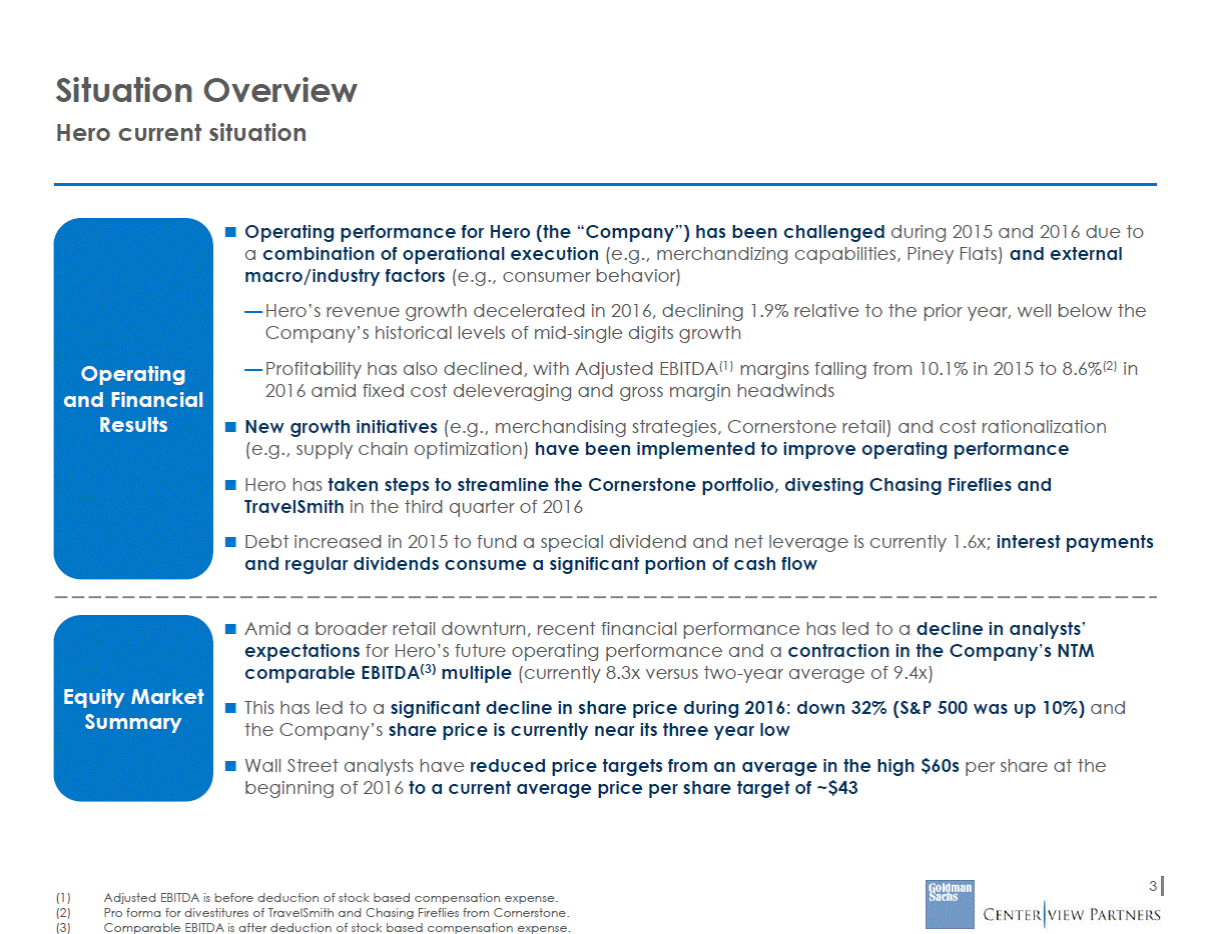
Situation Overview Hero current situation Operating performance for Hero (the “Company”) has been challenged during 2015 and 2016 due to a combination of operational execution (e.g., merchandizing capabilities, Piney Flats) and external macro/industry factors (e.g., consumer behavior) — Hero’s revenue growth decelerated in 2016, declining 1.9% relative to the prior year, well below the Company’s historical levels of mid-single digits growth — Profitability has also declined, with Adjusted EBITDA(1) margins falling from 10.1% in 2015 to 8.6%(2) in 2016 amid fixed cost deleveraging and gross margin headwinds New growth initiatives (e.g., merchandising strategies, Cornerstone retail) and cost rationalization (e.g., supply chain optimization) have been implemented to improve operating performance Hero has taken steps to streamline the Cornerstone portfolio, divesting Chasing Fireflies and TravelSmith in the third quarter of 2016 Debt increased in 2015 to fund a special dividend and net leverage is currently 1.6x; interest payments and regular dividends consume a significant portion of cash flow Operating and Financial Results Amid a broader retail downturn, recent financial performance has led to a decline in analysts’ expectations for Hero’s future operating performance and a contraction in the Company’s NTM comparable EBITDA(3) multiple (currently 8.3x versus two-year average of 9.4x) This has led to a significant decline in share price during 2016: down 32% (S&P 500 was up 10%) and the Company’s share price is currently near its three year low Wall Street analysts have reduced price targets from an average in the high $60s per share at the beginning of 2016 to a current average price per share target of ~$43 Equity Market Summary 3 (1) (2) (3) Adjusted EBITDA is before deduction of stock based compensation expense. Pro forma for divestitures of TravelSmith and Chasing Fireflies from Cornerstone. Comparable EBITDA is after deduction of stock based compensation expense.
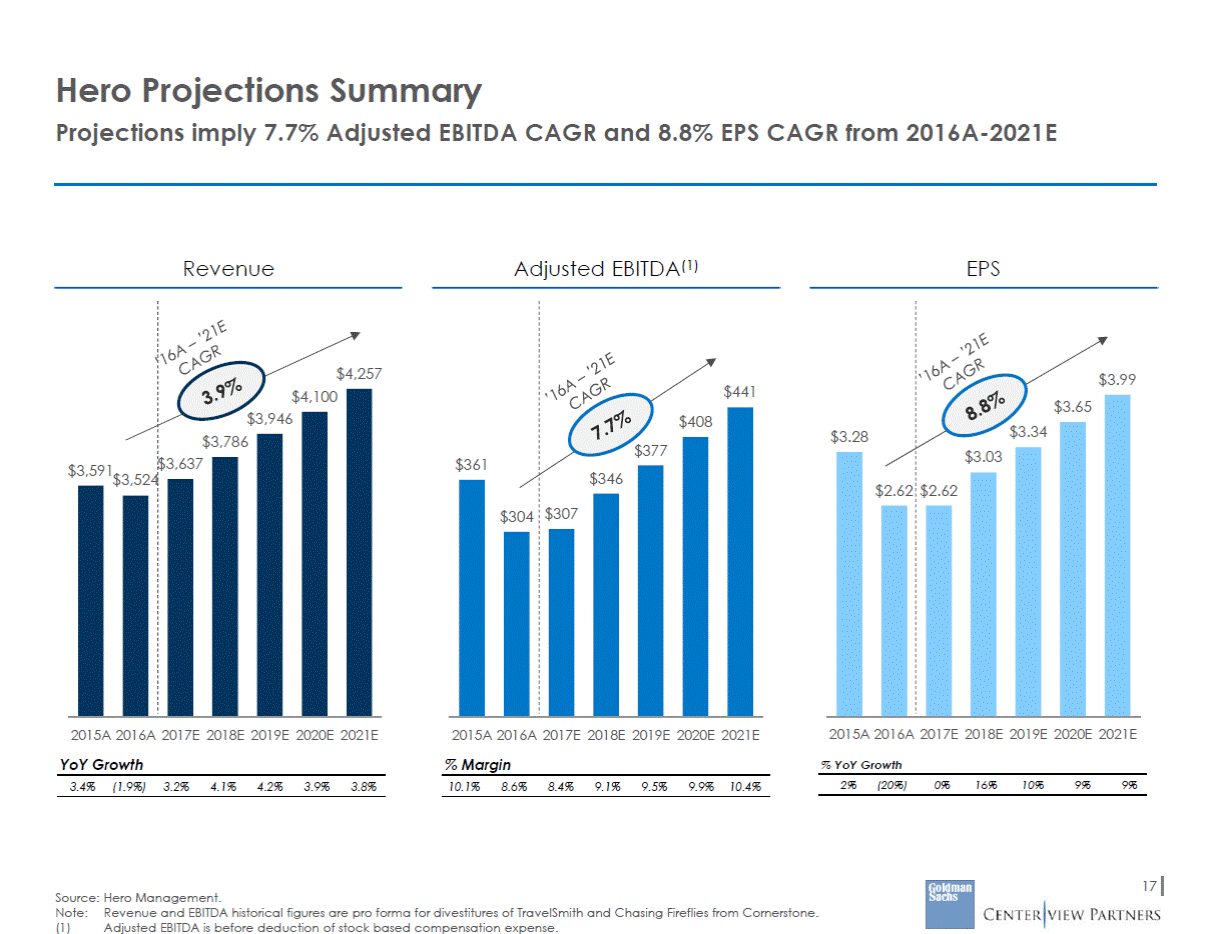
Situation Overview Context for discussion of potential combination with Queen Hero management has presented to the Board its long-term operating forecast (“Projections”): — Projections assume a return of organic revenue growth (+3.2%) in 2017 and an overall CAGR over the projection period of +3.9%(1) — Adjusted EBITDA margins decline slightly (20bps) in 2017 and then are forecast to expand ~200bps to 10.4% from 2017-2021 — The Projections contemplate a ’16-’21 EPS CAGR of ~9%, with cash available to continue funding the dividend and buybacks to maintain a constant share count over time Projections are in excess of Wall Street consensus, which forecasts ~0.5% revenue growth in 2017 and 3.6% revenue growth in 2018 Hero Financial Projections In late 2016, Queen’s CEO conveyed verbally to Hero’s Chairman that Queen would be interested in exploring a transaction to acquire Hero with stock at a “modest premium” Hero’s Board formed a Special Committee to evaluate its long-term business plan and consider various alternatives, and verbally informed Queen of the process Queen has not submitted a formal indication of interest Queen Situation A number of key assumptions will need to be considered as the Board reviews the range of strategic alternatives potentially available to the Company: — Business Plan Execution: Ability for Hero to reaccelerate growth from its current decline to the growth rates assumed in the Projections, which are more consistent with historical performance — Balance Sheet Recapitalization: Comfort level with increasing the Company’s target leverage level in order to execute enhanced capital return alternatives — Acquisition Alternatives: Ability to execute and finance potentially attractive acquisitions given the Company’s current operating performance and balance sheet Strategic Alternatives Introduction 4 (1) Pro forma for divestitures of TravelSmith and Chasing Fireflies from Cornerstone.
Agenda for Today’s Discussion Retail Industry Dynamics Public Market Perspectives on Hero Review of Hero’s Standalone Plan Preliminary Financial Analysis of Hero Queen Situation Update Evaluation of Combination with Queen Preliminary Evaluation of Potential Strategic Alternatives Process Considerations and Potential Next Steps 5
I. Retail Industry Dynamics
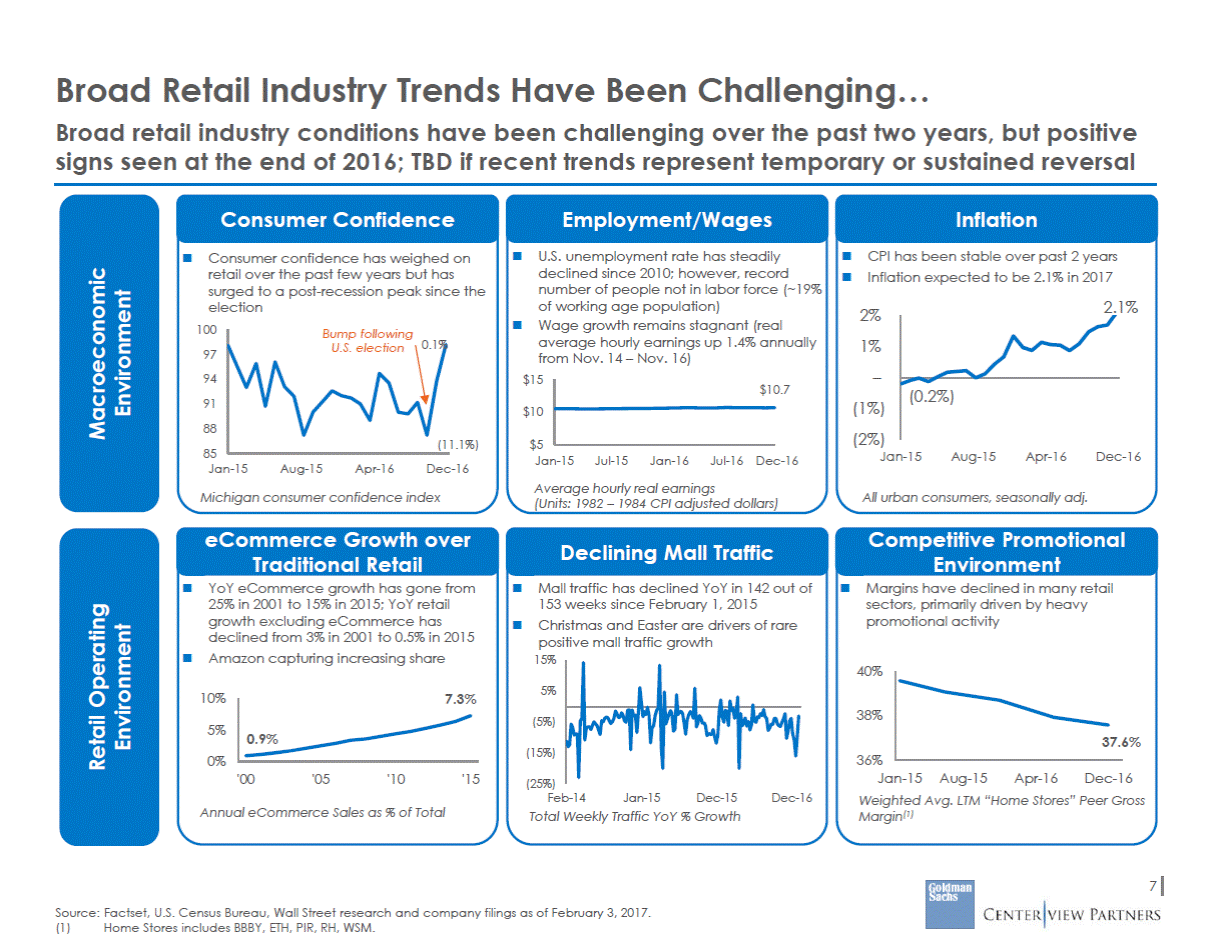
Broad Retail Industry Trends Have Been Challenging… Broad retail industry conditions have been challenging over the past two years, but positive signs seen at the end of 2016; TBD if recent trends represent temporary or sustained reversal Consumer Confidence Consumer confidence has weighed on retail over the past few years but has surged to a post-recession peak since the election Employment/Wages U.S. unemployment rate has steadily declined since 2010; however, record number of people not in labor force (~19% of working age population) Wage growth remains stagnant (real average hourly earnings up 1.4% annually from Nov. 14 – Nov. 16) Inflation CPI has been stable over past 2 years Inflation expected to be 2.1% in 2017 2.1% 2% 1% – (1%) (2%) 100 97 94 $15 $10.7 91 88 85 $10 11.1%) $5 Jan-15 Aug-15 Apr-16 Dec-16 Jan-15 Jul-15 Jan-16 Jul-16 Dec-16 Jan-15 Aug-15 Apr-16 Dec-16 Average hourly real earnings (Units: 1982 – 1984 CPI adjusted dollars) Michigan consumer confidence index All urban consumers, seasonally adj. eCommerce Growth over Traditional Retail YoY eCommerce growth has gone from 25% in 2001 to 15% in 2015; YoY retail growth excluding eCommerce has declined from 3% in 2001 to 0.5% in 2015 Amazon capturing increasing share Competitive Promotional Environment Margins have declined in many retail sectors, primarily driven by heavy promotional activity Declining Mall Traffic Mall traffic has declined YoY in 142 out of 153 weeks since February 1, 2015 Christmas and Easter are drivers of rare positive mall traffic growth 15% 40% 5% 10% 7.3% 38% (5%) 5% .6% (15%) 36% 0% Jan-15Aug-15 Apr-16 Dec-16 '00 '05 '10 '15 (25%) Feb-14 Jan-15 Dec-15 Dec-16 Weighted Avg. LTM “Home Stores” Peer Gross Margin(1) Annual eCommerce Sales as % of Total Total Weekly Traffic YoY % Growth 7 Source: Factset, U.S. Census Bureau, Wall Street research and company filings as of February 3, 2017. (1) Home Stores includes BBBY, ETH, PIR, RH, WSM. Retail Operating Environment Macroeconomic Environment 37 0.9% Bump following U.S. election0.1% ( (0.2%)
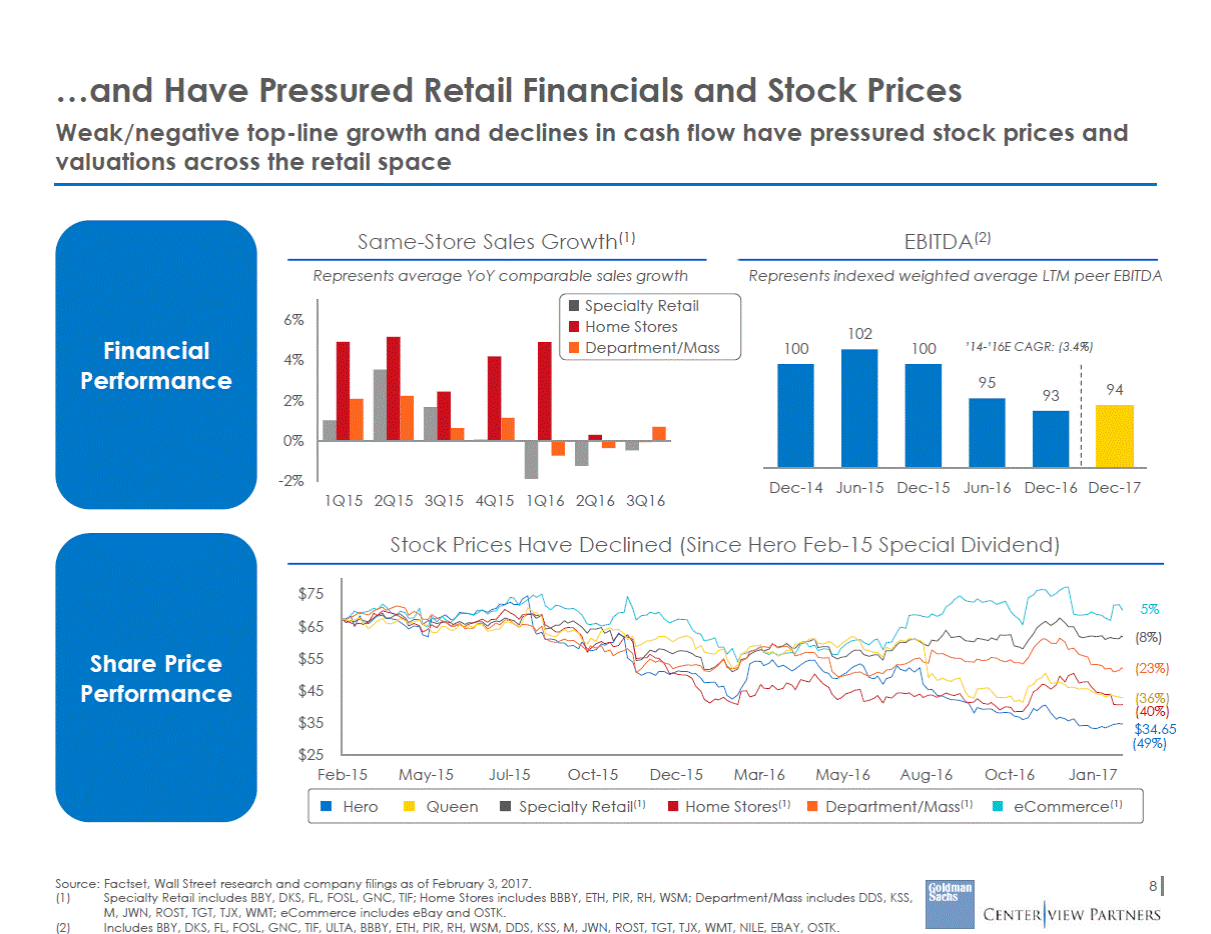
…and Have Pressured Retail Financials and Stock Prices Weak/negative top-line growth and declines in cash flow have pressured stock prices and valuations across the retail space Same-Store Sales Growth(1) Represents average YoY comparable sales growth EBITDA(2) Represents indexed weighted average LTM peer EBITDA Retail 6% s t/Mass 102 Financial Performance ’14-’16E CAGR: (3.4%) 100 100 4% 2% 0% -2% Dec-14 Jun-15 Dec-15 Jun-16 Dec-16 Dec-17 1Q15 2Q15 3Q15 4Q15 1Q16 2Q16 3Q16 Stock Prices Have Declined (Since Hero Feb-15 Special Dividend) $75 5% $65 (8%) $55 Share Price Performance (23%) $45 (36%) (40%) $34.65 (49%) $35 $25 Feb-15 May-15Jul-15 Oct-15 Dec-15 Mar-16 May-16 Aug-16 Oct-16 Jan-17 Hero Queen Specialty Retail(1) Home Stores(1) Department/Mass(1) eCommerce(1) Source: Factset, Wall Street research and company filings as of February 3, 2017. 8 (1) Specialty Retail includes BBY, DKS, FL, FOSL, GNC, TIF; Home Stores includes BBBY, ETH, PIR, RH, WSM; Department/Mass includes DDS, KSS, M, JWN, ROST, TGT, TJX, WMT; eCommerce includes eBay and OSTK. Includes BBY, DKS, FL, FOSL, GNC, TIF, ULTA, BBBY, ETH, PIR, RH, WSM, DDS, KSS, M, JWN, ROST, TGT, TJX, WMT, NILE, EBAY, OSTK. (2) 95 9394 Specialty Home Store Departmen
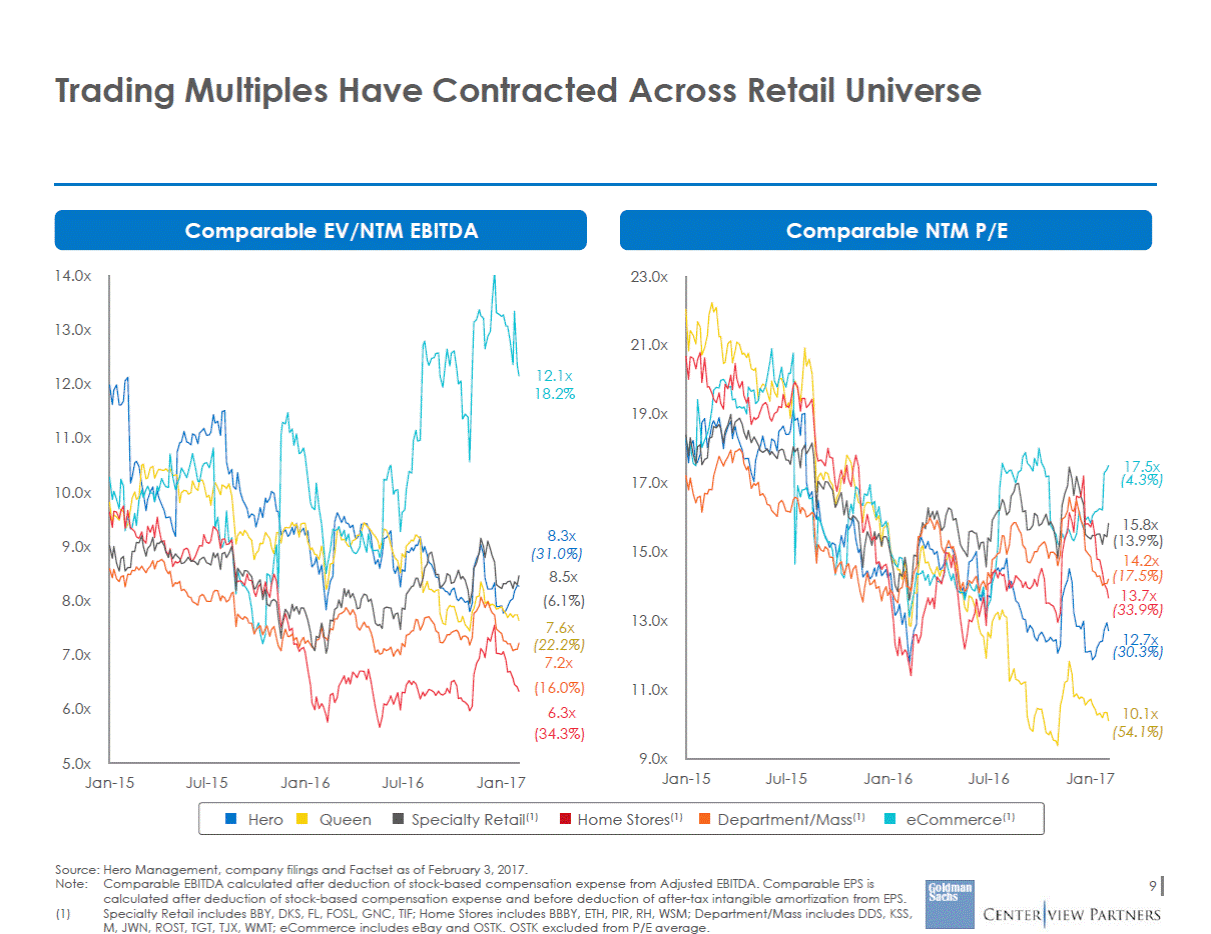
Trading Multiples Have Contracted Across Retail Universe Comparable EV/NTM EBITDA Comparable NTM P/E 14.0x 23.0x 13.0x 21.0x 12.1x 18.2% 12.0x 19.0x 11.0x 17.5x (4.3%) 17.0x 10.0x 15.8x (13.9%) 14.2x (17.5%) 13.7x (33.9%) 8.3x (31.0%) 8.5x (6.1%) 7.6x (22.2%) 7.2x (16.0%) 6.3x (34.3%) 9.0x 15.0x 8.0x 13.0x 12.7x (30.3%) 7.0x 11.0x 6.0x 10.1x (54.1%) 9.0x 5.0x Jan-15 Jul-15 Jan-16 Jul-16 Jan-17 Jan-15 Jul-15 Jan-16 Jul-16 Jan-17 Hero Queen Specialty Retail(1) Home Stores(1) Department/Mass(1) eCommerce(1) Source: Hero Management, company filings and Factset as of February 3, 2017. Note:Comparable EBITDA calculated after deduction of stock-based compensation expense from Adjusted EBITDA. Comparable EPS is calculated after deduction of stock-based compensation expense and before deduction of after-tax intangible amortization from EPS. 9 (1) Specialty Retail includes BBY, DKS, FL, FOSL, GNC, TIF; Home Stores includes BBBY, ETH, PIR, RH, WSM; Department/Mass includes DDS, KSS, M, JWN, ROST, TGT, TJX, WMT; eCommerce includes eBay and OSTK. OSTK excluded from P/E average.
II. Public Market Perspectives on Hero
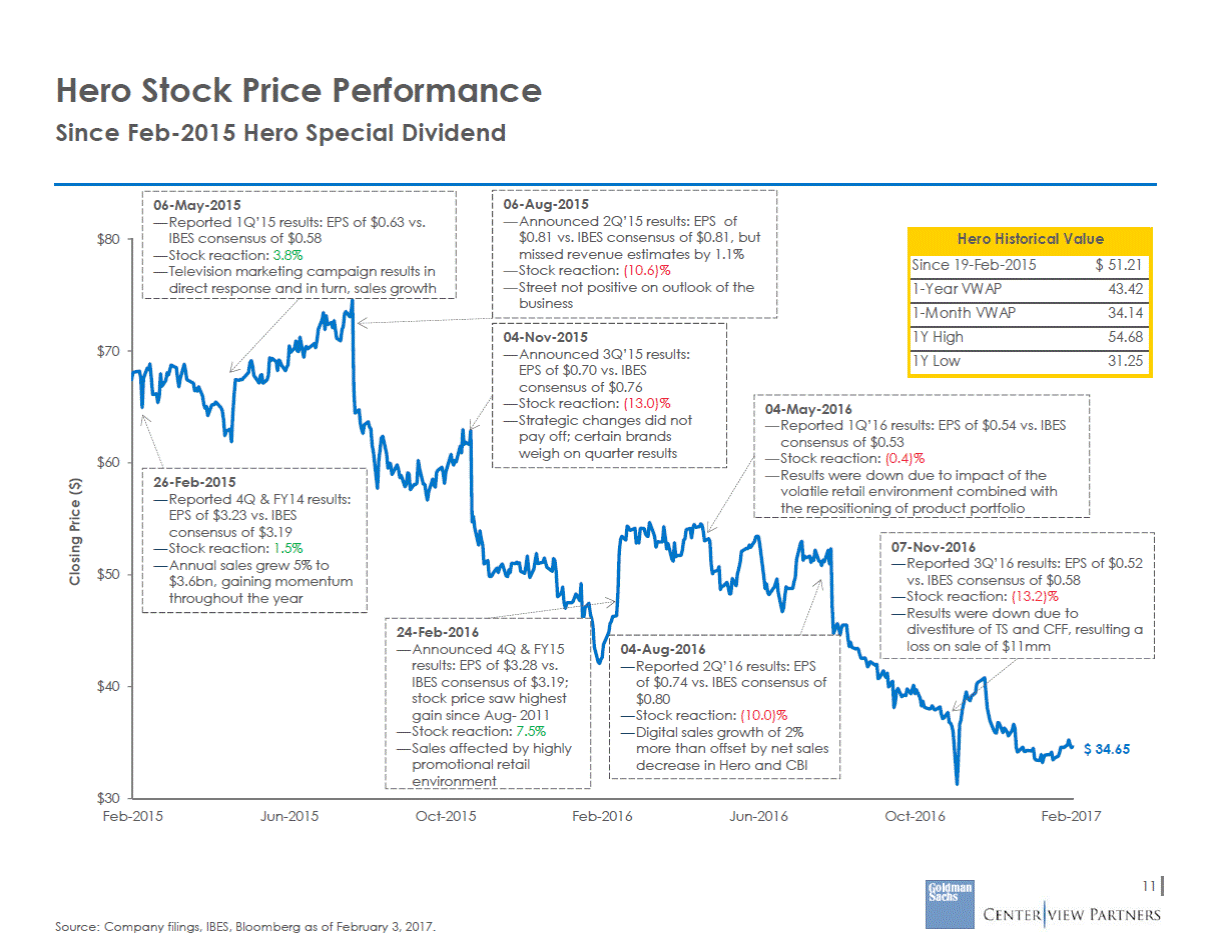
Hero Stock Price Performance Since Feb-2015 Hero Special Dividend 06-May-2015 — Reported 1Q’15 results: EPS of $0.63 vs. IBES consensus of $0.58 06-Aug-2015 — Announced 2Q’15 results: EPS of $0.81 vs. IBES consensus of $0.81, but $80 — Television marketing campaign results in — Stock reaction: (10.6)% $70 — Strategic changes did not — Reported 1Q’16 results: EPS of $0.54 vs. IBES weigh on quarter results $60 volatile retail environment combined with — Reported 4Q & FY14 results: EPS of $0.52 58 $50 to resulting a loss on sale of $11mm — Announced 4Q & FY15 04-Aug-2016 $40 $ 34.65 $30 Feb-2015 Jun-2015 Oct-2015 Feb-2016 Jun-2016 Oct-2016 Feb-2017 11 Source: Company filings, IBES, Bloomberg as of February 3, 2017. Closing Price ($) — Stock reaction: 3.8%missed revenue estimates by 1.1% direct response and in turn, sales growth— Street not positive on outlook of the business 04-Nov-2015 — Announced 3Q’15 results: EPS of $0.70 vs. IBES consensus of $0.76 — Stock reaction: (13.0)%04-May-2016 pay off; certain brandsconsensus of $0.53 — Stock reaction: (0.4)% 26-Feb-2015— Results were down due to impact of the EPS of $3.23 vs. IBESthe repositioning of product portfolio consensus of $3.19 — Stock reaction: 1.5%07-Nov-2016 — Annual sales grew 5% to— Reported 3Q’16 results: $3.6bn, gaining momentumvs. IBES consensus of $0. throughout the year— Stock reaction: (13.2)% — Results were down due 24-Feb-2016divestiture of TS and CFF, results: EPS of $3.28 vs.— Reported 2Q’16 results: EPS IBES consensus of $3.19;of $0.74 vs. IBES consensus of stock price saw highest$0.80 gain since Aug-2011— Stock reaction: (10.0)% — Stock reaction: 7.5%— Digital sales growth of 2% — Sales affected by highlymore than offset by net sales promotional retaildecrease in Hero and CBI environment Hero Historical Value Since 19-Feb-2015$ 51.21 1-Year VWAP43.42 1-M onth VWAP34.14 1Y High54.68 1Y Low31.25
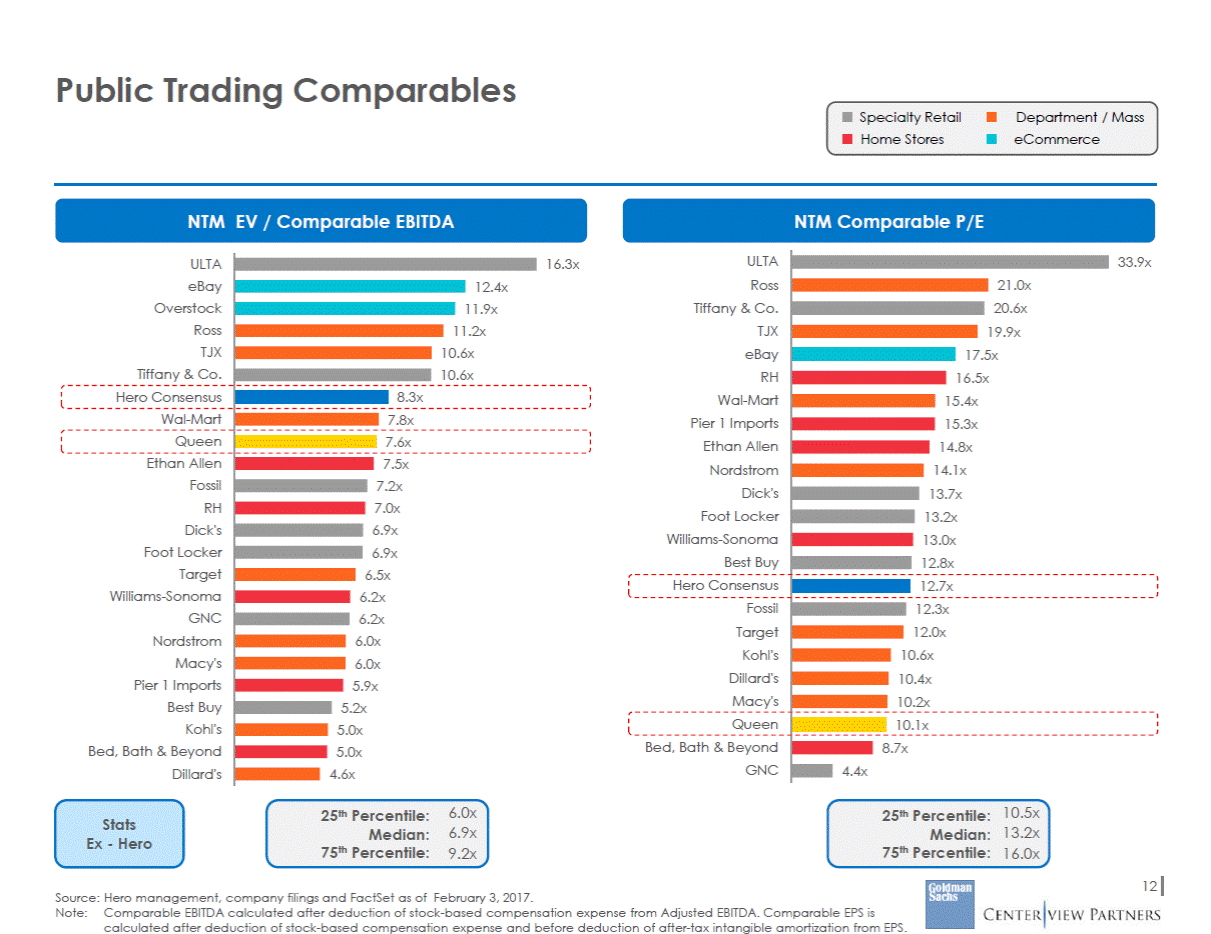
Public Trading Comparables Specialty Retail Home Stores Department / Mass eCommerce NTM EV / Comparable EBITDA NTM Comparable P/E ULTA Ross Tiffany & Co. TJX eBay RH Wal-Mart Pier 1 Imports Ethan Allen Nordstrom Dick's Foot Locker Williams-Sonoma Best Buy ULTA eBay Overstock Ross TJX Tiffany & Co. 33.9x 16.3x Hero Consensus 7x 6.0x 6.9x 9.2x 10.5x 13.2x 16.0x 25th Percentile: Median: 75th Percentile: 25th Percentile: Median: 75th Percentile: Stats Ex - Hero 12 Source: Hero management, company filings and FactSet as of February 3, 2017. Note:Comparable EBITDA calculated after deduction of stock-based compensation expense from Adjusted EBITDA. Comparable EPS is calculated after deduction of stock-based compensation expense and before deduction of after-tax intangible amortization from EPS. 21.0x 20.6x 19.9x 17.5x 16.5x 15.4x 15.3x 14.8x 14.1x 13.7x 13.2x 13.0x 12.8x Hero Consensus 12.7x Fossil Target Kohl's Dillard's Macy's Queen Bed, Bath & Beyond GNC 12.3x 12.0x 10.6x 10.4x 10.2x 10.1x 8. 4.4x 12.4x 11.9x 11.2x 10.6x 10.6x 8.3x Wal-Mart 7.8x Queen 7.6x Ethan Allen Fossil RH Dick's Foot Locker Target Williams-Sonoma GNC Nordstrom Macy's Pier 1 Imports Best Buy Kohl's Bed, Bath & Beyond Dillard's 7.5x 7.2x 7.0x 6.9x 6.9x 6.5x 6.2x 6.2x 6.0x 6.0x 5.9x 5.2x 5.0x 5.0x 4.6x
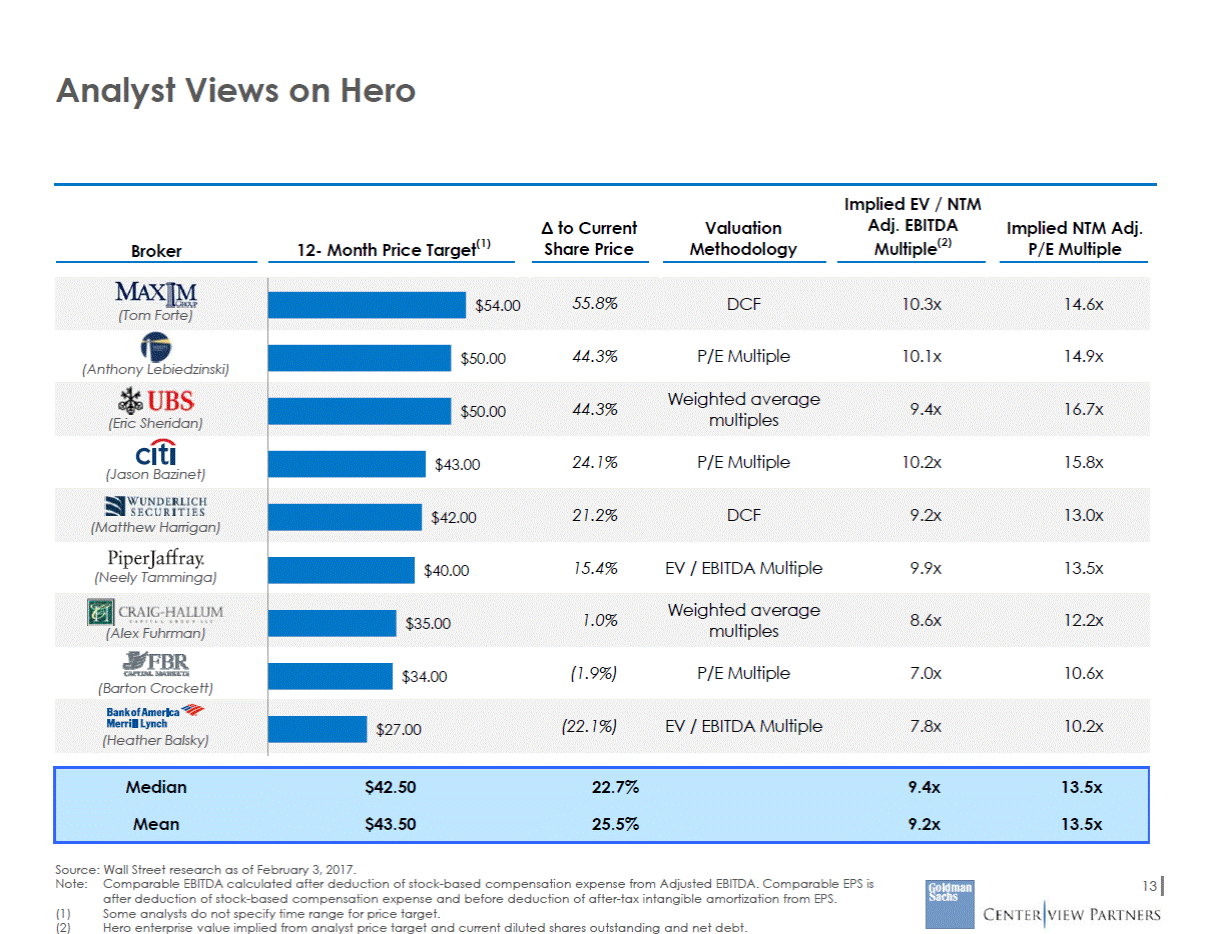
Analyst Views on Hero Implied EV / NTM Adj. EBITDA Multiple(2) to Current Share Price Valuation Methodology Implied NTM Adj. P/E Multiple 12-Month Price Target(1) Broker 55.8% DCF 10.3x 14.6x $54.00 44.3% P/E Multiple 10.1x 14.9x $50.00 (Anthony Lebiedzinski) Weighted average multiples 44.3% 9.4x 16.7x $50.00 24.1% P/E Multiple 10.2x 15.8x $43.00 (Jason Bazinet) 21.2% DCF 9.2x 13.0x $42.00 15.4% EV / EBITDA Multiple 9.9x 13.5x $40.00 (Neely Tamminga) Weighted average multiples 1.0% 8.6x 12.2x $35.00 (1.9%) P/E Multiple 7.0x 10.6x $34.00 (Barton Crockett) (22.1%) EV / EBITDA Multiple 7.8x 10.2x $27.00 Source: Wall Street research as of February 3, 2017. Note: Comparable EBITDA calculated after deduction of stock-based compensation expense from Adjusted EBITDA. Comparable EPS is after deduction of stock-based compensation expense and before deduction of after-tax intangible amortization from EPS. Some analysts do not specify time range for price target. Hero enterprise value implied from analyst price target and current diluted shares outstanding and net debt. 13 (1) (2) Median $42.50 22.7% 9.4x 13.5x Mean $43.50 25.5% 9.2x 13.5x (Tom Forte) (Eric Sheridan) (Matthew Harrigan) (Alex Fuhrman) (Heather Balsky)
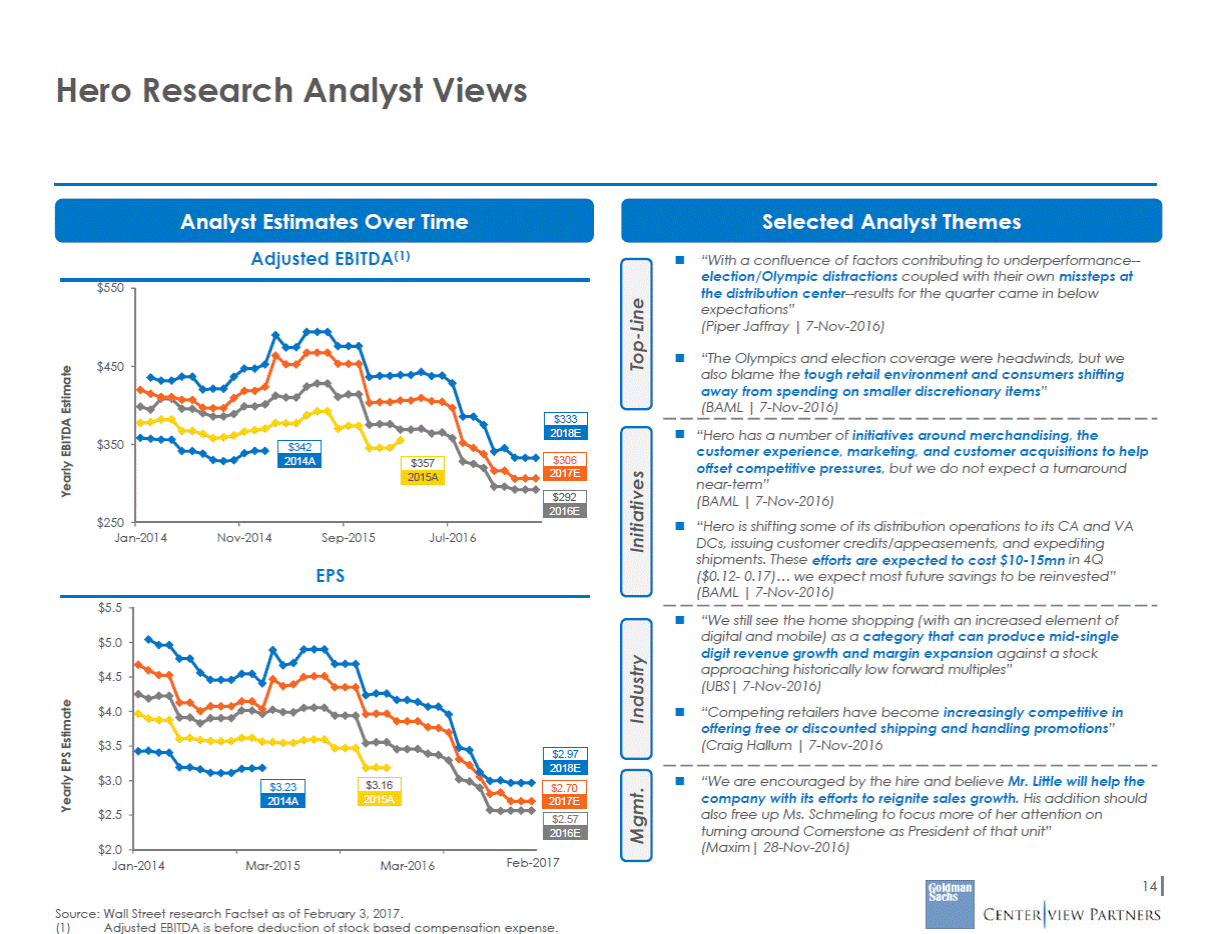
Hero Research Analyst Views Analyst Estimates Over Time Adjusted EBITDA(1) Selected Analyst Themes “With a confluence of factors contributing to underperformance--election/Olympic distractions coupled with their own missteps at the distribution center--results for the quarter came in below expectations” (Piper Jaffray | 7-Nov-2016) $550 “The Olympics and election coverage were headwinds, but we also blame the tough retail environment and consumers shifting away from spending on smaller discretionary items” (BAML | 7-Nov-2016) $450 “Hero has a number of initiatives around merchandising, the customer experience, marketing, and customer acquisitions to help offset competitive pressures, but we do not expect a turnaround near-term” (BAML | 7-Nov-2016) “Hero is shifting some of its distribution operations to its CA and VA DCs, issuing customer credits/appeasements, and expediting shipments. These efforts are expected to cost $10-15mn in 4Q ($0.12-0.17)… we expect most future savings to be reinvested” (BAML | 7-Nov-2016) $350 $250 Jan-2014 Nov-2014 Sep-2015 Jul-2016 EPS $5.5 “We still see the home shopping (with an increased element of digital and mobile) as a category that can produce mid-single digit revenue growth and margin expansion against a stock approaching historically low forward multiples” (UBS| 7-Nov-2016) “Competing retailers have become increasingly competitive in offering free or discounted shipping and handling promotions” (Craig Hallum | 7-Nov-2016 $5.0 $4.5 $4.0 $3.5 $3.0 “We are encouraged by the hire and believe Mr. Little will help the company with its efforts to reignite sales growth. His addition should also free up Ms. Schmeling to focus more of her attention on turning around Cornerstone as President of that unit” (Maxim| 28-Nov-2016) $2.5 $2.0 Feb-2017 Jan-2014 Mar-2015 Mar-2016 14 Source: Wall Street research Factset as of February 3, 2017. (1) Adjusted EBITDA is before deduction of stock based compensation expense. Yearly EPS Estimate Yearly EBITDA Estimate Mgmt. Industry Initiatives Top-Line $2.70 2017E $2.57 2016E $2.97 2018E $3.16 2015A $3.23 2014A $292 2016E $306 2017E $333 2018E $357 2015A $342 2014A
III. Review of Hero’s Standalone Plan
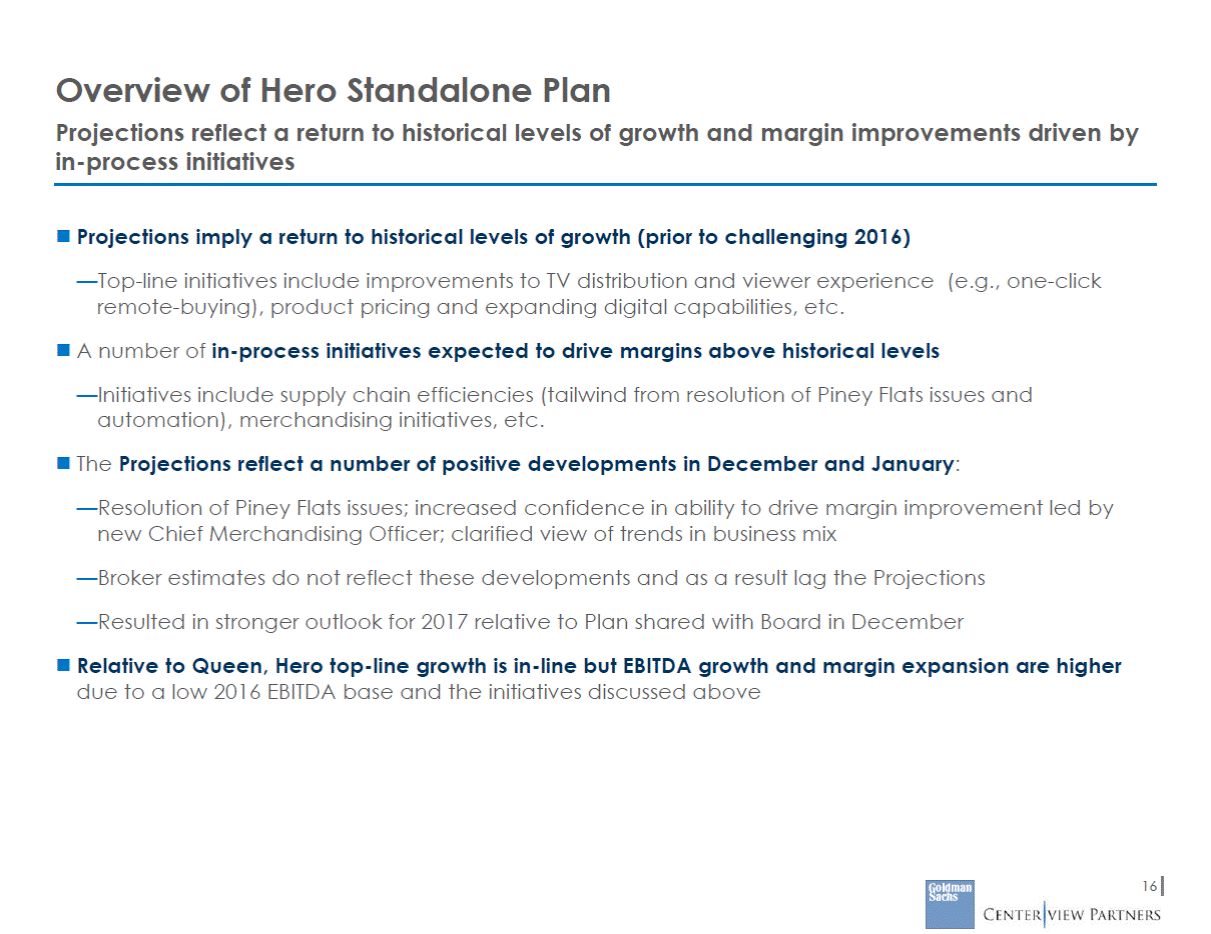
Overview of Hero Standalone Plan Projections reflect a return to historical levels of growth and margin improvements driven by in-process initiatives Projections imply a return to historical levels of growth (prior to challenging 2016) —Top-line initiatives include improvements to TV distribution and viewer experience (e.g., one-click remote-buying), product pricing and expanding digital capabilities, etc. A number of in-process initiatives expected to drive margins above historical levels —Initiatives include supply chain efficiencies (tailwind from resolution of Piney Flats issues and automation), merchandising initiatives, etc. The Projections reflect a number of positive developments in December and January: —Resolution of Piney Flats issues; increased confidence in ability to drive margin improvement led by new Chief Merchandising Officer; clarified view of trends in business mix —Broker estimates do not reflect these developments and as a result lag the Projections —Resulted in stronger outlook for 2017 relative to Plan shared with Board in December Relative to Queen, Hero top-line growth is in-line but EBITDA growth and margin expansion are higher due to a low 2016 EBITDA base and the initiatives discussed above 16
Hero Projections Summary Projections imply 7.7% Adjusted EBITDA CAGR and 8.8% EPS CAGR from 2016A-2021E Revenue Adjusted EBITDA(1) EPS $4,257 $3.99 $441 $3.28 $361 $346 $3,524 2015A 2016A 2017E 2018E 2019E 2020E 2021E 2015A 2016A 2017E 2018E 2019E 2020E 2021E 2015A 2016A 2017E 2018E 2019E 2020E 2021E YoY Growth % Margin % YoY Growth 2% (20%) 0% 16% 10% 9% 9% 3.4% (1.9%) 3.2% 4.1% 4.2% 3.9% 3.8% 10.1% 8.6% 8.4% 9.1% 9.5% 9.9% 10.4% 17 Source: Hero Management. Note:Revenue and EBITDA historical figures are pro forma for divestitures of TravelSmith and Chasing Fireflies from Cornerstone. (1) Adjusted EBITDA is before deduction of stock based compensation expense. $408 $377 $304 $307 $3.65 $3.34 $3.03 $2.62 $2.62 $4,100 $3,946 $3,786 $3,591$3,637
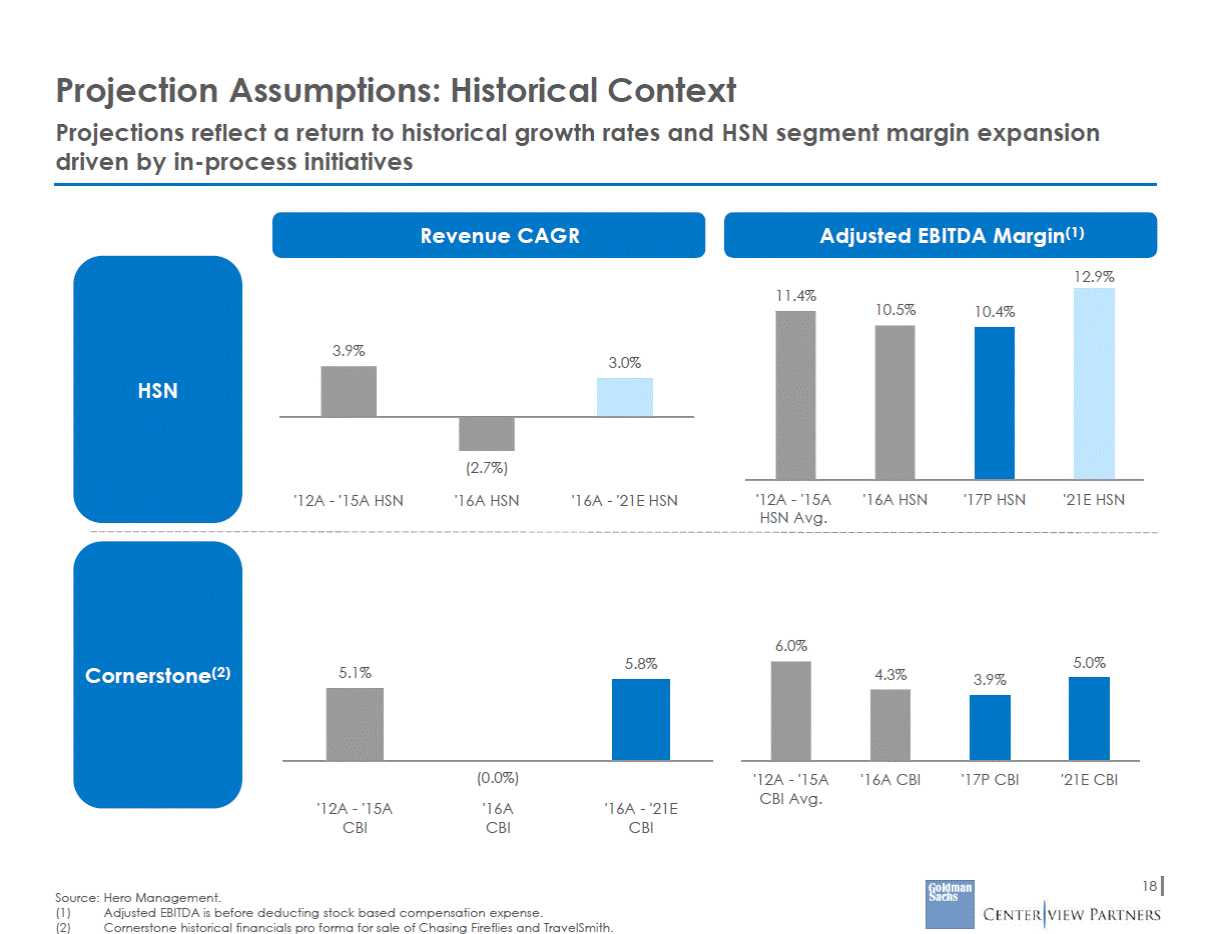
Projection Assumptions: Historical Context Projections reflect a return to historical growth rates and HSN segment margin expansion driven by in-process initiatives Adjusted EBITDA Margin(1) 12.9% Revenue CAGR 10.5% 10.4% 3.9% 3.0% HSN (2.7%) '12A - '15A HSN Avg. '16A HSN '17P HSN '21E HSN '12A - '15A HSN '16A HSN '16A - '21E HSN 6.0% 5.0% 5.8% Cornerstone(2) 5.1% 4.3% 3.9% (0.0%) '12A - '15A CBI Avg. '16A CBI '17P CBI '21E CBI '12A - '15A CBI '16A CBI '16A - '21E CBI 18 Source: Hero Management. (1) (2) Adjusted EBITDA is before deducting stock based compensation expense. Cornerstone historical financials pro forma for sale of Chasing Fireflies and TravelSmith. 11.4%
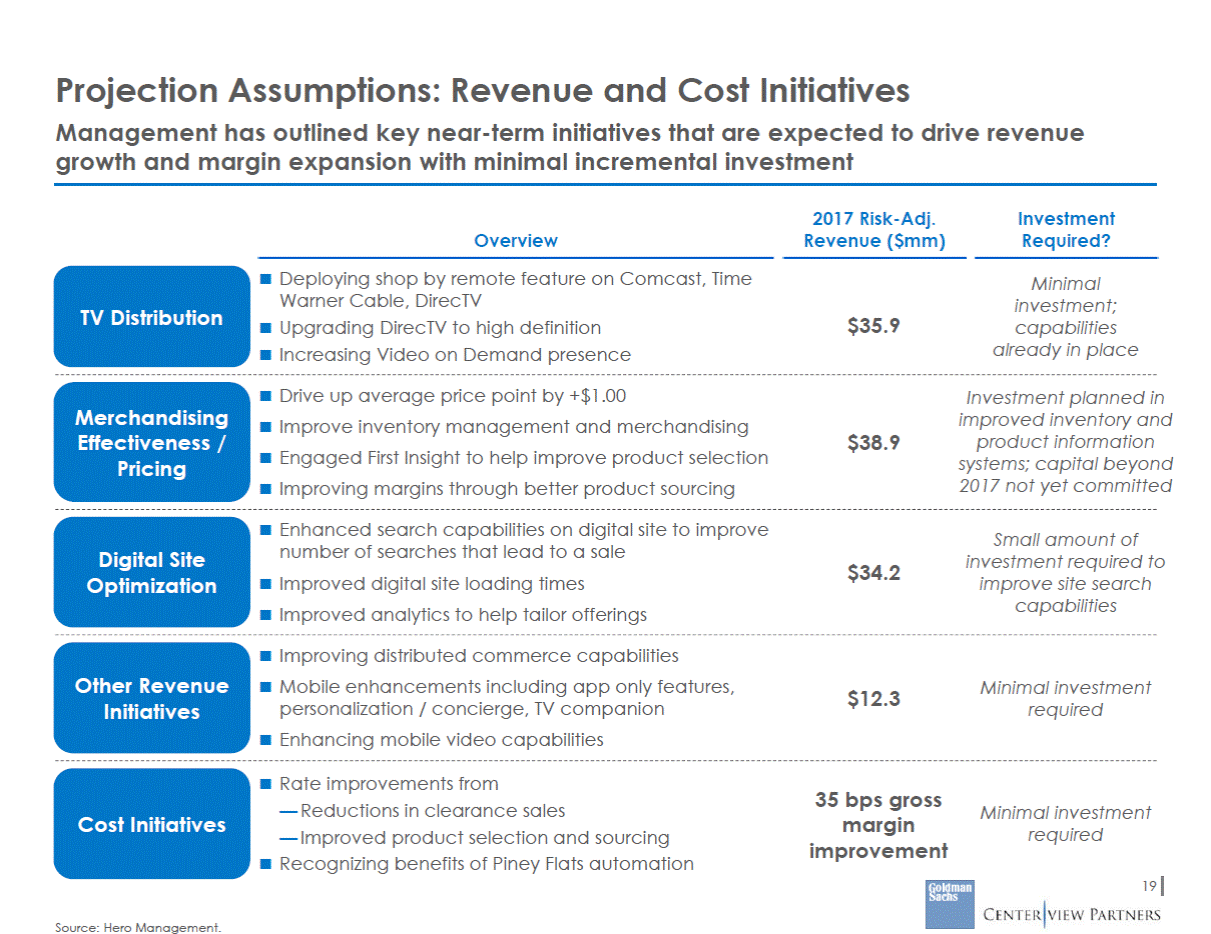
Projection Assumptions: Revenue and Cost Initiatives Management has outlined key near-term initiatives that are expected to drive revenue growth and margin expansion with minimal incremental investment 2017 Risk-Adj. Revenue ($mm) Investment Required? Overview Deploying shop by remote feature on Comcast, Time Warner Cable, DirecTV Upgrading DirecTV to high definition Increasing Video on Demand presence Minimal investment; capabilities already in place TV Distribution $35.9 Drive up average price point by +$1.00 Improve inventory management and merchandising Engaged First Insight to help improve product selection Improving margins through better product sourcing Investment planned in improved inventory and product information systems; capital beyond 2017 not yet committed Merchandising Effectiveness / Pricing $38.9 Enhanced search capabilities on digital site to improve number of searches that lead to a sale Improved digital site loading times Improved analytics to help tailor offerings Small amount of investment required to improve site search capabilities Digital Site Optimization $34.2 Improving distributed commerce capabilities Mobile enhancements including app only features, personalization / concierge, TV companion Enhancing mobile video capabilities Other Revenue Initiatives Minimal investment required $12.3 Rate improvements from — Reductions in clearance sales — Improved product selection and sourcing Recognizing benefits of Piney Flats automation 35 bps gross margin improvement Minimal investment required Cost Initiatives 19 Source: Hero Management.
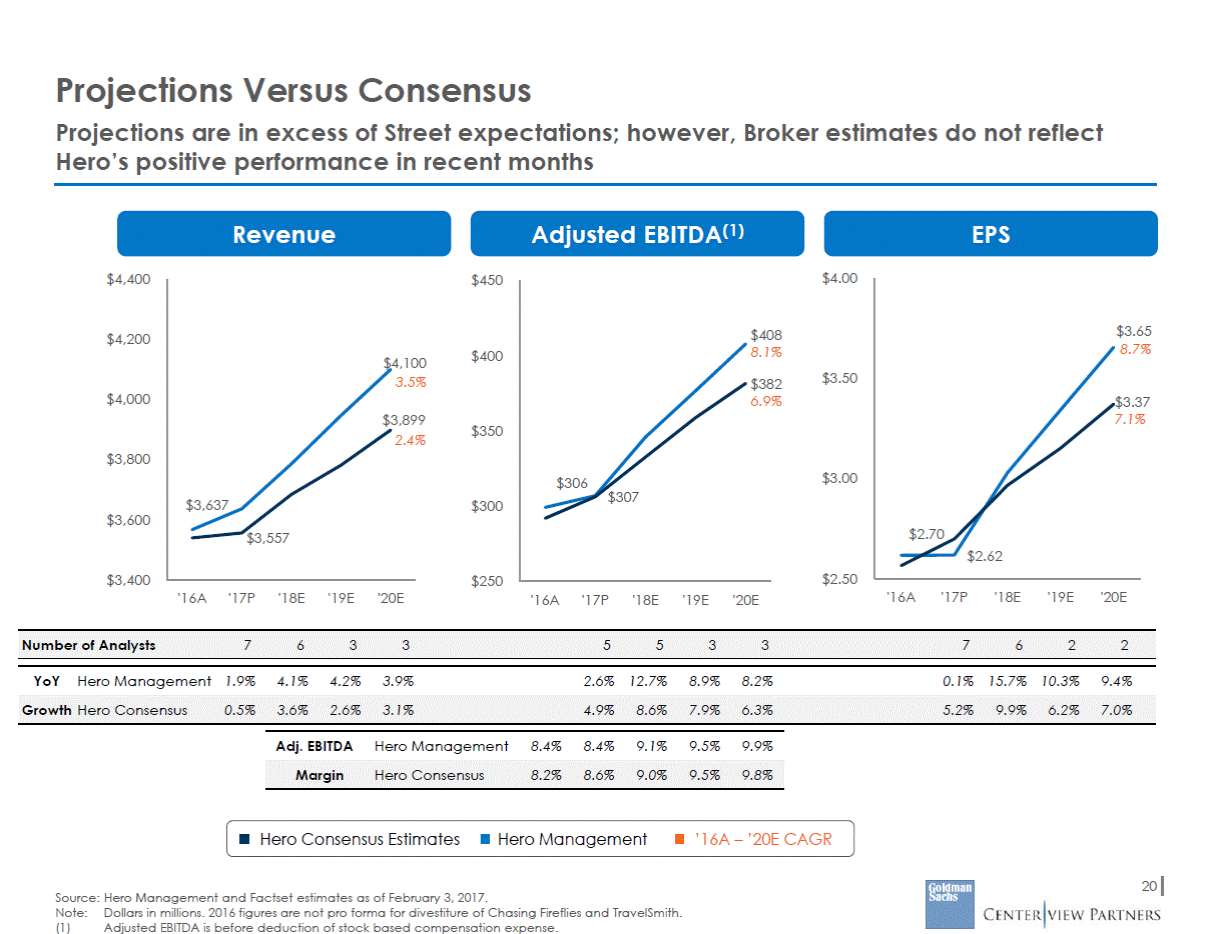
Projections Versus Consensus Projections are in excess of Street expectations; however, Broker estimates do not reflect Hero’s positive performance in recent months Adjusted EBITDA(1) Revenue EPS $4.00 $4,400 $450 65 % $408 % $4,200 $400 00 % $3.50 $382 % $4,000 7 % 99 % $350 $3,800 $3.00 $300 $3,600 $2.50 $3,400 $250 '16A '17P '18E '19E '20E '16A '17P '18E '19E '20E '16A '17P '18E '19E '20E YoY Hero Management 1.9% 4.1% 4.2% 3.9% 2.6% 12.7% 8.9% 8.2% 0.1% 15.7% 10.3% 9.4% Adj. EBITDA Hero Management 8.4% 8.4% 9.1% 9.5% 9.9% Hero Consensus EstimatesHero Management ’16A – ’20E CAGR 20 Source: Hero Management and Factset estimates as of February 3, 2017. Note:Dollars in millions. 2016 figures are not pro forma for divestiture of Chasing Fireflies and TravelSmith. (1) Adjusted EBITDA is before deduction of stock based compensation expense. Margin Hero Consensus 8.2% 8.6% 9.0% 9.5% 9.8% Growth Hero Consensus 0.5% 3.6% 2.6% 3.1% 4.9% 8.6% 7.9% 6.3% 5.2% 9.9% 6.2% 7.0% Number of Analysts 7 6 3 3 5 5 3 3 7 6 2 2 $3. 8.7 $3.3 7.1 $2.70 $2.62 8.1 6.9 $306 $307 $4,1 3.5 $3,8 2.4 $3,637 $3,557
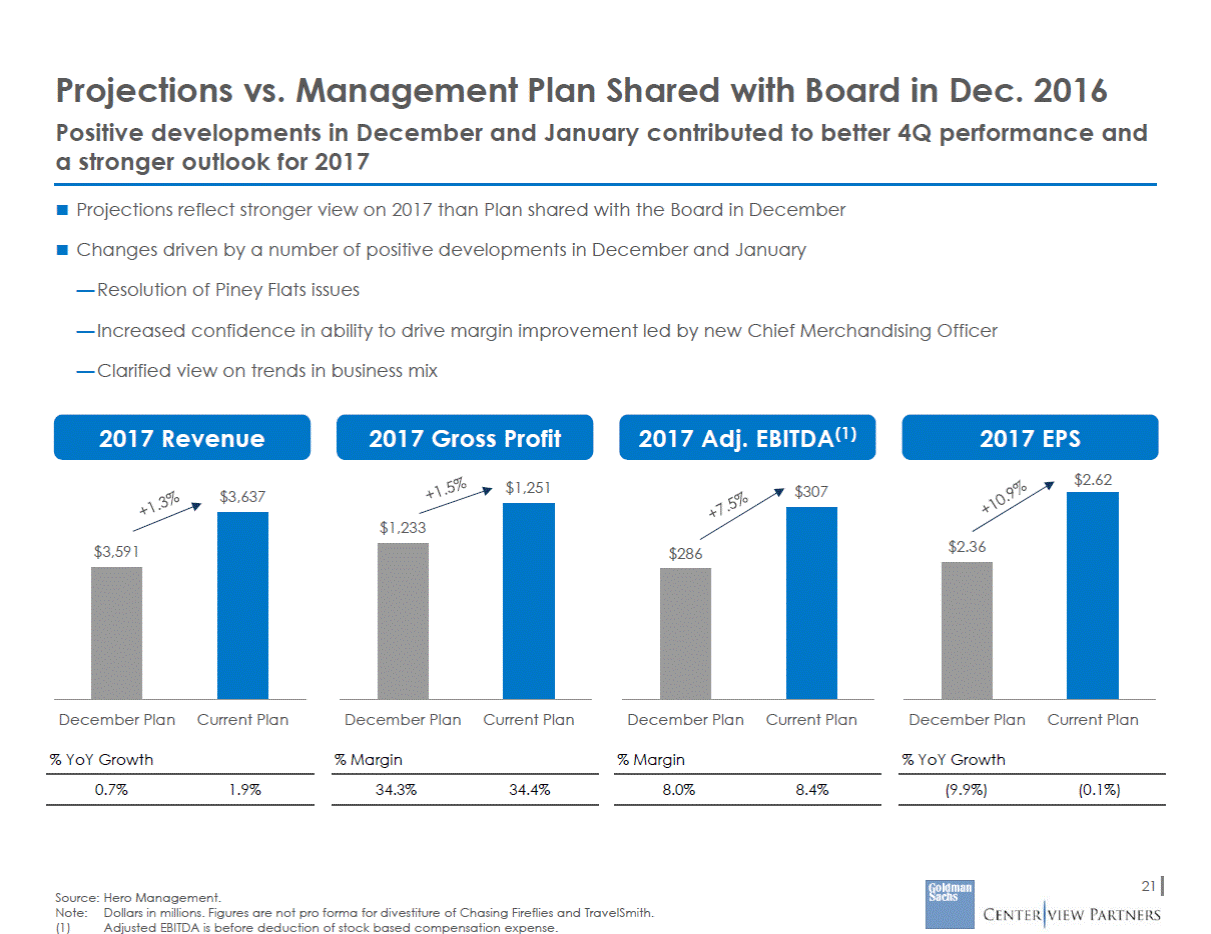
Projections vs. Management Plan Shared with Board in Dec. 2016 Positive developments in December and January contributed to better 4Q performance and a stronger outlook for 2017 Projections reflect stronger view on 2017 than Plan shared with the Board in December Changes driven by a number of positive developments in December and January — Resolution of Piney Flats issues — Increased confidence in ability to drive margin improvement led by new Chief Merchandising Officer — Clarified view on trends in business mix 2017 Revenue 2017 Gross Profit 2017 Adj. EBITDA(1) 2017 EPS $2.62 $1,251 $307 $3,637 December Plan Current Plan December Plan Current Plan December Plan Current Plan December Plan Current Plan % YoY Growth % Margin % Margin % YoY Growth 0.7% 1.9% 34.3% 34.4% 8.0% 8.4% (9.9%) (0.1%) 21 Source: Hero Management. Note:Dollars in millions. Figures are not pro forma for divestiture of Chasing Fireflies and TravelSmith. (1) Adjusted EBITDA is before deduction of stock based compensation expense. $3,591 $286 $1,233 $2.36
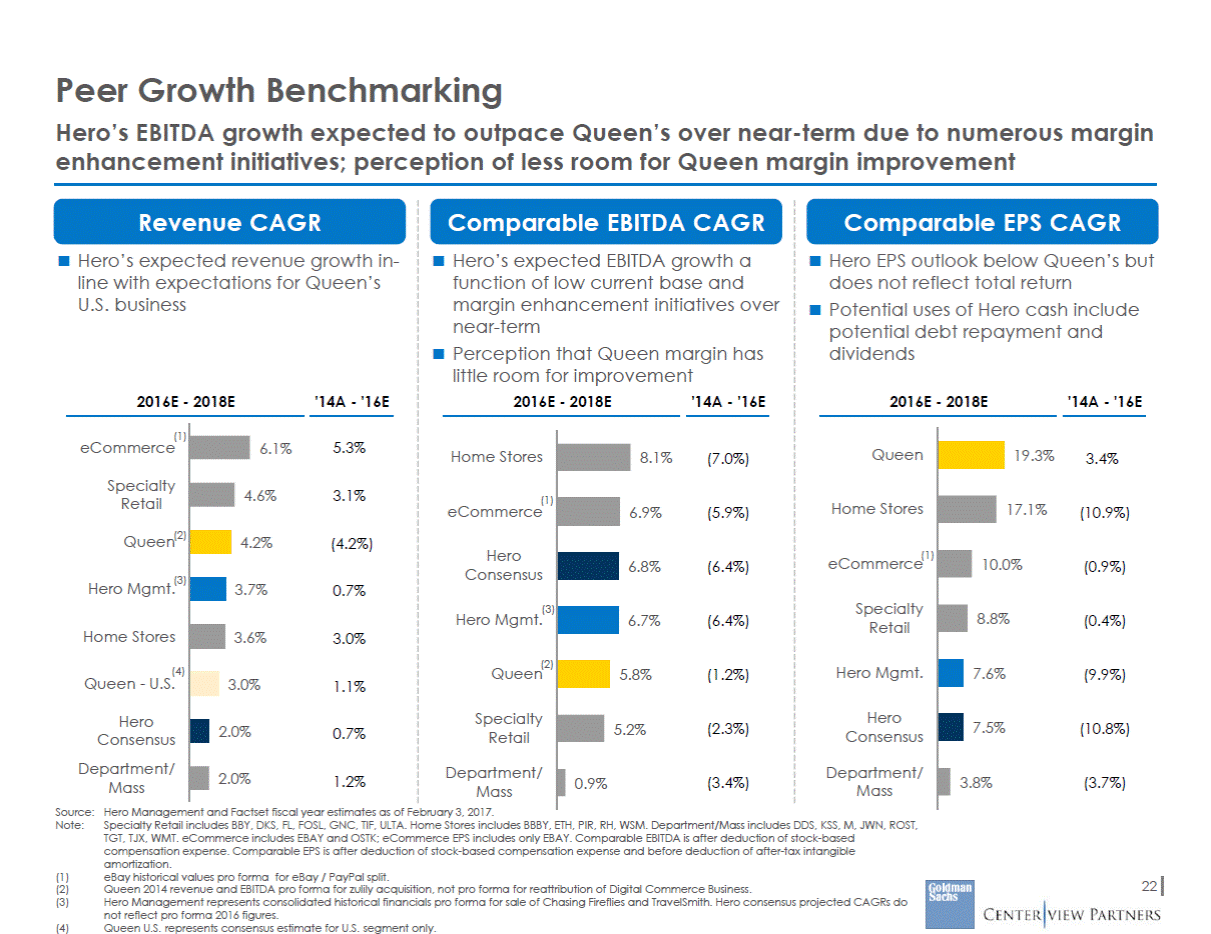
Peer Growth Benchmarking Hero’s EBITDA growth expected to outpace Queen’s over near-term due to numerous margin enhancement initiatives; perception of less room for Queen margin improvement Revenue CAGR Hero’s expected revenue growth in-line with expectations for Queen’s U.S. business Comparable EBITDA CAGR Hero’s expected EBITDA growth a function of low current base and margin enhancement initiatives over near-term Perception that Queen margin has little room for improvement Comparable EPS CAGR Hero EPS outlook below Queen’s but does not reflect total return Potential uses of Hero cash include potential debt repayment and dividends 2016E - 2018E '14A - '16E 2016E - 2018E '14A - '16E 2016E - 2018E '14A - '16E (1) eCommerce 6.1% 5.3% Queen Home Stores 19.3% 8.1% (7.0%) 3.4% Specialty Retail 4.6% 3.1% (1) eCommerce Home Stores 17.1% 6.9% (5.9%) (10.9%) Queen(2) 4.2% (4.2%) Hero Consensus (1) eCommerce 0% 6.8% (6.4%) (0.9%) (3) Hero Mgmt. 7% 0.7% Specialty Retail (3) Hero Mgmt. (6.4%) 8% (0.4%) 6.7% Home Stores 6% 3.0% (2) (4) Queen - U.S. Queen Hero Mgmt. 8% (1.2%) (9.9%) % 1.1% Hero Consensus Specialty Retail Hero Consensus Department/ Mass (2.3%) (10.8%) 2% 0.7% Department/ Mass Department/ Mass 1.2% (3.4%) (3.7%) Source: Note: Hero Management and Factset fiscal year estimates as of February 3, 2017. Specialty Retail includes BBY, DKS, FL, FOSL, GNC, TIF, ULTA. Home Stores includes BBBY, ETH, PIR, RH, WSM. Department/Mass includes DDS, KSS, M, JWN, ROST, TGT, TJX, WMT. eCommerce includes EBAY and OSTK; eCommerce EPS includes only EBAY. Comparable EBITDA is after deduction of stock-based compensation expense. Comparable EPS is after deduction of stock-based compensation expense and before deduction of after-tax intangible amortization. eBay historical values pro forma for eBay / PayPal split. Queen 2014 revenue and EBITDA pro forma for zulily acquisition, not pro forma for reattribution of Digital Commerce Business. Hero Management represents consolidated historical financials pro forma for sale of Chasing Fireflies and TravelSmith. Hero consensus projected CAGRs do not reflect pro forma 2016 figures. Queen U.S. represents consensus estimate for U.S. segment only. (1) (2) (3) 22 (4) 5. 5. 0.9% 10. 8. 7.6% 7.5% 3.8% 3. 3. 3.0 2.0% 2.0%
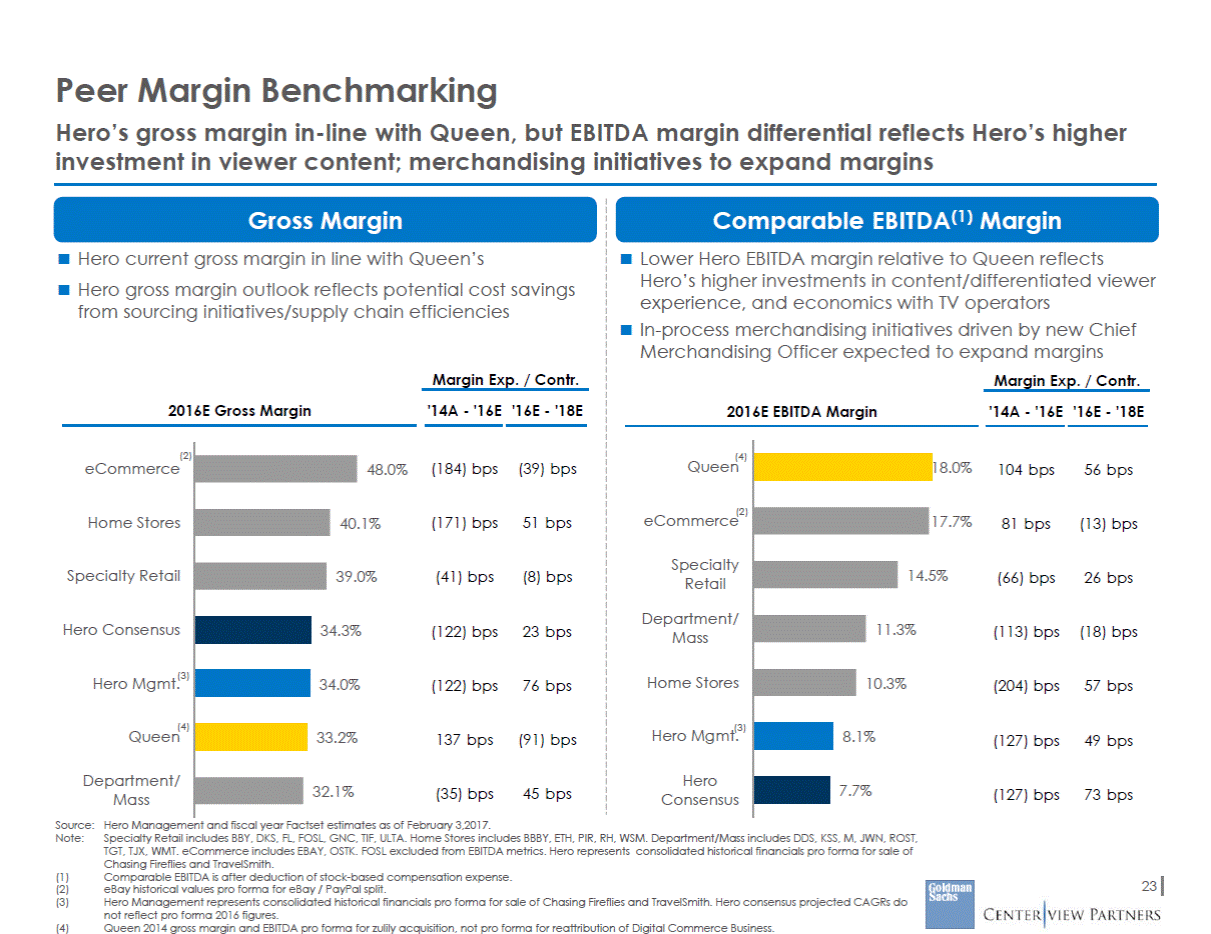
Peer Margin Benchmarking Hero’s gross margin in-line with Queen, but EBITDA margin differential reflects Hero’s higher investment in viewer content; merchandising initiatives to expand margins Comparable EBITDA(1) Margin Lower Hero EBITDA margin relative to Queen reflects Hero’s higher investments in content/differentiated viewer experience, and economics with TV operators In-process merchandising initiatives driven by new Chief Merchandising Officer expected to expand margins Margin Exp. / Contr. Gross Margin Hero current gross margin in line with Queen’s Hero gross margin outlook reflects potential cost savings from sourcing initiatives/supply chain efficiencies Margin Exp. / Contr. 2016E Gross Margin '14A - '16E '16E - '18E 2016E EBITDA Margin '14A - '16E '16E - '18E (2) eCommerce (4) Queen (184) bps (39) bps 18.0% 104 bps 56 bps 48.0% (2) eCommerce Home Stores (171) bps 51 bps 17.7% 40.1% 81 bps (13) bps Specialty Retail Specialty Retail 5% 0% (41) bps (8) bps (66) bps 26 bps Department/ Mass Hero Consensus % (122) bps 23 bps (113) bps (18) bps (3) Hero Mgmt. Home Stores 0% (122) bps 76 bps (204) bps 57 bps (4) Queen (3) Hero Mgmt. 137 bps (91) bps (127) bps 49 bps Hero Consensus Department/ Mass (35) bps 45 bps (127) bps 73 bps Source: Note: Hero Management and fiscal year Factset estimates as of February 3,2017. Specialty Retail includes BBY, DKS, FL, FOSL, GNC, TIF, ULTA. Home Stores includes BBBY, ETH, PIR, RH, WSM. Department/Mass includes DDS, KSS, M, JWN, ROST, TGT, TJX, WMT. eCommerce includes EBAY, OSTK. FOSL excluded from EBITDA metrics. Hero represents consolidated historical financials pro forma for sale of Chasing Fireflies and TravelSmith. Comparable EBITDA is after deduction of stock-based compensation expense. eBay historical values pro forma for eBay / PayPal split. Hero Management represents consolidated historical financials pro forma for sale of Chasing Fireflies and TravelSmith. Hero consensus projected CAGRs do not reflect pro forma 2016 figures. Queen 2014 gross margin and EBITDA pro forma for zulily acquisition, not pro forma for reattribution of Digital Commerce Business. (1) (2) (3) 23 (4) 39. 34.3 34. 33.2% 32.1% 14. 11.3% 10.3% 8.1% 7.7%
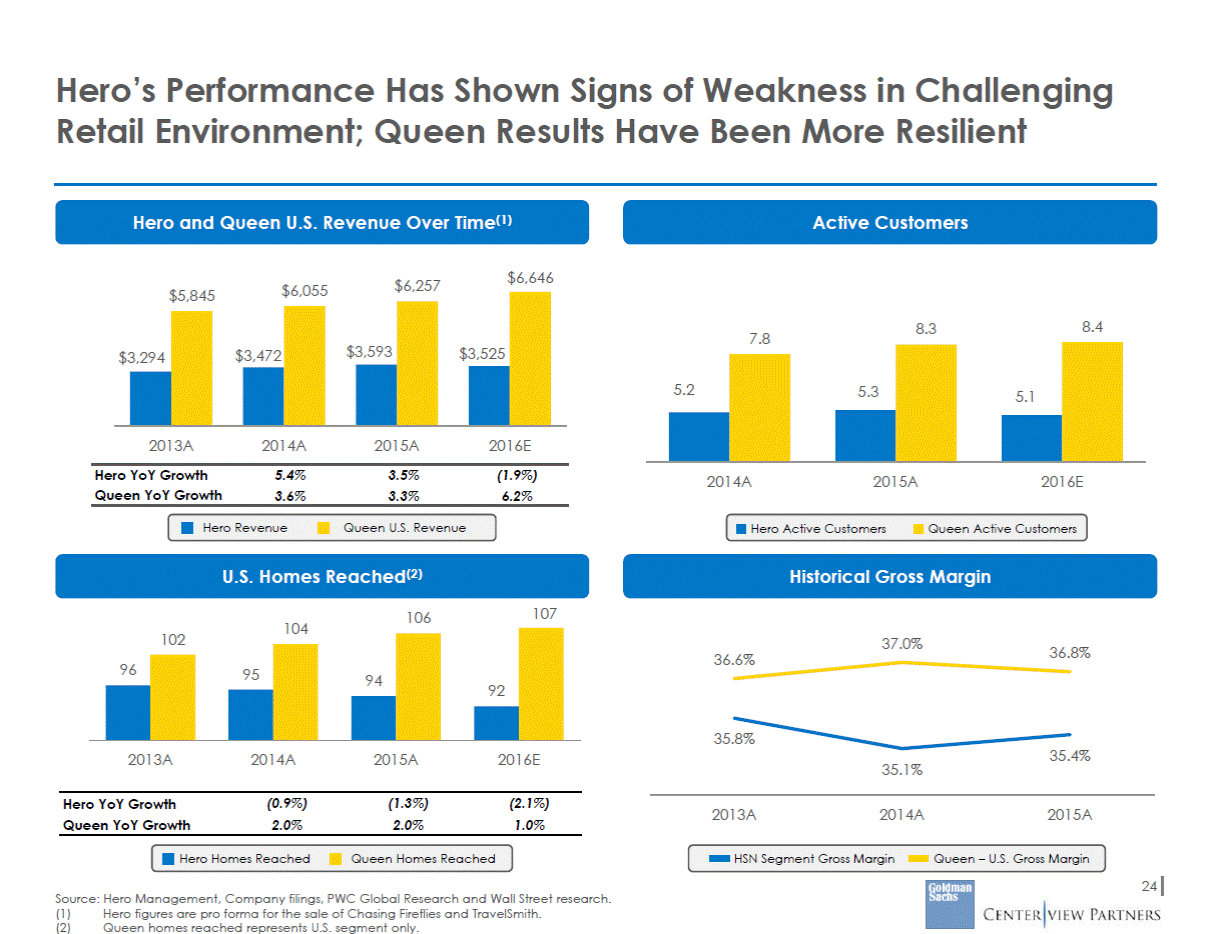
Hero’s Performance Has Shown Signs of Weakness in Challenging Retail Environment; Queen Results Have Been More Resilient Hero and Queen U.S. Revenue Over Time(1) Active Customers $6,646 $6,257 $6,055 $5,845 8.4 8.3 7.8 2013A 2014A 2015A 2016E Hero YoY Growth Queen YoY Growth 5.4% 3.6% 3.5% 3.3% (1.9%) 6.2% 2014A 2015A 2016E Hero Revenue Queen U.S. Revenue Queen Active Customers Hero Active Customers U.S. Homes Reached(2) Historical Gross Margin 107 106 104 37.0% 36.8% 36.6% 35.8% 35.4% 2013A 2014A 2015A 2016E 35.1% Hero YoY Growth Queen YoY Growth (0.9%) 2.0% (1.3%) 2.0% (2.1%) 1.0% 2013A 2014A 2015A Hero Homes Reached Queen Homes Reached HSN Segment Gross Margin Queen – U.S. Gross Margin 24 Source: Hero Management, Company filings, PWC Global Research and Wall Street research. (1) (2) Hero figures are pro forma for the sale of Chasing Fireflies and TravelSmith. Queen homes reached represents U.S. segment only. 102 92 94 96 95 5.1 5.2 5.3 $3,525 $3,593 $3,294 $3,472
IV. Preliminary Financial Analysis of Hero
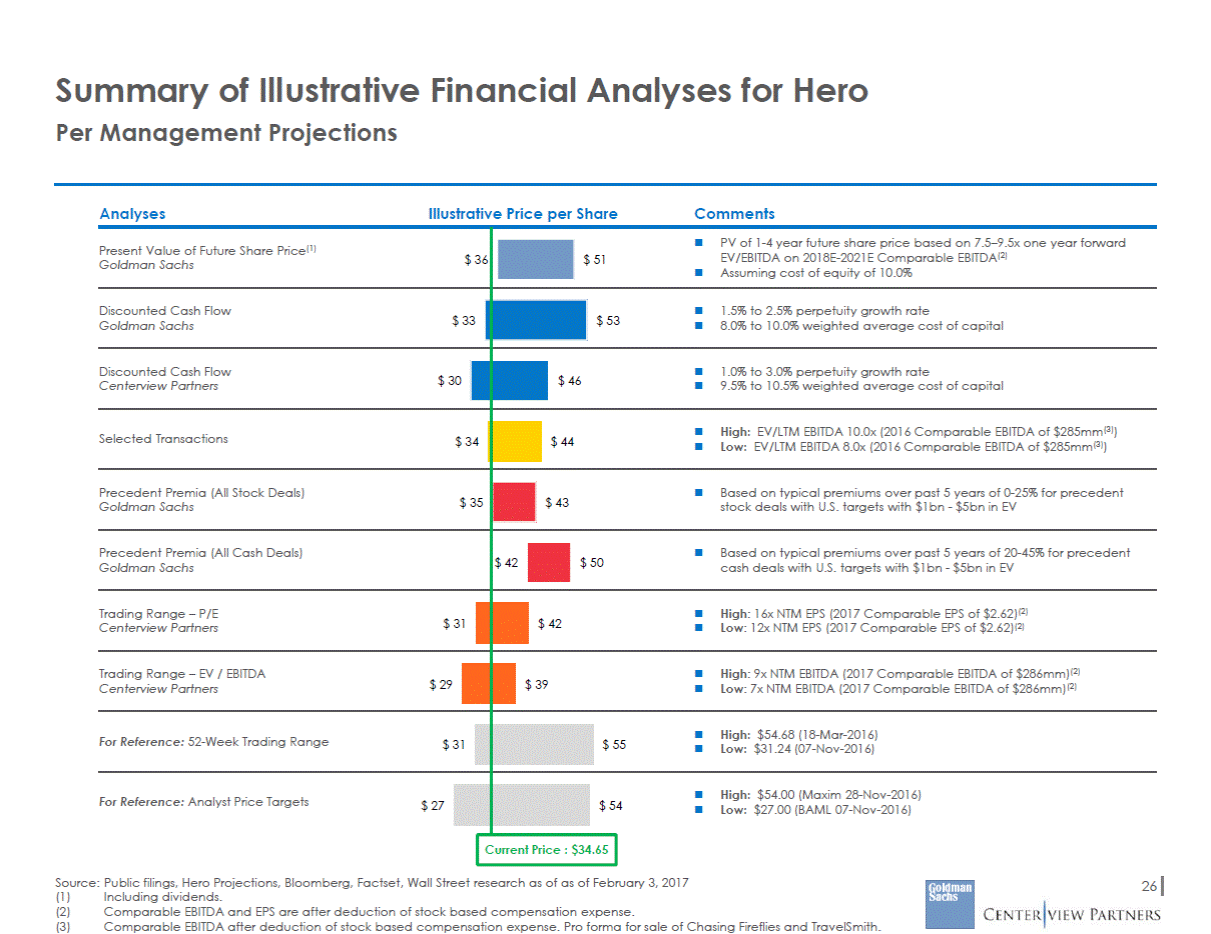
Summary of Illustrative Per Management Projections Financial Analyses for Hero Analyses Illustrative Price per Share Comments EV/EBITDA on 2018E-2021E Comparable EBITDA(2) $ 51 $ 53 8.0% to 10.0% weighted average cost of capital $ 46 9.5% to 10.5% weighted average cost of capital High: EV/LTM EBITDA 10.0x (2016 Comparable EBITDA of $285mm ) $ 44 $ 43 stock deals with U.S. targets with $1bn - $5bn in EV $ 42 $ 50 cash deals with U.S. targets with $1bn - $5bn in EV $ 42 Low: 12x NTM EPS (2017 Comparable EPS of $2.62)(2) $ 39 Low: 7x NTM EBITDA (2017 Comparable EBITDA of $286mm)(2) $ 55 Low: $31.24 (07-Nov-2016) $ 54 Low: $27.00 (BAML 07-Nov-2016) Current Price : $34.65 Source: Public filings, Hero Projections, Bloomberg, Factset, Wall Street research as of as of February 3, 2017 26 (1) (2) (3) Including dividends. Comparable EBITDA and EPS are after deduction of stock based compensation expense. Comparable EBITDA after deduction of stock based compensation expense. Pro forma for sale of Chasing Fireflies and TravelSmith. Present Value of Future Share Price(1) Goldman Sachs$ 36 PV of 1-4 year future share price based on 7.5–9.5x one year forward Assuming cost of equity of 10.0% Discounted Cash Flow Goldman Sachs$ 33 1.5% to 2.5% perpetuity growth rate Discounted Cash Flow Centerview Partners$ 30 1.0% to 3.0% perpetuity growth rate Selected Transactions$ 34 (3) Low: EV/LTM EBITDA 8.0x (2016 Comparable EBITDA of $285mm(3)) Precedent Premia (All Stock Deals) Goldman Sachs$ 35 Based on typical premiums over past 5 years of 0-25% for precedent Precedent Premia (All Cash Deals) Goldman Sachs Based on typical premiums over past 5 years of 20-45% for precedent Trading Range – P/E Centerview Partners$ 31 High: 16x NTM EPS (2017 Comparable EPS of $2.62)(2) Trading Range – EV / EBITDA Centerview Partners$ 29 High: 9x NTM EBITDA (2017 Comparable EBITDA of $286mm)(2) For Reference: 52-Week Trading Range$ 31 High: $54.68 (18-Mar-2016) For Reference: Analyst Price Targets$ 27 High: $54.00 (Maxim 28-Nov-2016)
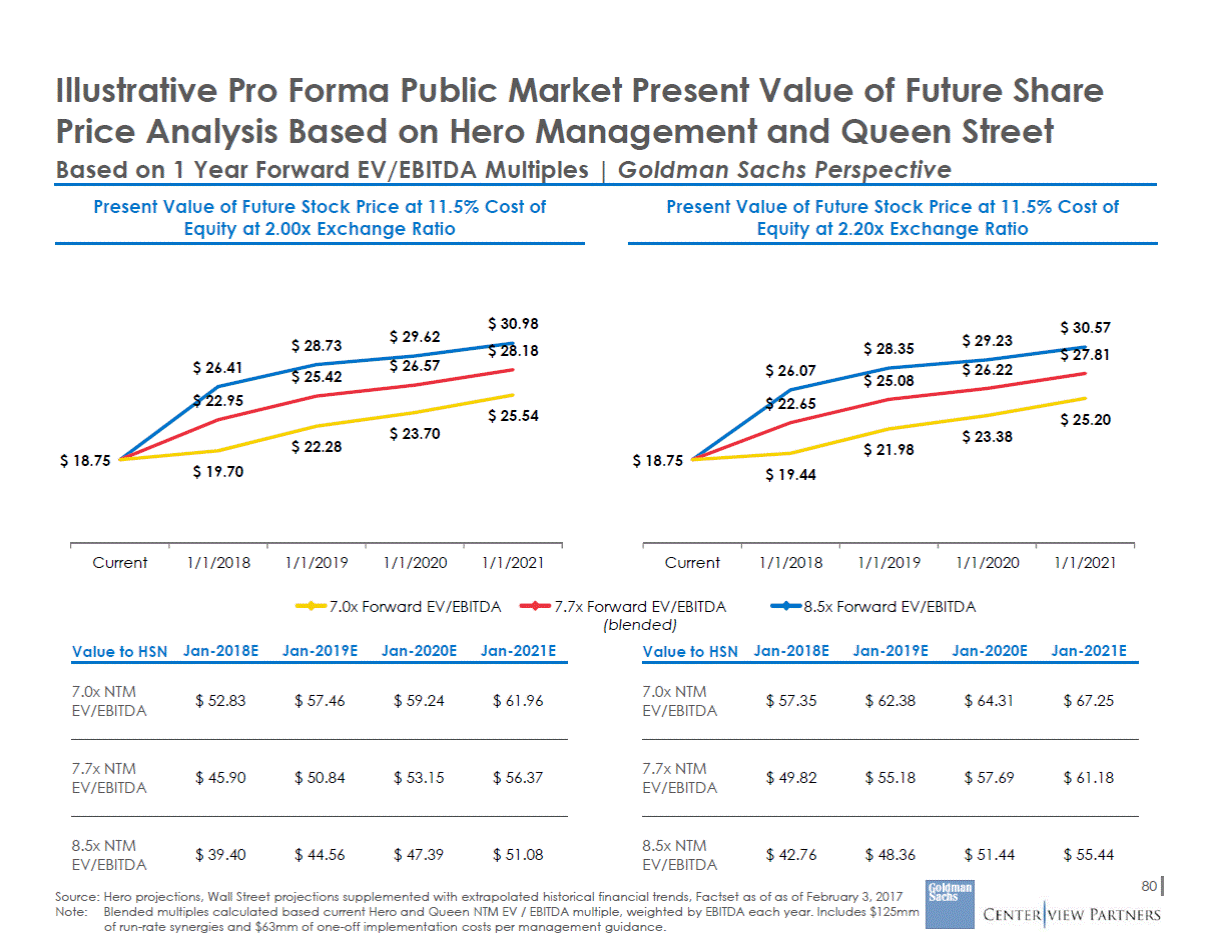
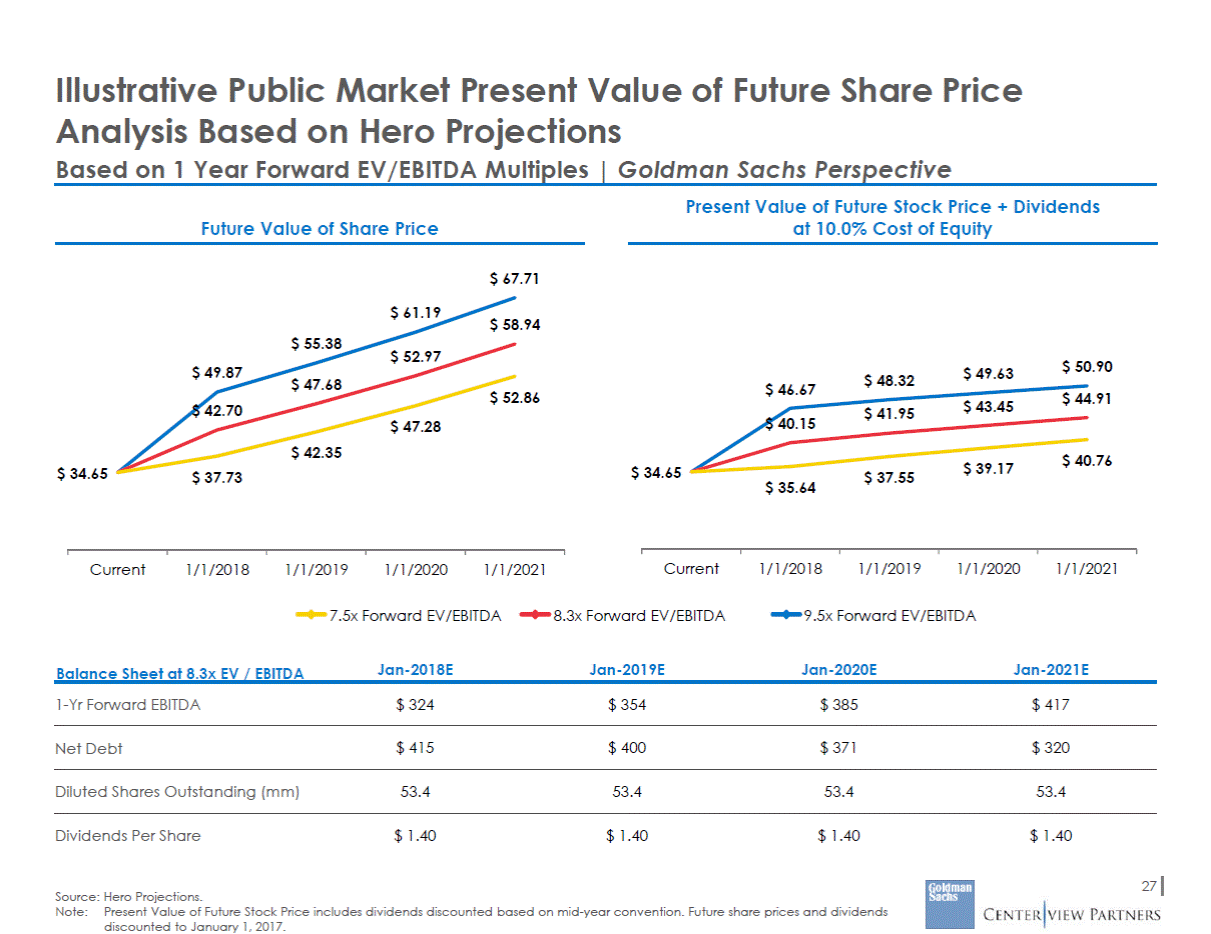
Illustrative Public Market Present Value of Future Share Price Analysis Based on Hero Projections Based on 1 Year Forward EV/EBITDA Multiples | Goldman Sachs Perspective Present Value of Future Stock Price + Dividends at 10.0% Cost of Equity Future Value of Share Price $ 67.71 $ 61.19 $ 58.94 $ 55.38 $ 52.97 $ 50.90 $ 49.87 $ 49.63 $ 48.32 $ 47.68 $ 46.67 $ 52.86 $ 44.91 $ 43.45 $ 42.70 $ 41.95 $ 40.15 $ 47.28 $ 42.35 $ 40.76 $ 39.17 $ 34.65 $ 34.65 $ 37.73 $ 37.55 $ 35.64 Current 1/1/2018 1/1/2019 1/1/2020 1/1/2021 Current 1/1/2018 1/1/2019 1/1/2020 1/1/2021 7.5x Forward EV/EBITDA 8.3x Forward EV/EBITDA 9.5x Forward EV/EBITDA Balance Sheet at 8.3x EV / EBITDA Jan-2018E Jan-2019E Jan-2020E Jan-2021E 1-Yr Forward EBITDA $ 324 $ 354 $ 385 $ 417 Net Debt $ 415 $ 400 $ 371 $ 320 Diluted Shares Outstanding (mm) 53.4 53.4 53.4 53.4 $ 1.40 $ 1.40 $ 1.40 $ 1.40 Dividends Per Share 27 Source: Hero Projections. Note:Present Value of Future Stock Price includes dividends discounted based on mid-year convention. Future share prices and dividends discounted to January 1, 2017.
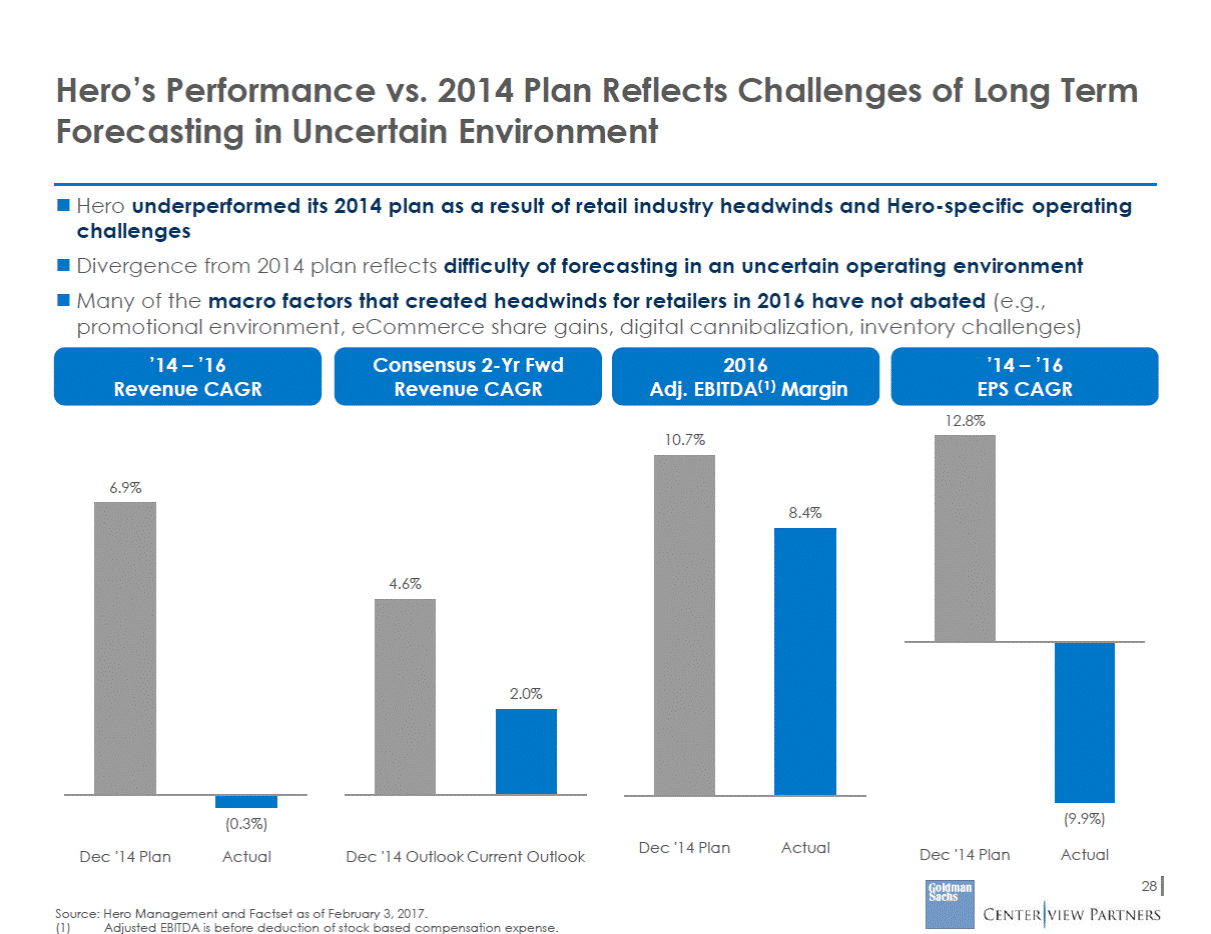
Hero’s Performance vs. 2014 Plan Reflects Challenges of Long Term Forecasting in Uncertain Environment Hero underperformed its 2014 plan as a result of retail industry headwinds and Hero-specific operating challenges Divergence from 2014 plan reflects difficulty of forecasting in an uncertain operating environment Many of the macro factors that created headwinds for retailers in 2016 have not abated (e.g., promotional environment, eCommerce share gains, digital cannibalization, inventory challenges) ’14 – ’16 Revenue CAGR Consensus 2-Yr Fwd Revenue CAGR 2016 Adj. EBITDA(1) Margin ’14 – ’16 EPS CAGR 12.8% 10.7% 6.9% 4.6% (9.9%) (0.3%) Dec '14 Plan Actual Dec '14 Plan Actual Dec '14 Plan Actual Dec '14 Outlook Current Outlook 28 Source: Hero Management and Factset as of February 3, 2017. (1) Adjusted EBITDA is before deduction of stock based compensation expense. 2.0% 8.4%
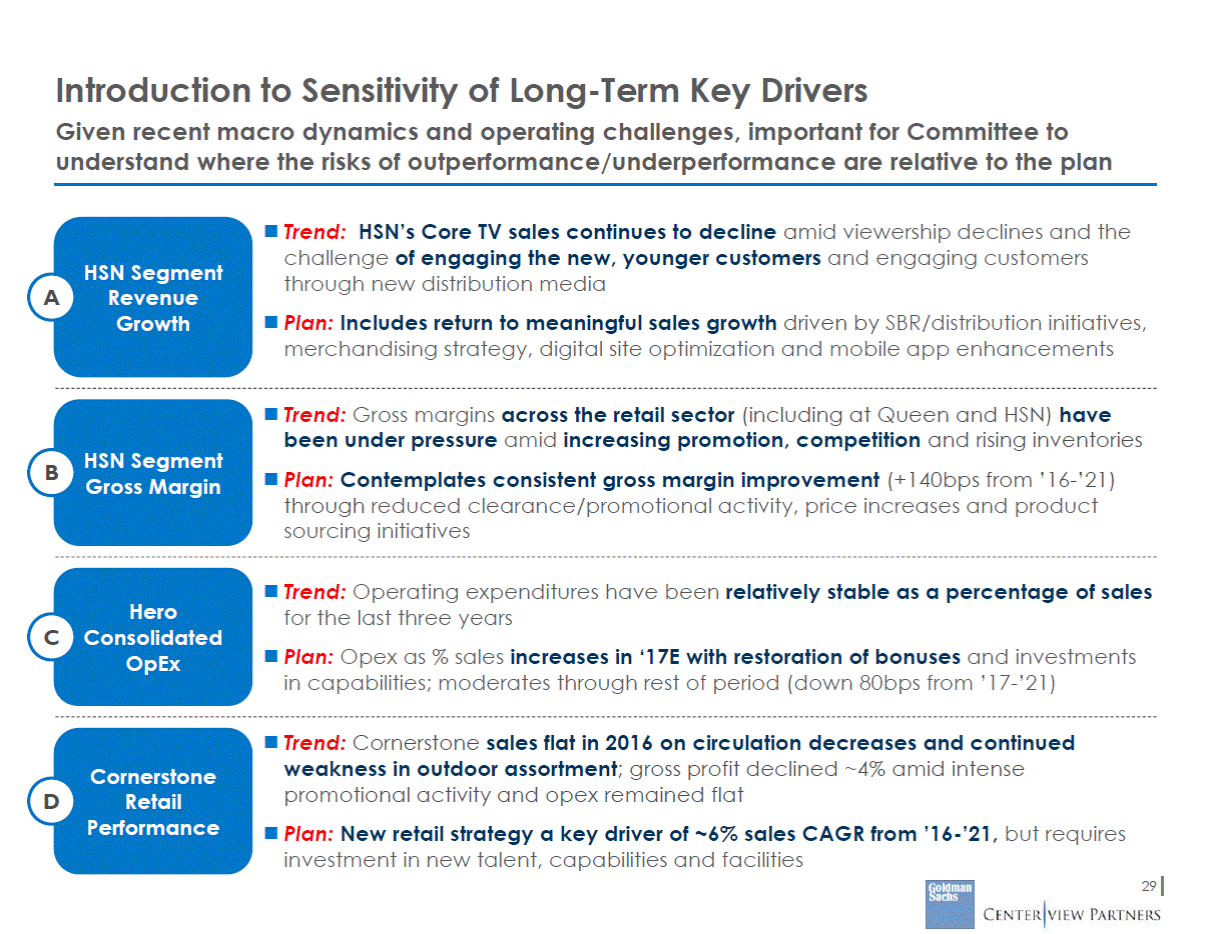
Introduction to Sensitivity of Long-Term Key Drivers Given recent macro dynamics and operating challenges, important for Committee to understand where the risks of outperformance/underperformance are relative to the plan Trend: HSN’s Core TV sales continues to decline amid viewership declines and the challenge of engaging the new, younger customers and engaging customers through new distribution media Plan: Includes return to meaningful sales growth driven by SBR/distribution initiatives, merchandising strategy, digital site optimization and mobile app enhancements HSN Segment Revenue Growth A Trend: Gross margins across the retail sector (including at Queen and HSN) have been under pressure amid increasing promotion, competition and rising inventories Plan: Contemplates consistent gross margin improvement (+140bps from ’16-’21) through reduced clearance/promotional activity, price increases and product sourcing initiatives HSN Segment Gross Margin B Trend: Operating expenditures have been relatively stable as a percentage of sales for the last three years Plan: Opex as % sales increases in ‘17E with restoration of bonuses and investments in capabilities; moderates through rest of period (down 80bps from ’17-’21) Hero Consolidated OpEx C Trend: Cornerstone sales flat in 2016 on circulation decreases and continued weakness in outdoor assortment; gross profit declined ~4% amid intense promotional activity and opex remained flat Plan: New retail strategy a key driver of ~6% sales CAGR from ’16-’21, but requires investment in new talent, capabilities and facilities Cornerstone Retail Performance D 29
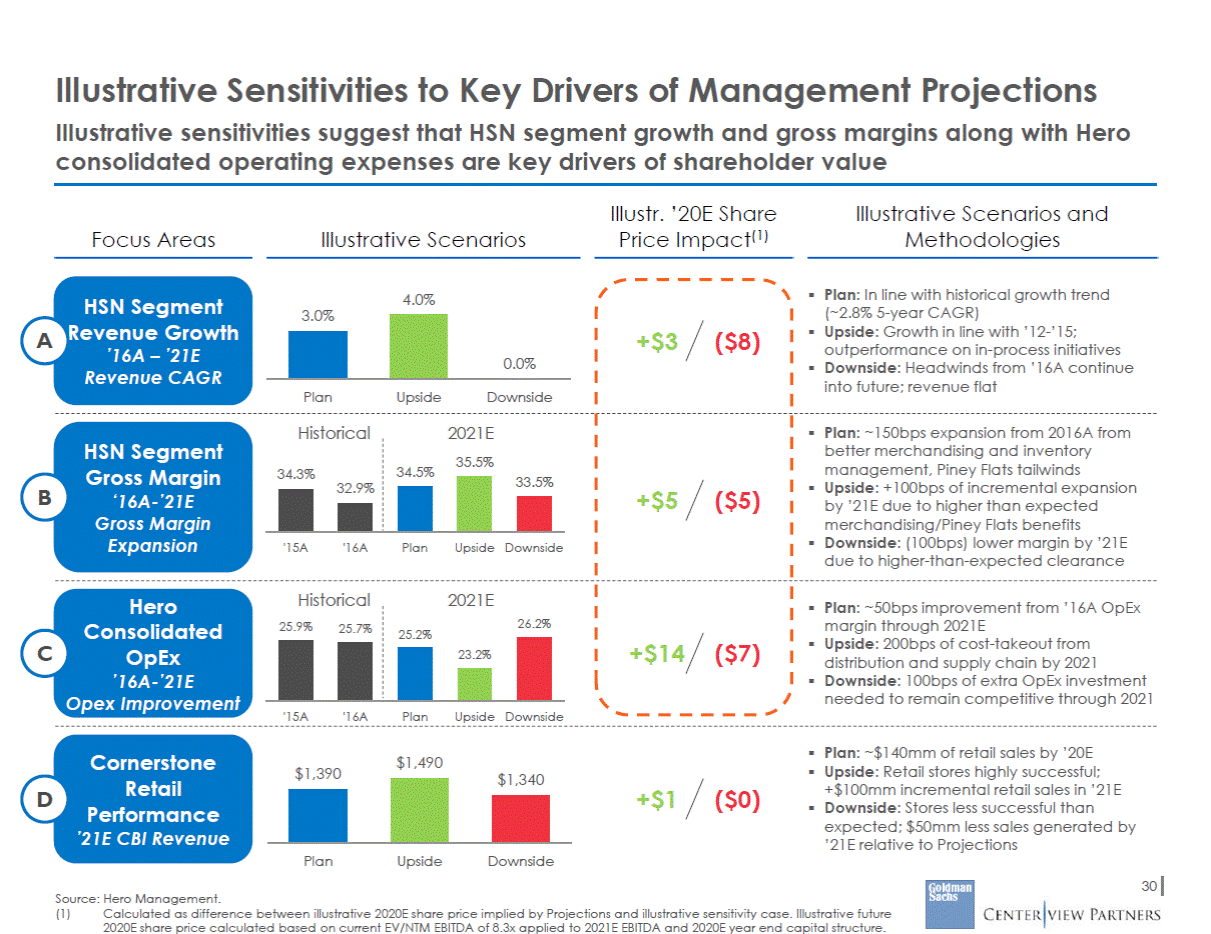
Illustrative Sensitivities to Key Drivers of Management Projections Illustrative sensitivities suggest that HSN segment growth and gross margins along with Hero consolidated operating expenses are key drivers of shareholder value Illustr. ’20E Share Price Impact(1) Illustrative Scenarios and Methodologies Focus Areas Illustrative Scenarios Plan: In line with historical growth trend (~2.8% 5-year CAGR) Upside: Growth in line with ’12-’15; outperformance on in-process initiatives Downside: Headwinds from ’16A continue into future; revenue flat 4.0% HSN Segment Revenue Growth ’16A – ’21E Revenue CAGR 3.0% +$3 ($8) A Plan Upside Downside Historical 2021E 35.5% Plan: ~150bps expansion from 2016A from better merchandising and inventory management, Piney Flats tailwinds Upside: +100bps of incremental expansion by ’21E due to higher than expected merchandising/Piney Flats benefits Downside: (100bps) lower margin by ’21E due to higher-than-expected clearance HSN Segment Gross Margin ‘16A-’21E Gross Margin Expansion 34.5% 34.3% 32.9% B +$5 ($5) '15A '16A Plan Upside Downside Historical 2021E Hero Consolidated OpEx ’16A-’21E Opex Improvement Plan: ~50bps improvement from ’16A OpEx margin through 2021E Upside: 200bps of cost-takeout from distribution and supply chain by 2021 Downside: 100bps of extra OpEx investment needed to remain competitive through 2021 26.2% 25.9% 25.7% 25.2% +$14 ($7) C '15A '16A Plan Upside Downside Plan: ~$140mm of retail sales by ’20E Upside: Retail stores highly successful; +$100mm incremental retail sales in ’21E Downside: Stores less successful than expected; $50mm less sales generated by ’21E relative to Projections Cornerstone Retail Performance ’21E CBI Revenue $1,490 $1,390 $1,340 +$1 ($0) D Plan Upside Downside 30 Source: Hero Management. (1) Calculated as difference between illustrative 2020E share price implied by Projections and illustrative sensitivity case. Illustrative future 2020E share price calculated based on current EV/NTM EBITDA of 8.3x applied to 2021E EBITDA and 2020E year end capital structure. 23.2% 33.5% 0.0%
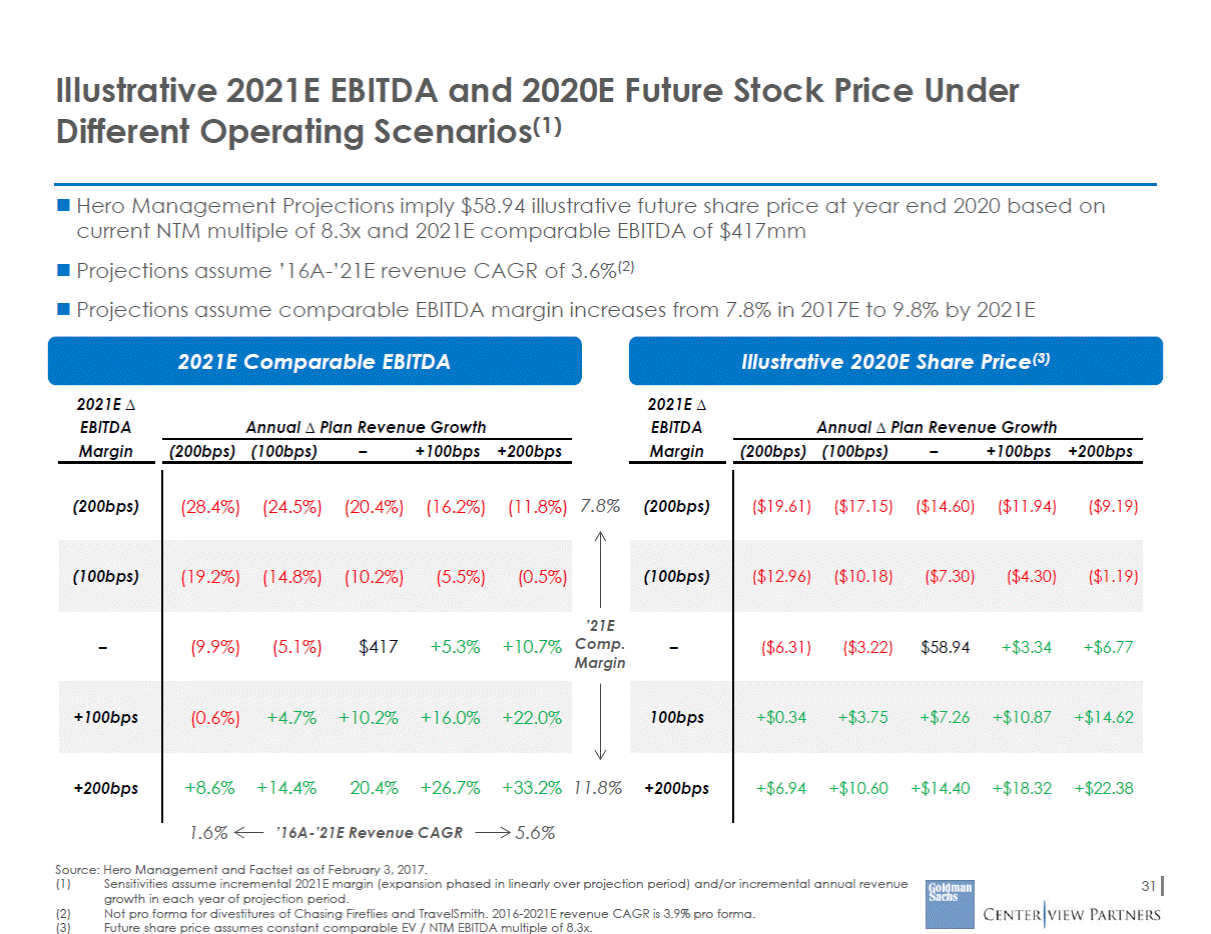
Illustrative 2021E EBITDA and 2020E Future Stock Price Under Different Operating Scenarios(1) Hero Management Projections imply $58.94 illustrative future share price at year end 2020 based on current NTM multiple of 8.3x and 2021E comparable EBITDA of $417mm Projections assume ’16A-’21E revenue CAGR of 3.6%(2) Projections assume comparable EBITDA margin increases from 7.8% in 2017E to 9.8% by 2021E 2021E Comparable EBITDA Illustrative 2020E Share Price(3) 2021E EBITDA Margin 2021E EBITDA Margin Annual Plan Revenue Growth Annual Plan Revenue Growth (200bps) (100bps) – +100bps +200bps (200bps) (100bps) – +100bps +200bps 7.8% ’21E Comp. Margin 11.8% 1.6% ’16A-’21E Revenue CAGR 5.6% Source: Hero Management and Factset as of February 3, 2017. (1) Sensitivities assume incremental 2021E margin (expansion phased in linearly over projection period) and/or incremental annual revenue growth in each year of projection period. Not pro forma for divestitures of Chasing Fireflies and TravelSmith. 2016-2021E revenue CAGR is 3.9% pro forma. Future share price assumes constant comparable EV / NTM EBITDA multiple of 8.3x. 31 (2) (3) (200bps) ($19.61)($17.15)($14.60)($11.94)($9.19) (100bps) ($12.96)($10.18)($7.30)($4.30)($1.19) – ($6.31)($3.22)$58.94+$3.34+$6.77 100bps +$0.34+$3.75+$7.26+$10.87+$14.62 +200bps +$6.94+$10.60+$14.40+$18.32+$22.38 (200bps) (28.4%) (24.5%) (20.4%) (16.2%) (11.8%) (100bps) (19.2%) (14.8%) (10.2%) (5.5%) (0.5%) – (9.9%) (5.1%) $417 +5.3% +10.7% +100bps (0.6%) +4.7% +10.2% +16.0% +22.0% +200bps +8.6% +14.4% 20.4% +26.7% +33.2%
V. Queen Situation Update
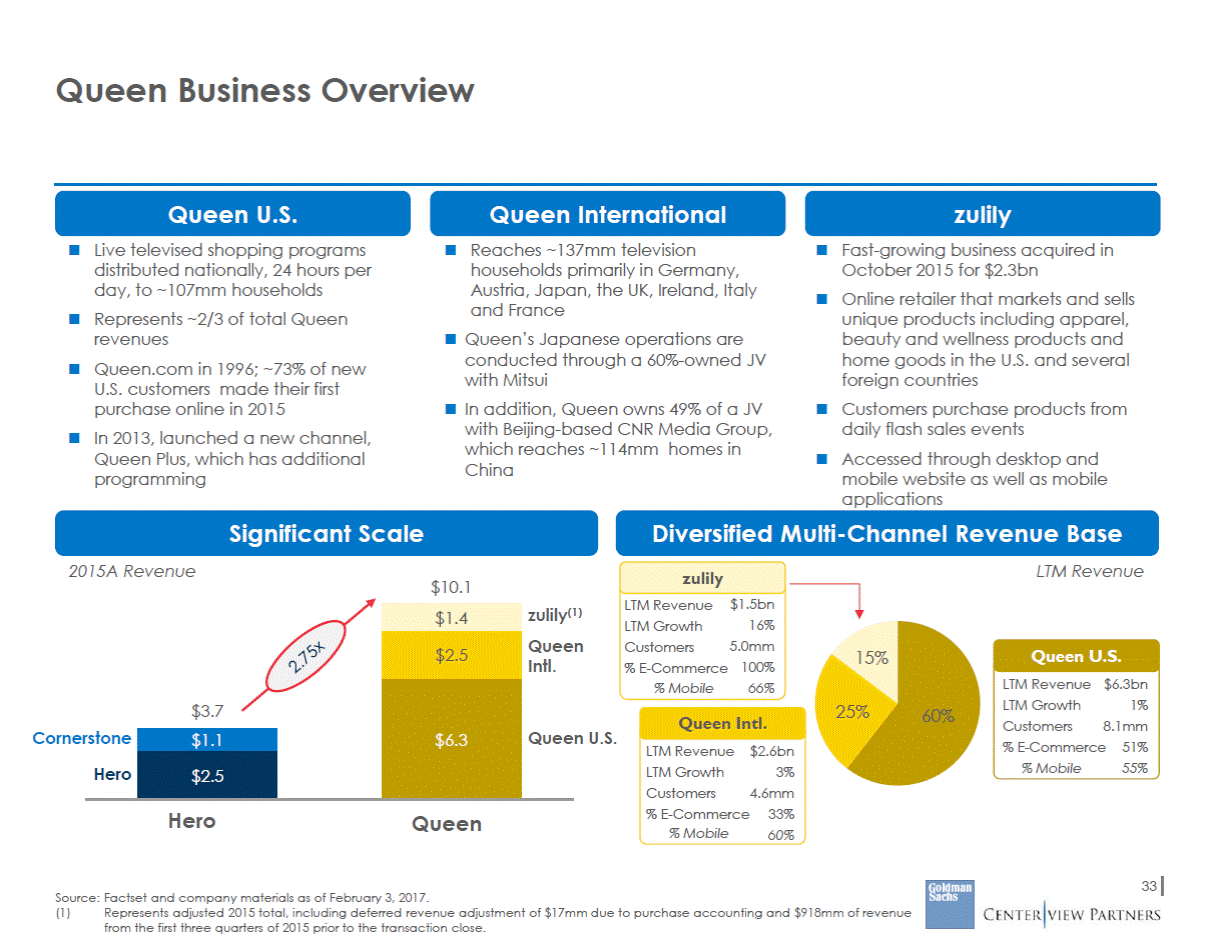
Queen Business Overview Queen U.S. Live televised shopping programs distributed nationally, 24 hours per day, to ~107mm households Represents ~2/3 of total Queen revenues Queen.com in 1996; ~73% of new U.S. customers made their first purchase online in 2015 In 2013, launched a new channel, Queen Plus, which has additional programming Queen International Reaches ~137mm television households primarily in Germany, Austria, Japan, the UK, Ireland, Italy and France Queen’s Japanese operations are conducted through a 60%-owned JV with Mitsui In addition, Queen owns 49% of a JV with Beijing-based CNR Media Group, which reaches ~114mm homes in China zulily Fast-growing business acquired in October 2015 for $2.3bn Online retailer that markets and sells unique products including apparel, beauty and wellness products and home goods in the U.S. and several foreign countries Customers purchase products from daily flash sales events Accessed through desktop and mobile website as well as mobile applications Significant Scale Diversified Multi-Channel Revenue Base 2015A Revenue LTM Revenue zulily LTM Revenue LTM Growth Customers % E-Commerce % Mobile $10.1 $1.5bn 16% 5.0mm 100% 66% (1) n Queen U.S. 15% LTM Revenue LTM Growth Customers $6.3bn 1% 8.1mm 25% 60% Queen Intl. Cornerstone n U.S. % E-Commerce51% LTM Revenue LTM Growth Customers $2.6bn 3% 4.6mm % Mobile 55% % E-Commerce % Mobile 33% 60% Hero Queen 33 Source: Factset and company materials as of February 3, 2017. (1) Represents adjusted 2015 total, including deferred revenue adjustment of $17mm due to purchase accounting and $918mm of revenue from the first three quarters of 2015 prior to the transaction close. $3.7 $1.4 zulily Quee Intl. Quee $2.5 $6.3 Hero $1.1 $2.5
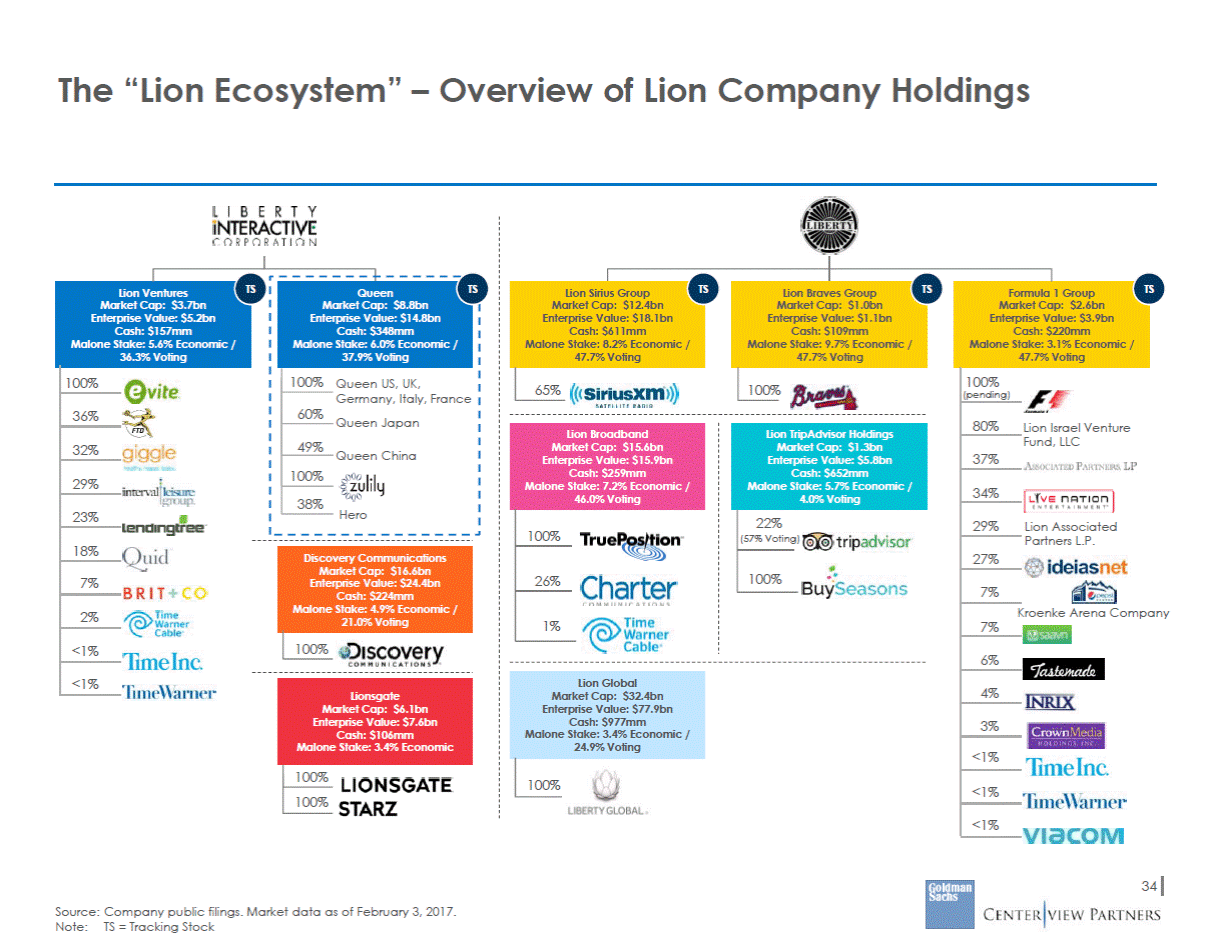
The “Lion Ecosystem” – Overview of Lion Company Holdings 65% 100% Market Cap: $1.3bn Malone Stake: 5.7% Economic / Hero ng) Market Cap: $16.6bn Cash: $224mm Kroenke Arena Company 100% Cash: $106mm 34 Source: Company public filings. Market data as of February 3, 2017. Note:TS = Tracking Stock 100% 100% Lionsgate Market Cap: $6.1bn Enterprise Value: $7.6bn Malone Stake: 3.4% Economic Lion Global Market Cap: $32.4bn Enterprise Value: $77.9bn Cash: $977mm Malone Stake: 3.4% Economic / 24.9% Voting 100% Discovery Communications Enterprise Value: $24.4bn Malone Stake: 4.9% Economic / 21.0% Voting Lion TripAdvisor Holdings Enterprise Value: $5.8bn Cash: $652mm 4.0% Voting 22% (57% Voti 100% Lion Broadband Market Cap: $15.6bn Enterprise Value: $15.9bn Cash: $259mm Malone Stake: 7.2% Economic / 46.0% Voting 100% 26% 1% Lion Ventures Market Cap: $3.7bn Enterprise Value: $5.2bn Cash: $157mm Malone Stake: 5.6% Economic / 36.3% Voting 100% 36% 32% 29% 23% 18% 7% 2% <1% <1% Lion Braves Group Market Cap: $1.0bn Enterprise Value: $1.1bn Cash: $109mm Malone Stake: 9.7% Economic / 47.7% Voting Lion Sirius Group Market Cap: $12.4bn Enterprise Value: $18.1bn Cash: $611mm Malone Stake: 8.2% Economic / 47.7% Voting Formula 1 Group Market Cap: $2.6bn Enterprise Value: $3.9bn Cash: $220mm Malone Stake: 3.1% Economic / 47.7% Voting 100% (pending) Lion Israel Venture Fund, LLC Lion Associated Partners L.P. 80% 37% 34% 29% 27% 7% 7% 6% 4% 3% <1% <1% <1% Queen Market Cap: $8.8bn Enterprise Value: $14.8bn Cash: $348mm Malone Stake: 6.0% Economic / 37.9% Voting 100% Queen US, UK, Germany, Italy, France Queen Japan Queen China 60% 49% 100% 38%
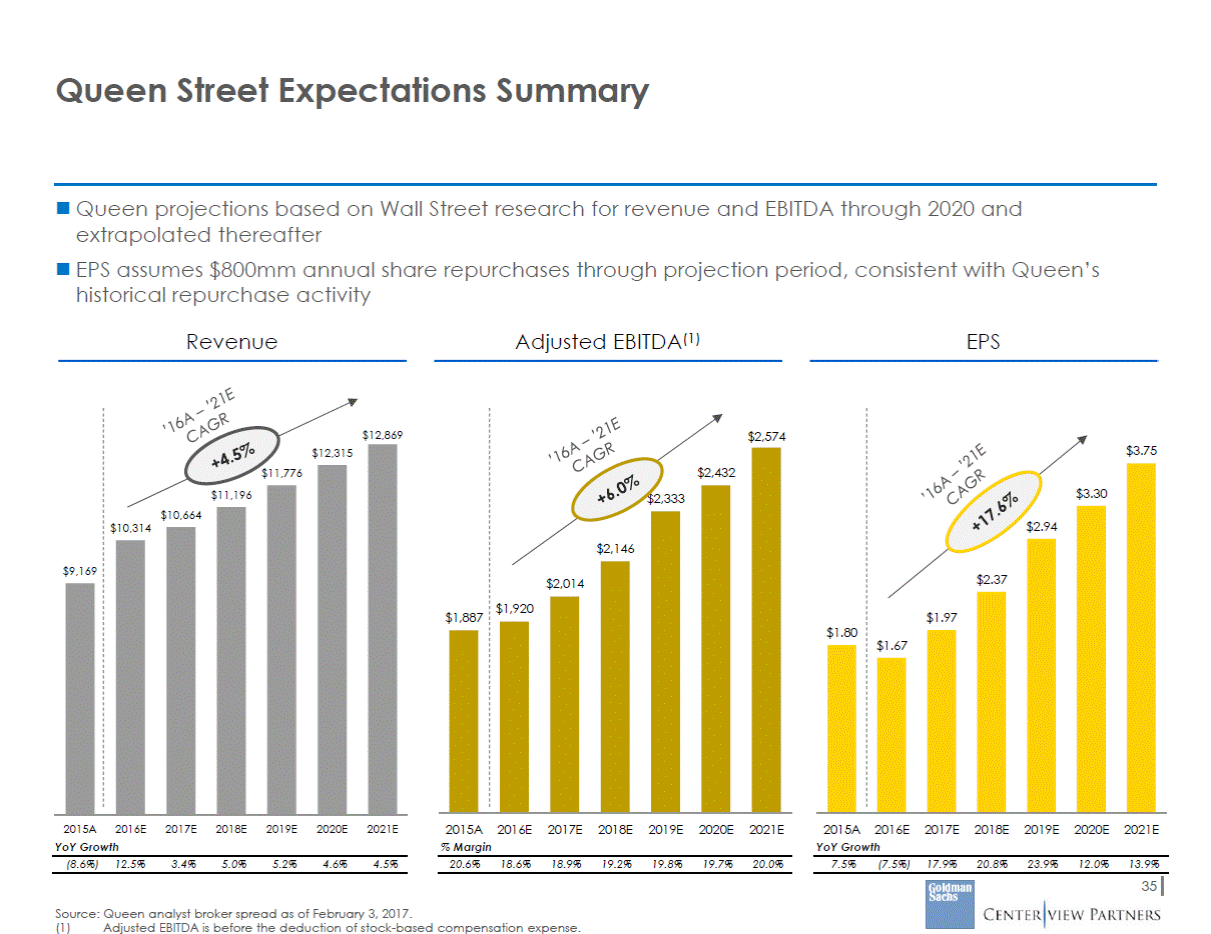
Queen Street Expectations Summary Queen projections based on Wall Street research for revenue and EBITDA through 2020 and extrapolated thereafter EPS assumes $800mm annual share repurchases through projection period, consistent with Queen’s historical repurchase activity Revenue Adjusted EBITDA(1) EPS $12,869 $2,574 $3.75 $10,314 $1.67 2015A 2016E YoY Growth 2017E 2018E 2019E 2020E 2021E 2015A 2016E % Margin 2017E 2018E 2019E 2020E 2021E 2015A 2016E 2017E 2018E YoY Growth 2019E 2020E 2021E (8.6%) 12.5% 3.4% 5.0% 5.2% 4.6% 4.5% 20.6% 18.6% 18.9% 19.2% 19.8% 19.7% 20.0% 7.5% (7.5%) 17.9% 20.8% 23.9% 12.0% 13.9% Source: Queen analyst broker spread as of February 3, 2017. (1) Adjusted EBITDA is before the deduction of stock-based compensation expense. 35 $3.30 $2.94 $2.37 $1.97 $1.80 $2,432 $2,333 $2,146 $2,014 $1,920 $1,887 $12,315 $11,776 $11,196 $10,664 $9,169
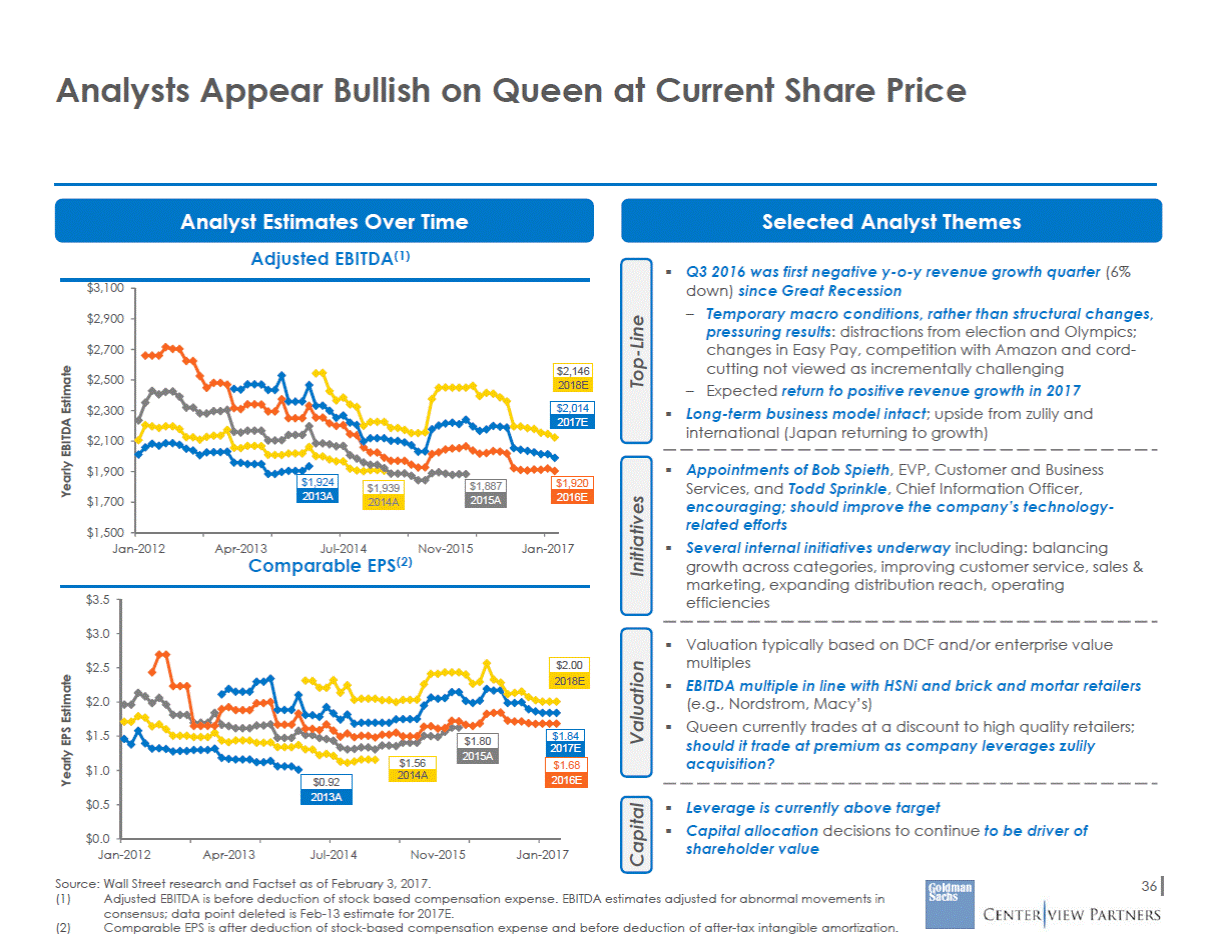
Analysts Appear Bullish on Queen at Current Share Price Analyst Estimates Over Time Adjusted EBITDA(1) Selected Analyst Themes Q3 2016 was first negative y-o-y revenue growth quarter (6% down) since Great Recession $3,100 – Temporary macro conditions, rather than structural changes, pressuring results: distractions from election and Olympics; changes in Easy Pay, competition with Amazon and cord-cutting not viewed as incrementally challenging Expected return to positive revenue growth in 2017 $2,900 $2,700 $2,500 – $2,300 Long-term business model intact; upside from zulily and international (Japan returning to growth) $2,100 Appointments of Bob Spieth, EVP, Customer and Business Services, and Todd Sprinkle, Chief Information Officer, encouraging; should improve the company’s technology-related efforts Several internal initiatives underway including: balancing growth across categories, improving customer service, sales & marketing, expanding distribution reach, operating efficiencies $1,900 $1,700 $1,500 Jan-2012 Apr-2013 Jul-2014 Nov-2015 Jan-2017 Comparable EPS(2) $3.5 $3.0 Valuation typically based on DCF and/or enterprise value multiples EBITDA multiple in line with HSNi and brick and mortar retailers (e.g., Nordstrom, Macy’s) Queen currently trades at a discount to high quality retailers; should it trade at premium as company leverages zulily acquisition? $2.5 $2.0 $1.5 $1.0 $0.5 Leverage is currently above target Capital allocation decisions to continue to be driver of shareholder value $0.0 Jan-2012 Apr-2013 Jul-2014 Nov-2015 Jan-2017 Source: Wall Street research and Factset as of February 3, 2017. 36 (1) Adjusted EBITDA is before deduction of stock based compensation expense. EBITDA estimates adjusted for abnormal movements in consensus; data point deleted is Feb-13 estimate for 2017E. Comparable EPS is after deduction of stock-based compensation expense and before deduction of after-tax intangible amortization. (2) Yearly EPS Estimate Yearly EBITDA Estimate Capital Valuation Initiatives Top-Line $1.84 17E $1.68 2016E 2.00 2018E $ 20 $0.92 2013A $1.56 2014A $1.80 2015A $1,920 2016E $2,014 2017E $2,146 2018E $1,887 2015A $1,939 2014A $1,924 2013A
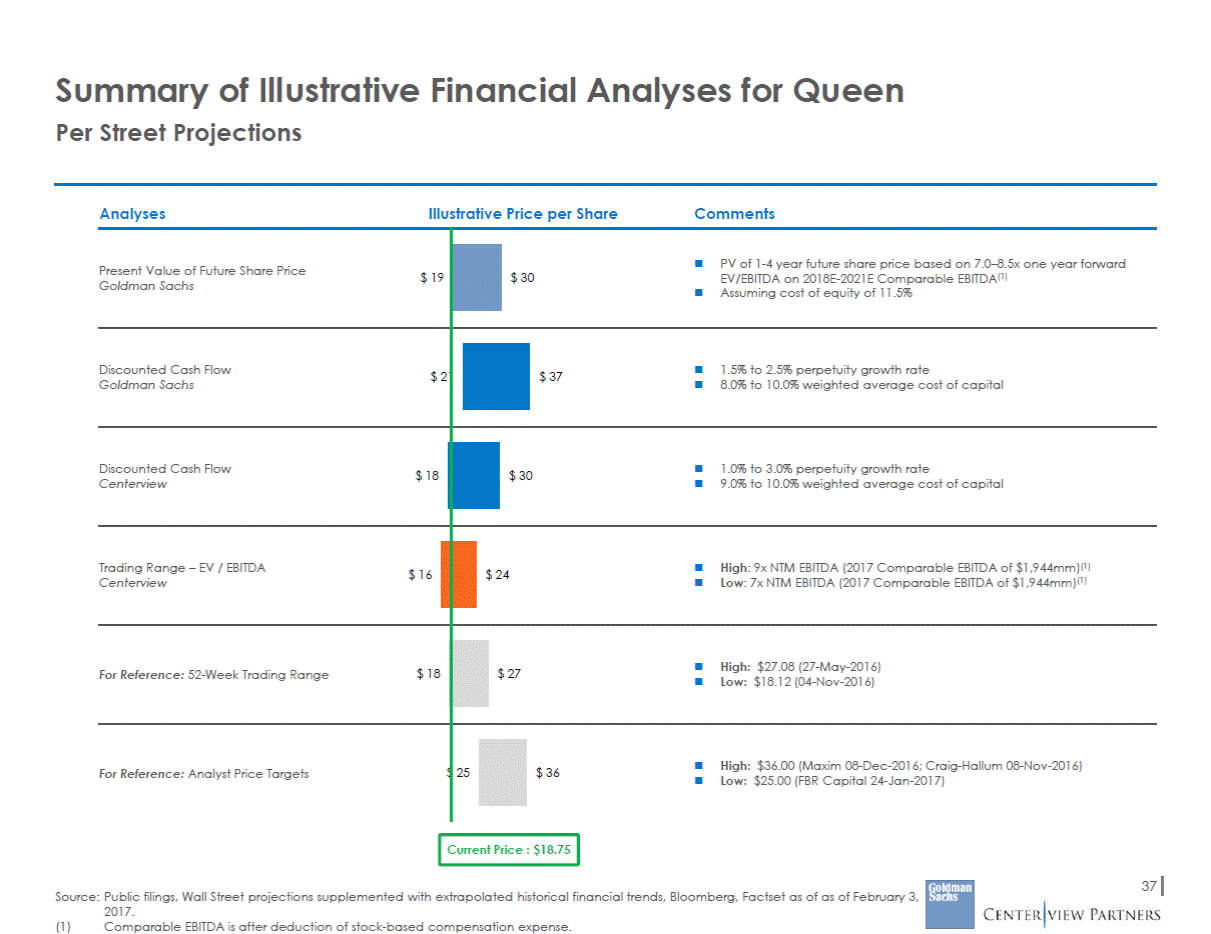
Summary of Illustrative Per Street Projections Financial Analyses for Queen Analyses Illustrative Price per Share Comments $ 30 EV/EBITDA on 2018E-2021E Comparable EBITDA(1) 1.5% to 2.5% perpetuity growth rate 21 $ 37 9.0% to 10.0% weighted average cost of capital Low: 7x NTM EBITDA (2017 Comparable EBITDA of $1,944mm)(1) Low: $18.12 (04-Nov-2016) Low: $25.00 (FBR Capital 24-Jan-2017) Current Price : $18.75 37 Source: Public filings, Wall Street projections supplemented with extrapolated historical financial trends, Bloomberg, Factset as of as of February 3, 2017. (1) Comparable EBITDA is after deduction of stock-based compensation expense. Present Value of Future Share Price Goldman Sachs$ 19 PV of 1-4 year future share price based on 7.0–8.5x one year forward Assuming cost of equity of 11.5% Discounted Cash Flow$ Goldman Sachs 8.0% to 10.0% weighted average cost of capital Discounted Cash Flow$ 18 Centerview $ 30 1.0% to 3.0% perpetuity growth rate Trading Range – EV / EBITDA$ 16 Centerview $ 24 High: 9x NTM EBITDA (2017 Comparable EBITDA of $1,944mm)(1) For Reference: 52-Week Trading Range$ 18 $ 27 High: $27.08 (27-May-2016) For Reference: Analyst Price Targets$ 25$ 36 High: $36.00 (Maxim 08-Dec-2016; Craig-Hallum 08-Nov-2016)
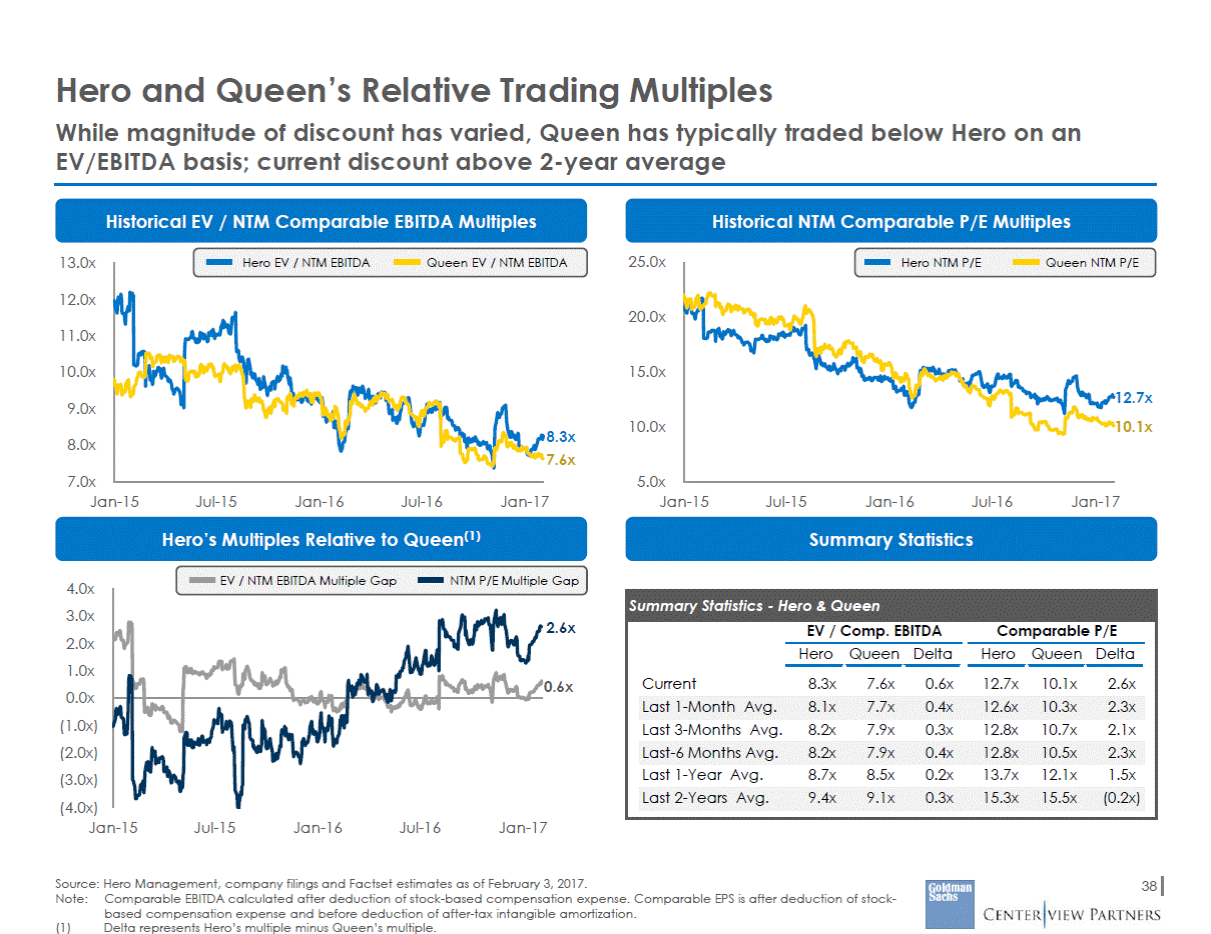
Hero and Queen’s Relative Trading Multiples While magnitude of discount has varied, Queen has typically traded below Hero on an EV/EBITDA basis; current discount above 2-year average Historical EV / NTM Comparable EBITDA Multiples Historical NTM Comparable P/E Multiples 13.0x 25.0x Hero EV / NTM EBITDA Queen EV / NTM EBITDA Hero NTM P/E Queen NTM P/E 12.0x 20.0x 11.0x 10.0x 15.0x 12.7x 10.1x 9.0x 10.0x 8.3x 7.6x 8.0x 5.0x 7.0x Jan-15 Jul-15 Jan-16 Jul-16 Jan-17 Jan-15 Jul-15 Jan-16 Jul-16 Jan-17 Hero’s Multiples Relative to Queen(1) Summary Statistics EV / NTM EBITDA Multiple Gap NTM P/E Multiple Gap 4.0x 3.0x 2.0x 1.0x 0.0x (1.0x) (2.0x) (3.0x) (4.0x) 2.6x 0.6x Jan-15 Jul-15 Jan-16 Jul-16 Jan-17 Source: Hero Management, company filings and Factset estimates as of February 3, 2017. Note:Comparable EBITDA calculated after deduction of stock-based compensation expense. Comparable EPS is after deduction of stock-based compensation expense and before deduction of after-tax intangible amortization. 38 (1) Delta represents Hero’s multiple minus Queen’s multiple. Summary Statistics - Hero & Queen EV / Comp. EBITDA Comparable P/E Hero Queen Delta Hero Queen Delta Current 8.3x 7.6x 0.6x 12.7x 10.1x 2.6x Last 3-Months Avg. 8.2x 7.9x 0.3x 12.8x 10.7x 2.1x Last 1-Year Avg. 8.7x 8.5x 0.2x 13.7x 12.1x 1.5x Last 2-Years Avg. 9.4x 9.1x 0.3x 15.3x 15.5x (0.2x) Last-6 Months Avg. 8.2x 7.9x 0.4x 12.8x 10.5x 2.3x Last 1-Month Avg. 8.1x 7.7x 0.4x 12.6x 10.3x 2.3x
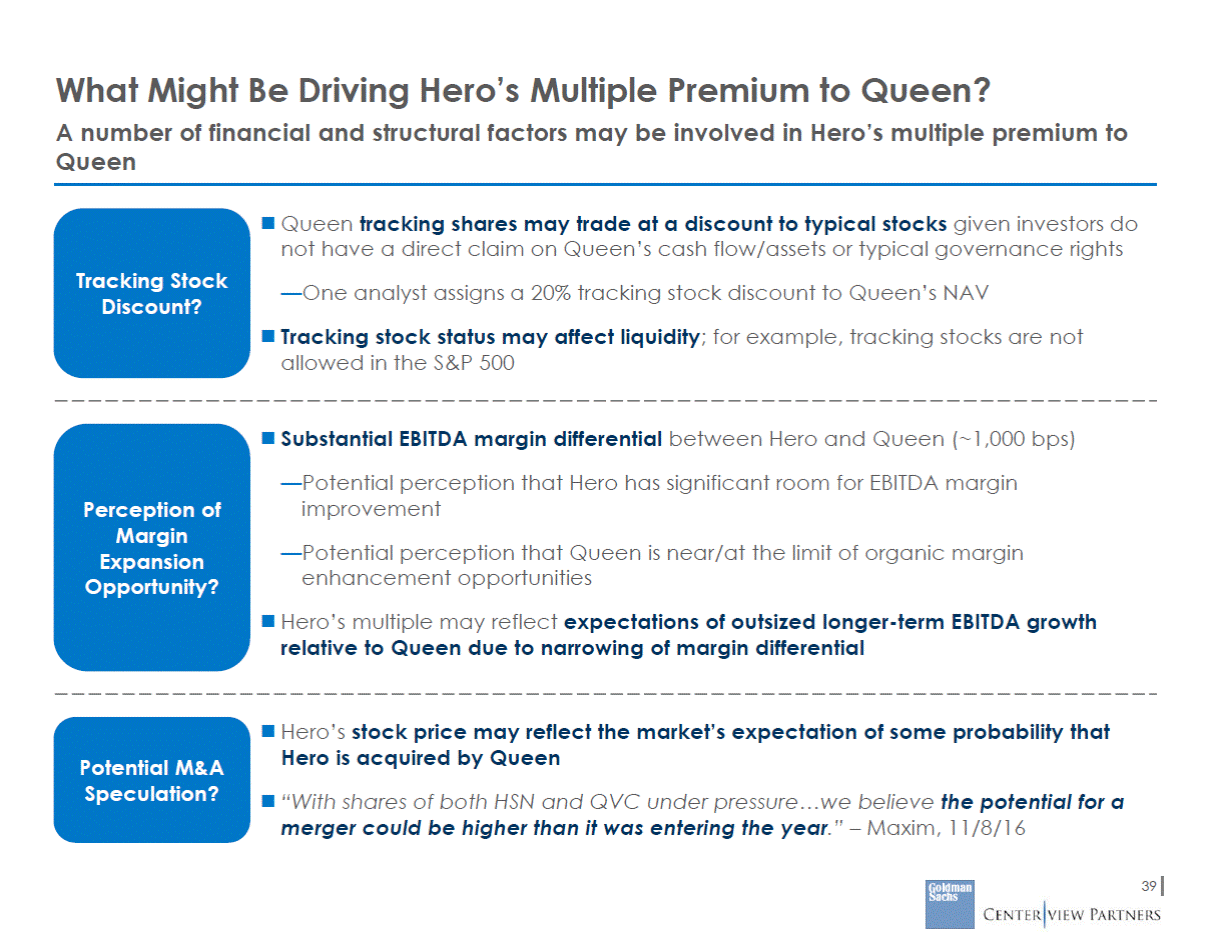
What Might Be Driving Hero’s Multiple Premium to Queen? A number of financial and structural factors may be involved in Hero’s multiple premium to Queen Queen tracking shares may trade at a discount to typical stocks given investors do not have a direct claim on Queen’s cash flow/assets or typical governance rights Tracking Stock Discount? —One analyst assigns a 20% tracking stock discount to Queen’s NAV Tracking stock status may affect liquidity; for example, tracking stocks are not allowed in the S&P 500 Substantial EBITDA margin differential between Hero and Queen (~1,000 bps) —Potential perception that Hero has significant room for EBITDA margin improvement Perception of Margin Expansion Opportunity? —Potential perception that Queen is near/at the limit of organic margin enhancement opportunities Hero’s multiple may reflect expectations of outsized longer-term EBITDA growth relative to Queen due to narrowing of margin differential Hero’s stock price may reflect the market’s expectation of some probability that Hero is acquired by Queen Potential M&A Speculation? “With shares of both HSN and QVC under pressure…we believe the potential for a merger could be higher than it was entering the year.” – Maxim, 11/8/16 39
VI. Evaluation of Combination with Queen
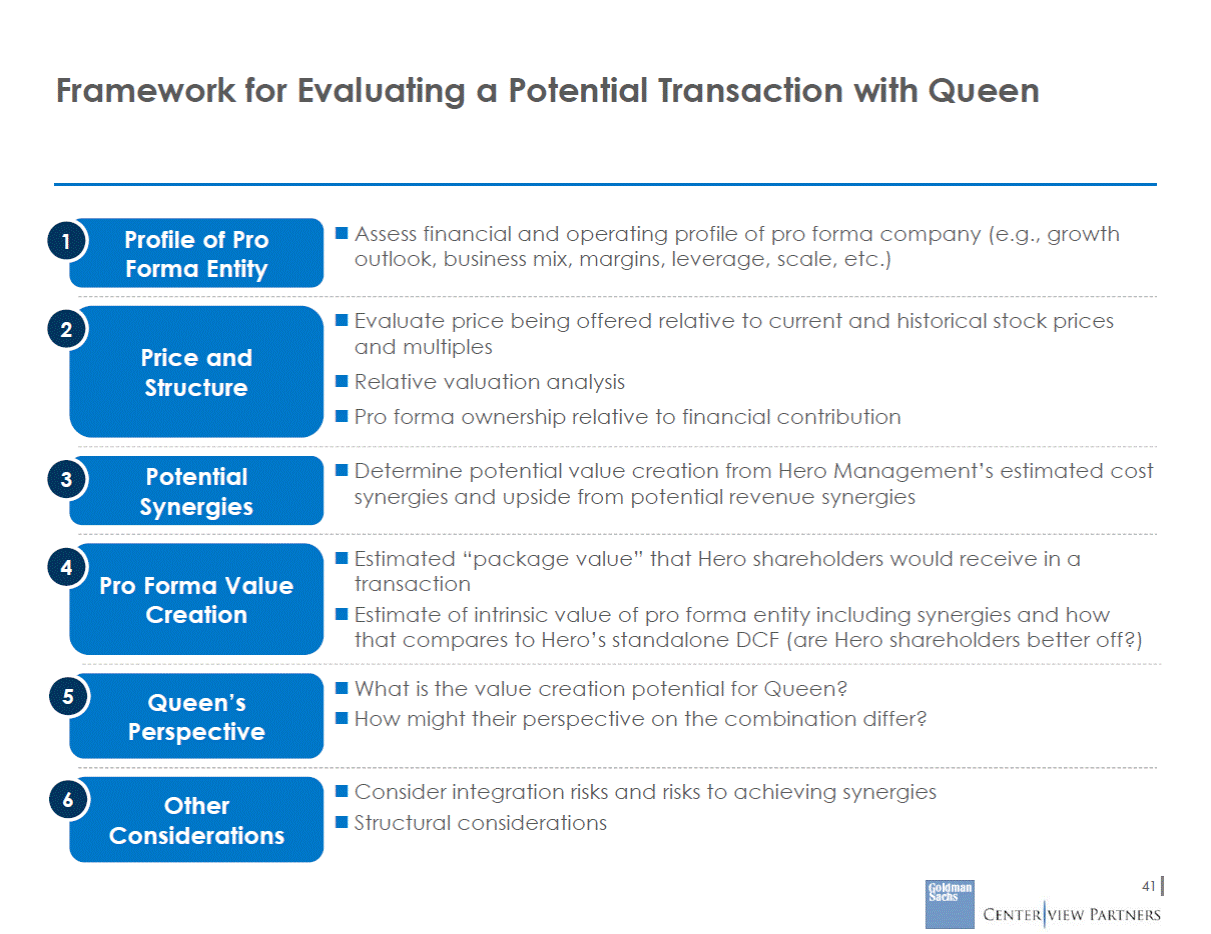
Framework for Evaluating a Potential Transaction with Queen Assess financial and operating profile of pro forma company (e.g., growth outlook, business mix, margins, leverage, scale, etc.) Profile of Pro Forma Entity Evaluate price being offered relative to current and historical stock prices and multiples Relative valuation analysis Pro forma ownership relative to financial contribution Price and Structure Determine potential value creation from Hero Management’s estimated cost synergies and upside from potential revenue synergies Potential Synergies Estimated “package value” that Hero shareholders would receive in a transaction Estimate of intrinsic value of pro forma entity including synergies and how that compares to Hero’s standalone DCF (are Hero shareholders better off?) Pro Forma Value Creation What is the value creation potential for Queen? How might their perspective on the combination differ? Queen’s Perspective Consider integration risks and risks to achieving synergies Structural considerations Other Considerations 41
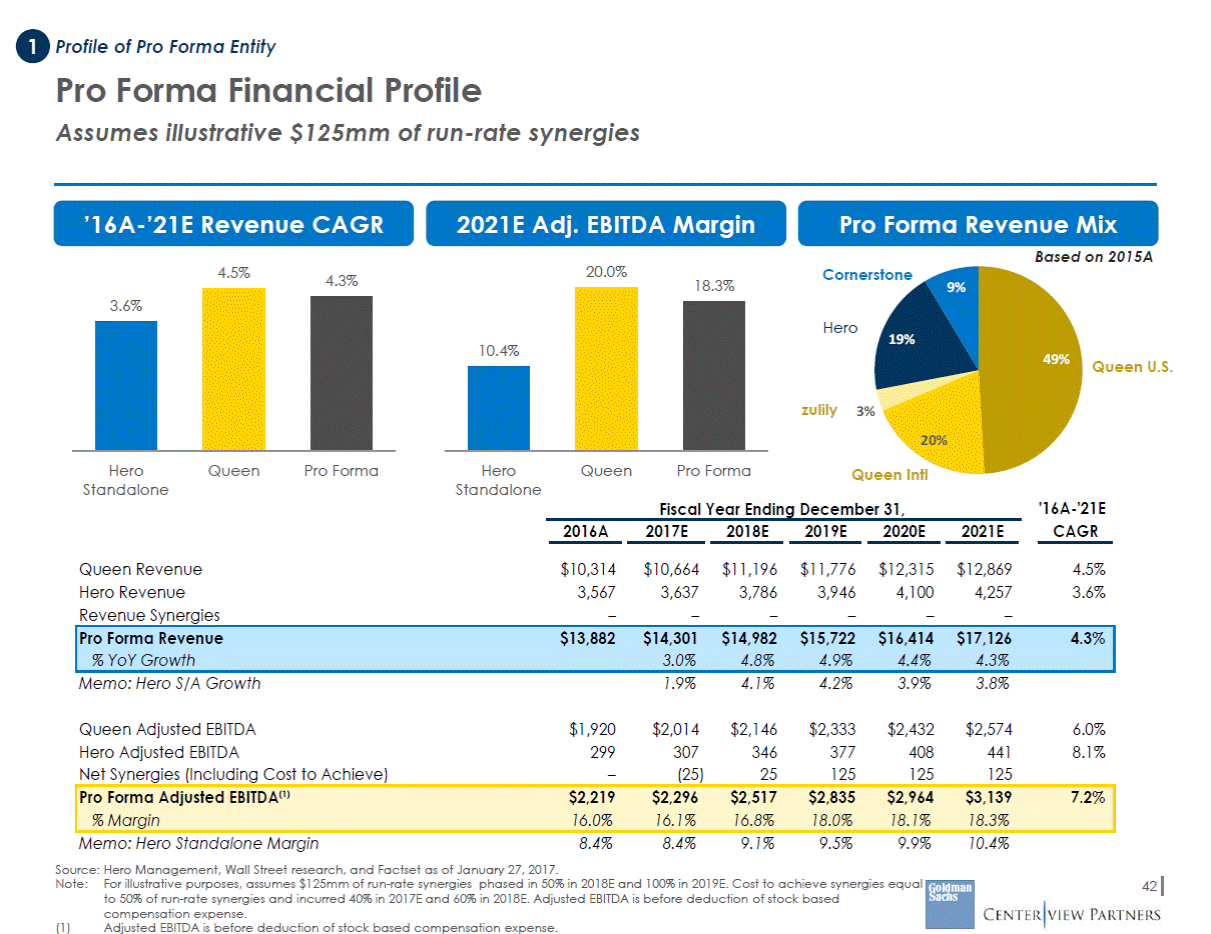
Profile of Pro Forma Entity Pro Forma Financial Profile Assumes illustrative $125mm of run-rate synergies ’16A-’21E Revenue CAGR 2021E Adj. EBITDA Margin Pro Forma Revenue Mix Based on 2015A Cornerstone 20.0% 4.5% 4.3% 18.3% 9% Hero 19% 49% Queen U.S. zulily 3% 20% Hero Standalone Queen Pro Forma Hero Standalone Queen Pro Forma Queen Intl '16A-'21E CAGR Fiscal Year Ending December 31, 2016A 2017E 2018E 2019E 2020E 2021E Queen Revenue Hero Revenue Revenue Synergies $10,314 3,567 – $10,664 3,637 – $11,196 3,786 – $11,776 3,946 – $12,315 4,100 – $12,869 4,257 – 4.5% 3.6% Memo: Hero S/A Growth 1.9% 4.1% 4.2% 3.9% 3.8% Queen Adjusted EBITDA Hero Adjusted EBITDA Net Synergies (Including Cost to Achieve) $1,920 299 – $2,014 307 (25) $2,146 346 25 $2,333 377 125 $2,432 408 125 $2,574 441 125 6.0% 8.1% Memo: Hero Standalone Margin Source: Hero Management, Wall Street research, and Factset as of January 27, 2017. 8.4% 8.4% 9.1% 9.5% 9.9% 10.4% Note:For illustrative purposes, assumes $125mm of run-rate synergies phased in 50% in 2018E and 100% in 2019E. Cost to achieve synergies equal to 50% of run-rate synergies and incurred 40% in 2017E and 60% in 2018E. Adjusted EBITDA is before deduction of stock based compensation expense. 42 (1) Adjusted EBITDA is before deduction of stock based compensation expense. Pro Forma Adjusted EBITDA(1)$2,219$2,296$2,517$2,835$2,964$3,1397.2% % Margin16.0%16.1%16.8%18.0%18.1%18.3% Pro Forma Revenue$13,882$14,301$14,982$15,722$16,414$17,1264.3% % YoY Growth3.0%4.8%4.9%4.4%4.3% 10.4% 3.6%
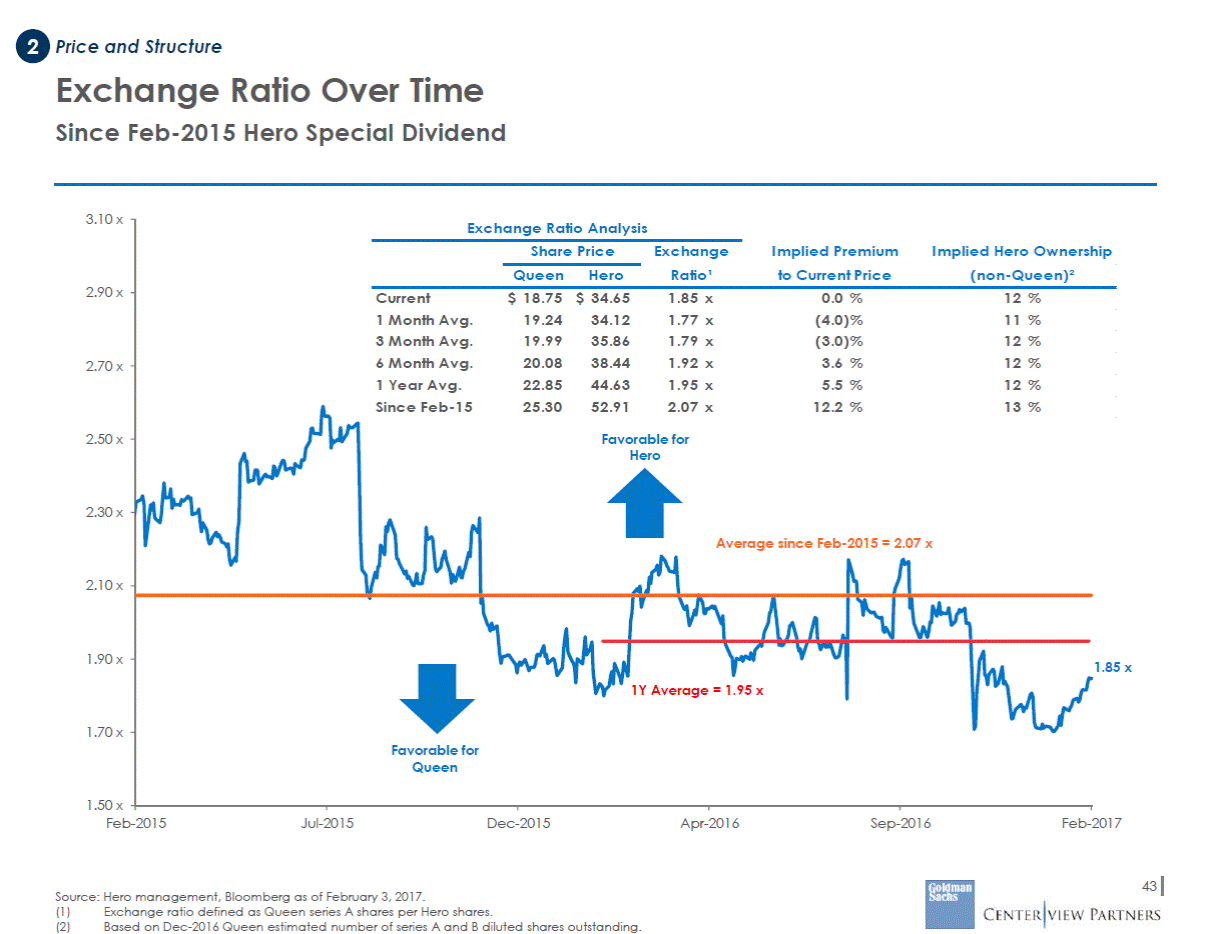
Price and Structure Exchange Ratio Over Time Since Feb-2015 Hero Special Dividend 3.10 x hip 2.90 x 2.70 x 2.50 x 2.30 x 2.10 x 1.90 x 1.85 x 1.70 x 1.50 x Feb-2015 Jul-2015 Dec-2015 Apr-2016 Sep-2016 Feb-2017 43 Source: Hero management, Bloomberg as of February 3, 2017. (1) (2) Exchange ratio defined as Queen series A shares per Hero shares. Based on Dec-2016 Queen estimated number of series A and B diluted shares outstanding. Exchange Ratio Analysis Share Price Exchange Implied Premium Implied Hero Owners Queen Hero Ratio¹ to Current Price (non-Queen)² Current $ 18.75 $ 34.65 1.85 x 0.0 % 12 % 1 Month Avg. 19.24 34.12 1.77 x (4.0)% 11 % 3 Month Avg. 19.99 35.86 1.79 x (3.0)% 12 % 6 Month Avg. 20.08 38.44 1.92 x 3.6 % 12 % 1 Year Avg. 22.85 44.63 1.95 x 5.5 % 12 % Since Feb-15 25.30 52.91 2.07 x 12.2 % 13 % Favorable for Hero Average since Feb-2015 = 2.07 x 1Y Average = 1.95 x Favorable for Queen
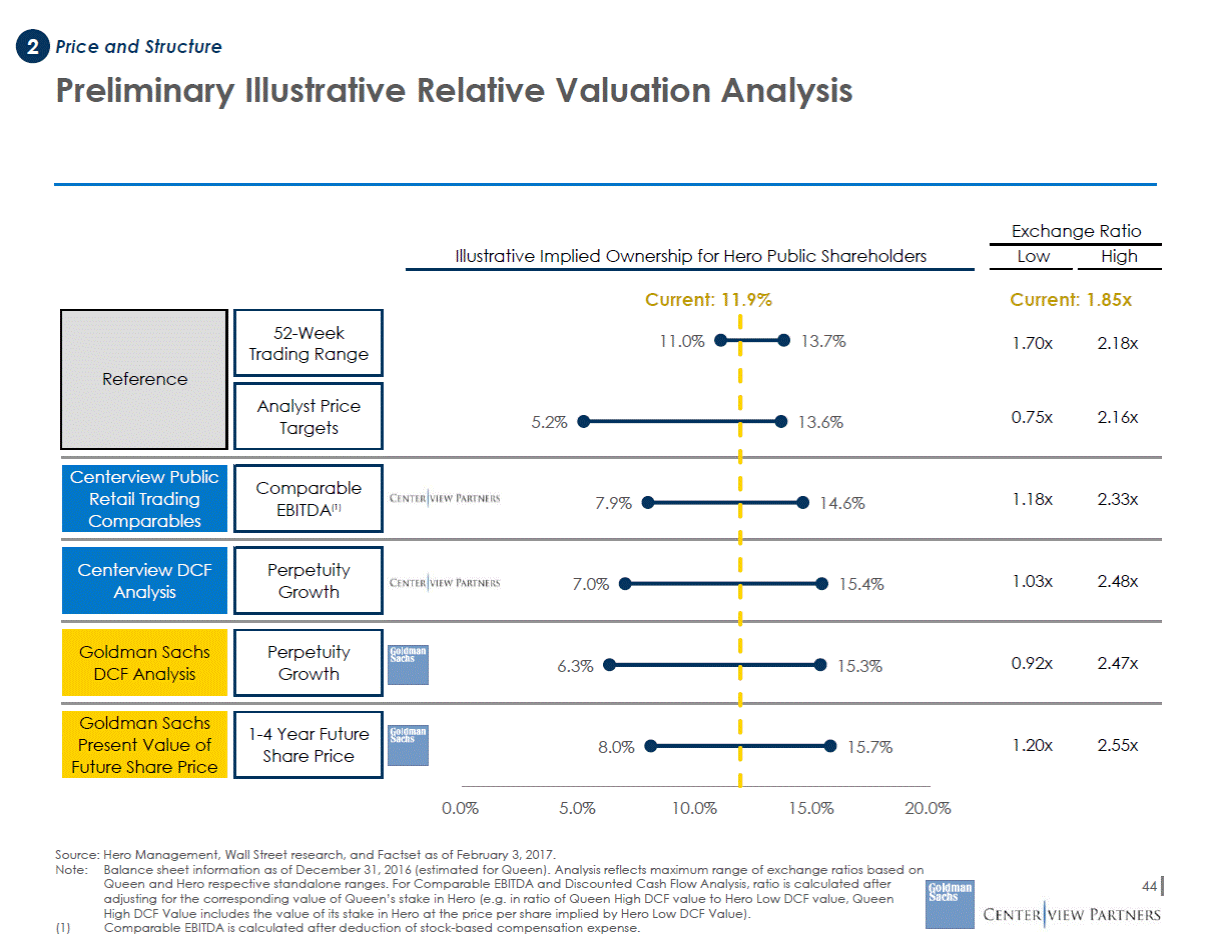
Price and Structure Preliminary Illustrative Relative Valuation Analysis Exchange Ratio Illustrative Implied Ownership for Hero Public Shareholders Low High Current: 11.9% Current: 1.85x 14.6% Comparables 0.0% 5.0% 10.0% 15.0% 20.0% Source: Hero Management, Wall Street research, and Factset as of February 3, 2017. Note:Balance sheet information as of December 31, 2016 (estimated for Queen). Analysis reflects maximum range of exchange ratios based on Queen and Hero respective standalone ranges. For Comparable EBITDA and Discounted Cash Flow Analysis, ratio is calculated after adjusting for the corresponding value of Queen’s stake in Hero (e.g. in ratio of Queen High DCF value to Hero Low DCF value, Queen High DCF Value includes the value of its stake in Hero at the price per share implied by Hero Low DCF Value). 44 (1) Comparable EBITDA is calculated after deduction of stock-based compensation expense. 5.2% 11.0% 13.7%1.70x2.18x 13.6%0.75x2.16x 7.9% 1.18x2.33x 7.0% 15.4%1.03x2.48x 6.3% 15.3%0.92x2.47x Future Share Price 8.0% 15.7% 1.20x2.55x Goldman Sachs Present Value of 1-4 Year Future Share Price Goldman Sachs DCF Analysis Perpetuity Growth Centerview DCF Analysis Perpetuity Growth Centerview Public Retail Trading Comparable EBITDA (1) Analyst Price Targets 52-Week Trading Range Reference
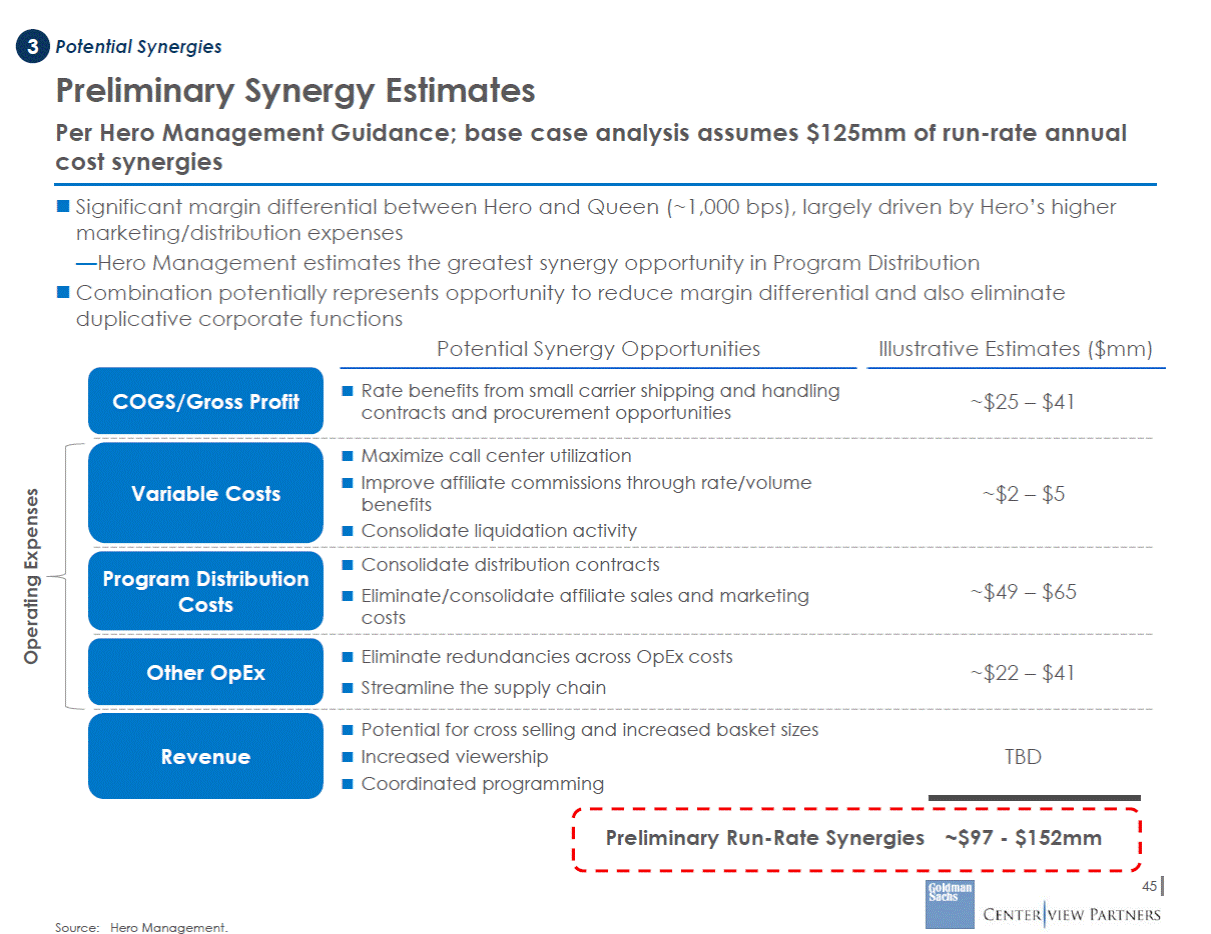
Potential Synergies Preliminary Synergy Estimates Per Hero Management Guidance; base case analysis assumes $125mm of run-rate annual cost synergies Significant margin differential between Hero and Queen (~1,000 bps), largely driven by Hero’s higher marketing/distribution expenses —Hero Management estimates the greatest synergy opportunity in Program Distribution Combination potentially represents opportunity to reduce margin differential and also eliminate duplicative corporate functions Potential Synergy Opportunities Rate benefits from small carrier shipping and handling contracts and procurement opportunities Illustrative Estimates ($mm) COGS/Gross Profit ~$25 – $41 Maximize call center utilization Improve affiliate commissions through rate/volume benefits Consolidate liquidation activity Variable Costs ~$2 – $5 Consolidate distribution contracts Eliminate/consolidate affiliate sales and marketing costs Program Distribution Costs ~$49 – $65 Eliminate redundancies across OpEx costs Streamline the supply chain ~$22 – $41 Other OpEx Potential for cross selling and increased basket sizes Increased viewership Coordinated programming Revenue TBD Preliminary Run-Rate Synergies ~$97 - $152mm 45 Source: Hero Management. Operating Expenses
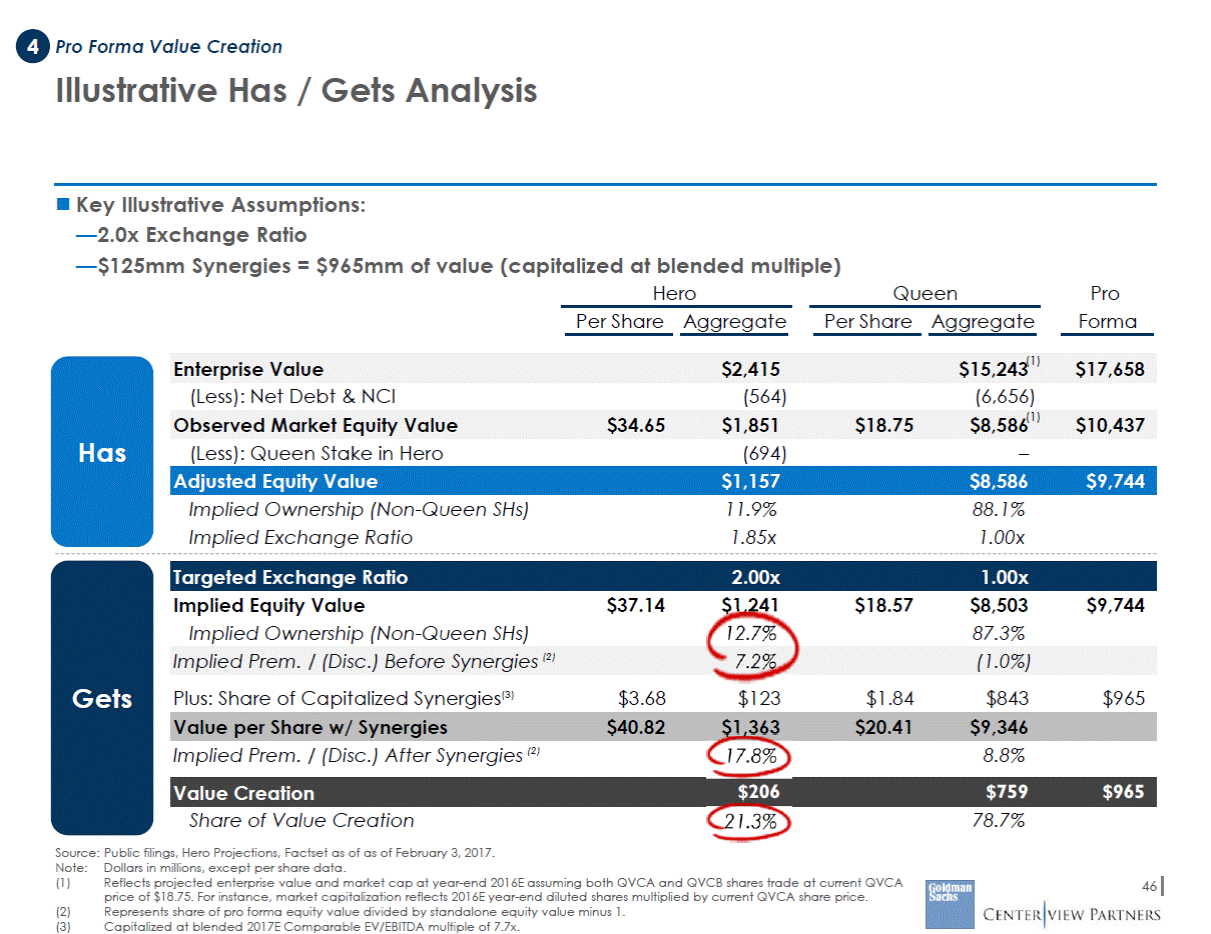
Pro Forma Value Creation Illustrative Has / Gets Analysis Key Illustrative Assumptions: —2.0x Exchange Ratio —$125mm Synergies = $965mm of value (capitalized at blended multiple) Hero Queen Pro Forma Per Share Aggregate Per Share Aggregate (Less): Net Debt & NCI (564) (6,656) Has (Less): Queen Stake in Hero (694) – Implied Ownership (Non-Queen SHs) Implied Exchange Ratio 11.9% 1.85x 88.1% 1.00x Implied Equity Value Implied Ownership (Non-Queen SHs) $37.14 $1,241 12.7% $18.57 $8,503 87.3% $9,744 Gets Plus: Share of Capitalized Synergies(3) $3.68 $123 $1.84 $843 $965 Implied Prem. / (Disc.) After Synergies (2) 17.8% 8.8% Share of Value Creation Source: Public filings, Hero Projections, Factset as of as of February 3, 2017. 21.3% 78.7% Note: (1) Dollars in millions, except per share data. Reflects projected enterprise value and market cap at year-end 2016E assuming both QVCA and QVCB shares trade at current QVCA price of $18.75. For instance, market capitalization reflects 2016E year-end diluted shares multiplied by current QVCA share price. Represents share of pro forma equity value divided by standalone equity value minus 1. Capitalized at blended 2017E Comparable EV/EBITDA multiple of 7.7x. 46 (2) (3) Value Creation $206 $759 $965 Value per Share w/ Synergies $40.82 $1,363 $20.41 $9,346 Implied Prem. / (Disc.) Before Synergies (2) 7.2% (1.0%) Targeted Exchange Ratio 2.00x 1.00x Adjusted Equity Value $1,157 $8,586 $9,744 Observed Market Equity Value $34.65 $1,851 $18.75 $8,586(1) $10,437 Enterprise Value $2,415 $15,243(1) $17,658
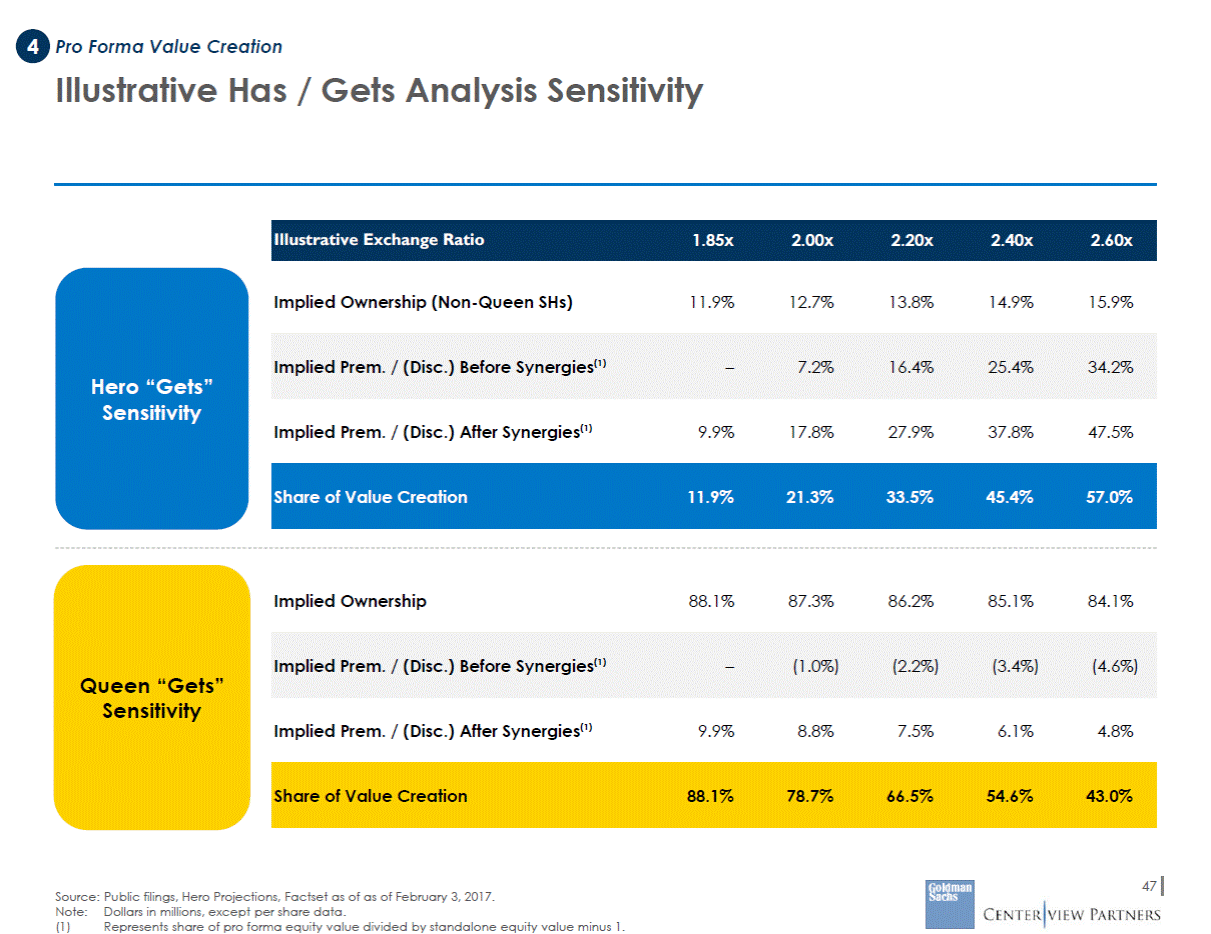
Pro Forma Value Creation Illustrative Has / Gets Analysis Sensitivity Implied Ownership (Non-Queen SHs) 11.9% 12.7% 13.8% 14.9% 15.9% Hero “Gets” Sensitivity Implied Prem. / (Disc.) After Synergies(1) 9.9% 17.8% 27.9% 37.8% 47.5% Implied Ownership 88.1% 87.3% 86.2% 85.1% 84.1% Queen “Gets” Sensitivity Implied Prem. / (Disc.) After Synergies(1) 9.9% 8.8% 7.5% 6.1% 4.8% 47 Source: Public filings, Hero Projections, Factset as of as of February 3, 2017. Note:Dollars in millions, except per share data. (1) Represents share of pro forma equity value divided by standalone equity value minus 1. Share of Value Creation88.1%78.7%66.5%54.6%43.0% Implied Prem. / (Disc.) Before Synergies(1)–(1.0%)(2.2%)(3.4%)(4.6%) Share of Value Creation11.9%21.3%33.5%45.4%57.0% Implied Prem. / (Disc.) Before Synergies(1)–7.2%16.4%25.4%34.2% Illustrative Exchange Ratio1.85x2.00x2.20x2.40x2.60x
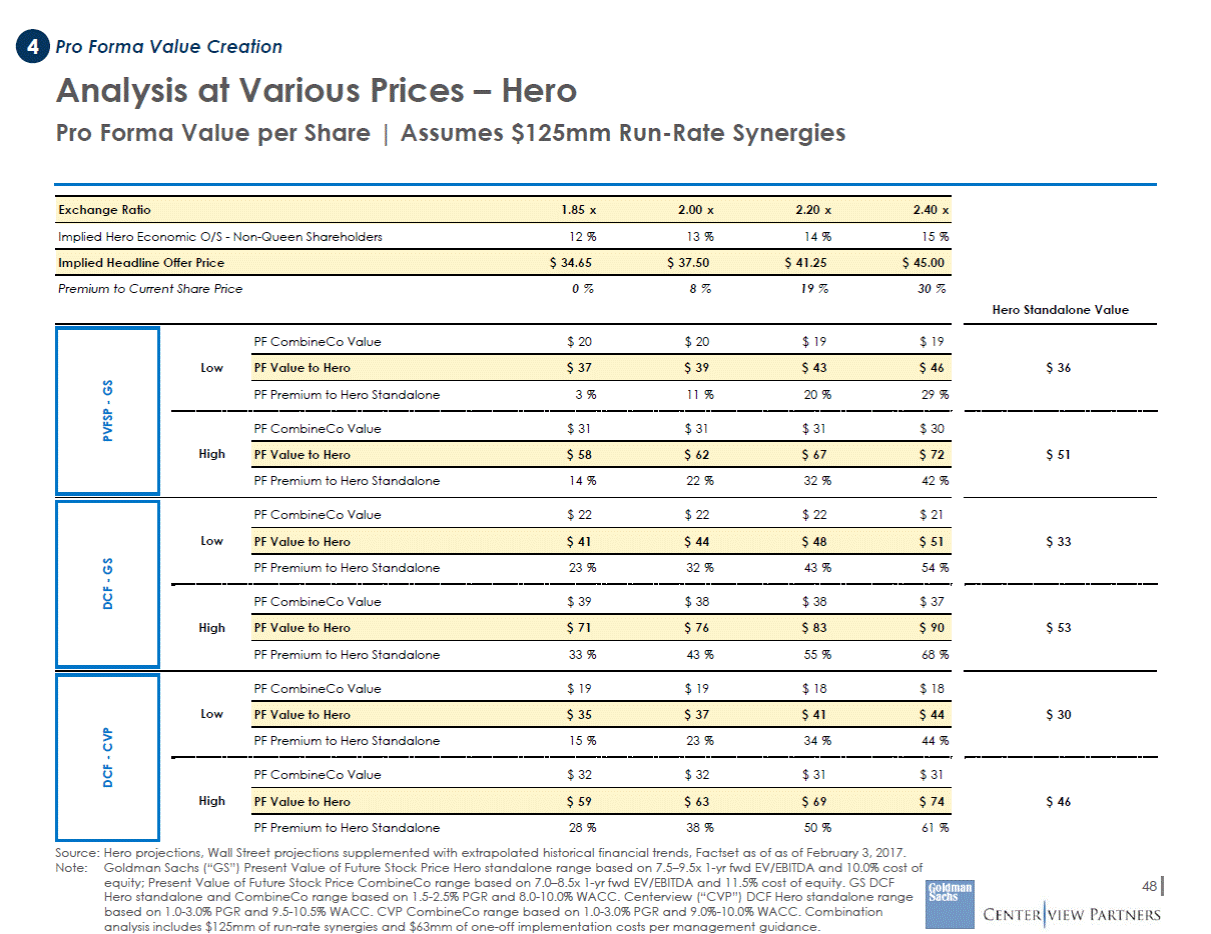
Pro Forma Value Creation Analysis at Various Prices – Hero Pro Forma Value per Share | Assumes $125mm Run-Rate Synergies Implied Hero Economic O/S - Non-Queen Shareholders 12 % 13 % 14 % 15 % Premium to Current Share Price 0 % 8 % 19 % 30 % Hero Standalone Value PF CombineCo Value $ 20 $ 20 $ 19 $ 19 Low $ 36 PF Premium to Hero Standalone 3 % 11 % 20 % 29 % PF CombineCo Value $ 31 $ 31 $ 31 $ 30 High $ 51 PF Premium to Hero Standalone 14 % 22 % 32 % 42 % $ 33 $ 53 $ 30 $ 46 Source: Hero projections, Wall Street projections supplemented with extrapolated historical financial trends, Factset as of as of February 3, 2017. Note:Goldman Sachs (“GS”) Present Value of Future Stock Price Hero standalone range based on 7.5–9.5x 1-yr fwd EV/EBITDA and 10.0% cost of equity; Present Value of Future Stock Price CombineCo range based on 7.0–8.5x 1-yr fwd EV/EBITDA and 11.5% cost of equity. GS DCF Hero standalone and CombineCo range based on 1.5-2.5% PGR and 8.0-10.0% WACC. Centerview (“CVP”) DCF Hero standalone range based on 1.0-3.0% PGR and 9.5-10.5% WACC. CVP CombineCo range based on 1.0-3.0% PGR and 9.0%-10.0% WACC. Combination analysis includes $125mm of run-rate synergies and $63mm of one-off implementation costs per management guidance. 48 PVFSP - GS DCF - GS PF CombineCo Value$ 22$ 22$ 22$ 21 Low PF Premium to Hero Standalone23 %32 %43 %54 % PF CombineCo Value$ 39$ 38$ 38$ 37 High PF Premium to Hero Standalone33 %43 %55 %68 % DCF - CVP PF CombineCo Value$ 19$ 19$ 18$ 18 Low PF Premium to Hero Standalone15 %23 %34 %44 % PF CombineCo Value$ 32$ 32$ 31$ 31 High PF Premium to Hero Standalone28 %38 %50 %61 % PF Value to Hero$ 59$ 63$ 69$ 74 PF Value to Hero$ 35$ 37$ 41$ 44 PF Value to Hero$ 71$ 76$ 83$ 90 PF Value to Hero$ 41$ 44$ 48$ 51 PF Value to Hero$ 58$ 62$ 67$ 72 PF Value to Hero$ 37$ 39$ 43$ 46 Implied Headline Offer Price$ 34.65$ 37.50$ 41.25$ 45.00 Exchange Ratio1.85 x2.00 x2.20 x2.40 x
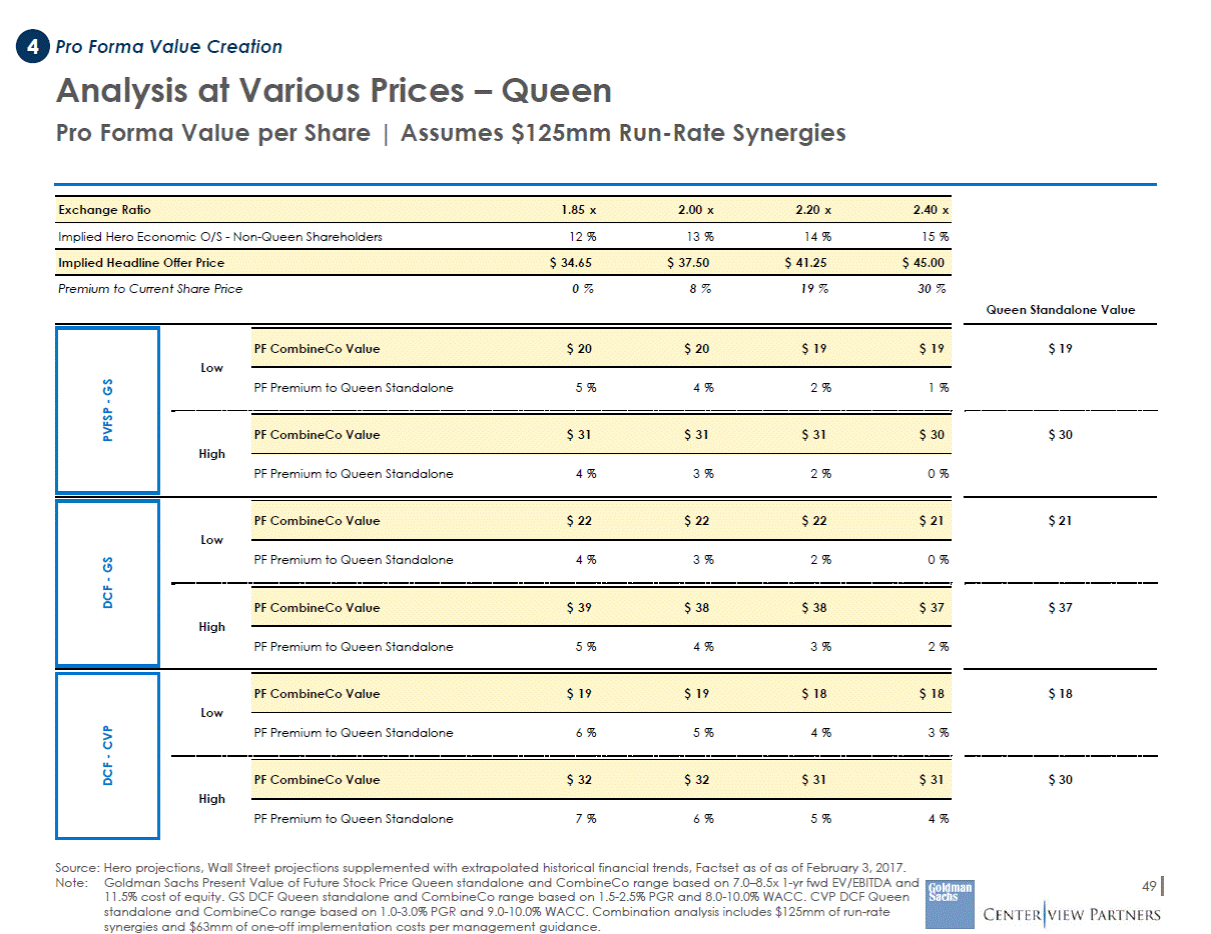
Pro Forma Value Creation Analysis at Various Prices – Queen Pro Forma Value per Share | Assumes $125mm Run-Rate Synergies Implied Hero Economic O/S - Non-Queen Shareholders 12 % 13 % 14 % 15 % Premium to Current Share Price 0 % 8 % 19 % 30 % Queen Standalone Value $ 19 Low $ 30 $ 21 Low $ 37 $ 18 Low $ 30 Source: Hero projections, Wall Street projections supplemented with extrapolated historical financial trends, Factset as of as of February 3, 2017. Note:Goldman Sachs Present Value of Future Stock Price Queen standalone and CombineCo range based on 7.0–8.5x 1-yr fwd EV/EBITDA and 11.5% cost of equity. GS DCF Queen standalone and CombineCo range based on 1.5-2.5% PGR and 8.0-10.0% WACC. CVP DCF Queen standalone and CombineCo range based on 1.0-3.0% PGR and 9.0-10.0% WACC. Combination analysis includes $125mm of run-rate synergies and $63mm of one-off implementation costs per management guidance. 49 DCF - CVP DCF - GS PVFSP - GS PF CombineCo Value$ 20$ 20$ 19$ 19 PF Premium to Queen Standalone5 %4 %2 %1 % PF CombineCo Value$ 31$ 31$ 31$ 30 High PF Premium to Queen Standalone4 %3 %2 %0 % PF CombineCo Value$ 22$ 22$ 22$ 21 PF Premium to Queen Standalone4 %3 %2 %0 % PF CombineCo Value$ 39$ 38$ 38$ 37 High PF Premium to Queen Standalone5 %4 %3 %2 % PF CombineCo Value$ 19$ 19$ 18$ 18 PF Premium to Queen Standalone6 %5 %4 %3 % PF CombineCo Value$ 32$ 32$ 31$ 31 High PF Premium to Queen Standalone7 %6 %5 %4 % Implied Headline Offer Price$ 34.65$ 37.50$ 41.25$ 45.00 Exchange Ratio1.85 x2.00 x2.20 x2.40 x
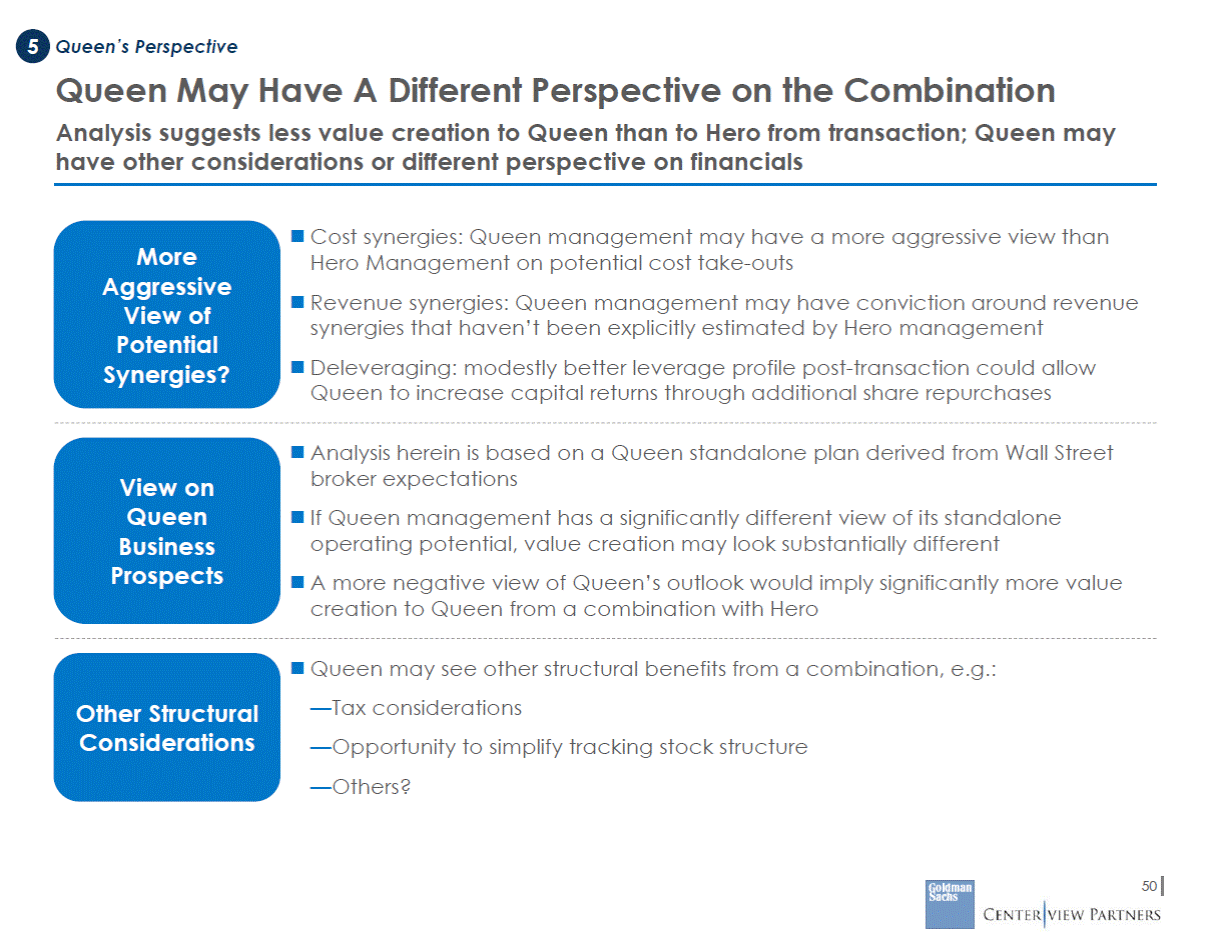
Queen’s Perspective Queen May Have A Different Perspective on the Combination Analysis suggests less value creation to Queen than to Hero from transaction; Queen may have other considerations or different perspective on financials Cost synergies: Queen management may have a more aggressive view than Hero Management on potential cost take-outs Revenue synergies: Queen management may have conviction around revenue synergies that haven’t been explicitly estimated by Hero management Deleveraging: modestly better leverage profile post-transaction could allow Queen to increase capital returns through additional share repurchases More Aggressive View of Potential Synergies? Analysis herein is based on a Queen standalone plan derived from Wall Street broker expectations If Queen management has a significantly different view of its standalone operating potential, value creation may look substantially different A more negative view of Queen’s outlook would imply significantly more value creation to Queen from a combination with Hero View on Queen Business Prospects Queen may see other structural benefits from a combination, e.g.: —Tax considerations —Opportunity to simplify tracking stock structure —Others? Other Structural Considerations 50
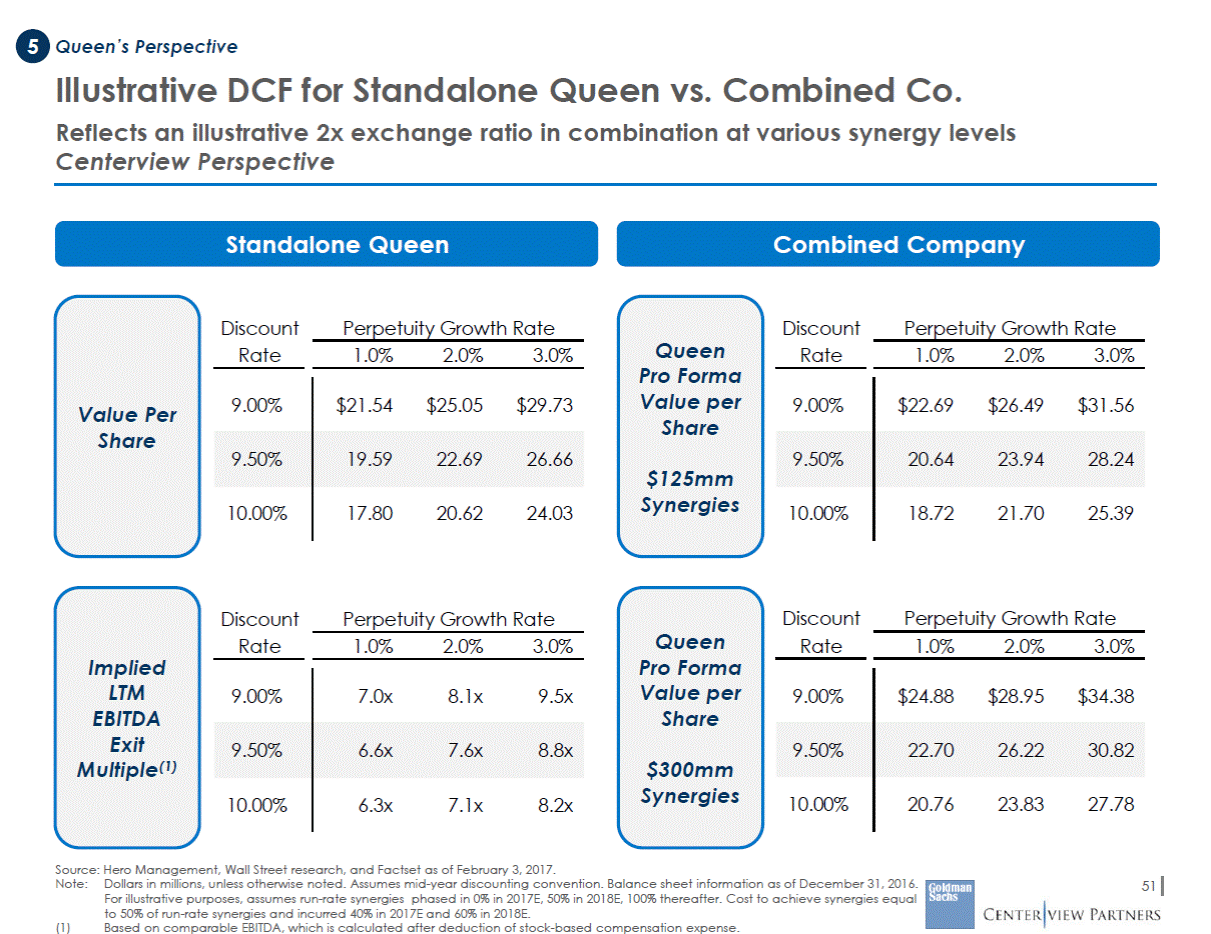
Queen’s Perspective Illustrative DCF for Standalone Queen vs. Combined Co. Reflects an illustrative 2x exchange ratio in combination at various synergy levels Centerview Perspective Standalone Queen Combined Company Discount Rate Perpetuity Growth Rate Discount Rate Perpetuity Growth Rate Queen Pro Forma Value per Share 1.0% 2.0% 3.0% 1.0% 2.0% 3.0% Value Per Share $125mm Synergies Discount Rate Perpetuity Growth Rate Discount Rate Perpetuity Growth Rate Queen Pro Forma Value per Share 1.0% 2.0% 3.0% 1.0% 2.0% 3.0% Implied LTM EBITDA Exit Multiple(1) $300mm Synergies Source: Hero Management, Wall Street research, and Factset as of February 3, 2017. Note:Dollars in millions, unless otherwise noted. Assumes mid-year discounting convention. Balance sheet information as of December 31, 2016. For illustrative purposes, assumes run-rate synergies phased in 0% in 2017E, 50% in 2018E, 100% thereafter. Cost to achieve synergies equal to 50% of run-rate synergies and incurred 40% in 2017E and 60% in 2018E. 51 (1) Based on comparable EBITDA, which is calculated after deduction of stock-based compensation expense. 9.00% $24.88 $28.95 $34.38 9.50% 22.70 26.22 30.82 10.00% 20.76 23.83 27.78 9.00% 7.0x 8.1x 9.5x 9.50% 6.6x 7.6x 8.8x 10.00% 6.3x 7.1x 8.2x 9.00% $22.69 $26.49 $31.56 9.50% 20.64 23.94 28.24 10.00% 18.72 21.70 25.39 9.00% $21.54 $25.05 $29.73 9.50% 19.59 22.69 26.66 10.00% 17.80 20.62 24.03
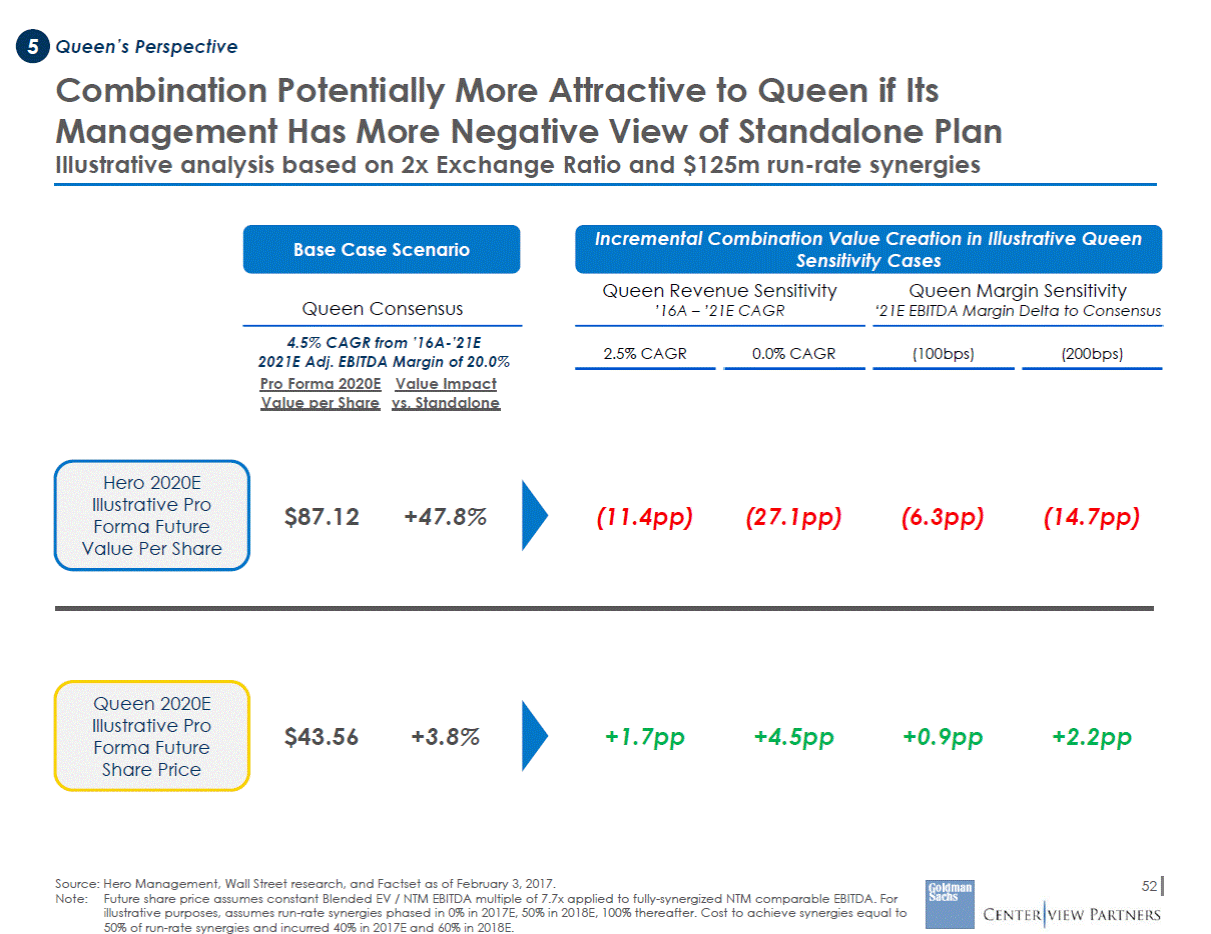
Queen’s Perspective Combination Potentially More Attractive to Queen if Its Management Has More Negative View of Standalone Plan Illustrative analysis based on 2x Exchange Ratio and $125m run-rate synergies Incremental Combination Value Creation in Illustrative Queen Sensitivity Cases Base Case Scenario Queen Revenue Sensitivity ’16A – ’21E CAGR Queen Margin Sensitivity ‘21E EBITDA Margin Delta to Consensus Queen Consensus 4.5% CAGR from ’16A-’21E 2021E Adj. EBITDA Margin of 20.0% 2.5% CAGR 0.0% CAGR (100bps) (200bps) Pro Forma 2020E Value Impact Value per Share vs. Standalone Hero 2020E Illustrative Pro Forma Future Value Per Share $87.12 +47.8% (11.4pp) (27.1pp) (6.3pp) (14.7pp) Queen 2020E Illustrative Pro Forma Future Share Price $43.56 +3.8% +1.7pp +4.5pp +0.9pp +2.2pp Source: Hero Management, Wall Street research, and Factset as of February 3, 2017. Note:Future share price assumes constant Blended EV / NTM EBITDA multiple of 7.7x applied to fully-synergized NTM comparable EBITDA. For illustrative purposes, assumes run-rate synergies phased in 0% in 2017E, 50% in 2018E, 100% thereafter. Cost to achieve synergies equal to 50% of run-rate synergies and incurred 40% in 2017E and 60% in 2018E. 52
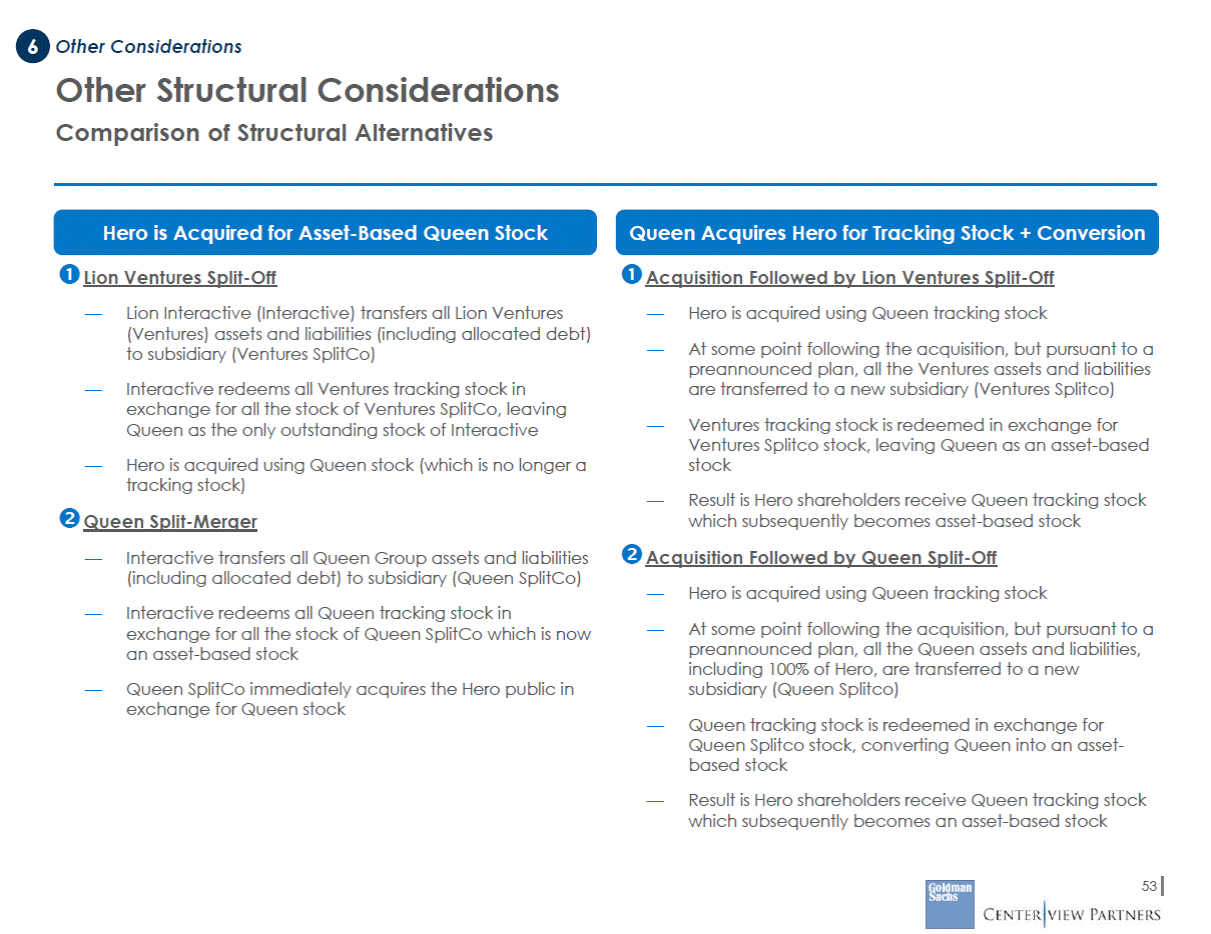
Other Considerations Other Structural Considerations Comparison of Structural Alternatives Hero is Acquired for Asset-Based Queen Stock Lion Ventures Split-Off Queen Acquires Hero for Tracking Stock + Conversion Acquisition Followed by Lion Ventures Split-Off — Lion Interactive (Interactive) transfers all Lion Ventures (Ventures) assets and liabilities (including allocated debt) to subsidiary (Ventures SplitCo) — Hero is acquired using Queen tracking stock — At some point following the acquisition, but pursuant to a preannounced plan, all the Ventures assets and liabilities are transferred to a new subsidiary (Ventures Splitco) — Interactive redeems all Ventures tracking stock in exchange for all the stock of Ventures SplitCo, leaving Queen as the only outstanding stock of Interactive — Ventures tracking stock is redeemed in exchange for Ventures Splitco stock, leaving Queen as an asset-based stock — Hero is acquired using Queen stock (which is no longer a tracking stock) Result is Hero shareholders receive Queen tracking stock which subsequently becomes asset-based stock Acquisition Followed by Queen Split-Off — Queen Split-Merger — Interactive transfers all Queen Group assets and liabilities (including allocated debt) to subsidiary (Queen SplitCo) — Hero is acquired using Queen tracking stock Interactive redeems all Queen tracking stock in exchange for all the stock of Queen SplitCo which is now an asset-based stock — At some point following the acquisition, but pursuant to a preannounced plan, all the Queen assets and liabilities, including 100% of Hero, are transferred to a new subsidiary (Queen Splitco) — — Queen SplitCo immediately acquires the Hero public in exchange for Queen stock — Queen tracking stock is redeemed in exchange for Queen Splitco stock, converting Queen into an asset-based stock — Result is Hero shareholders receive Queen tracking stock which subsequently becomes an asset-based stock 53
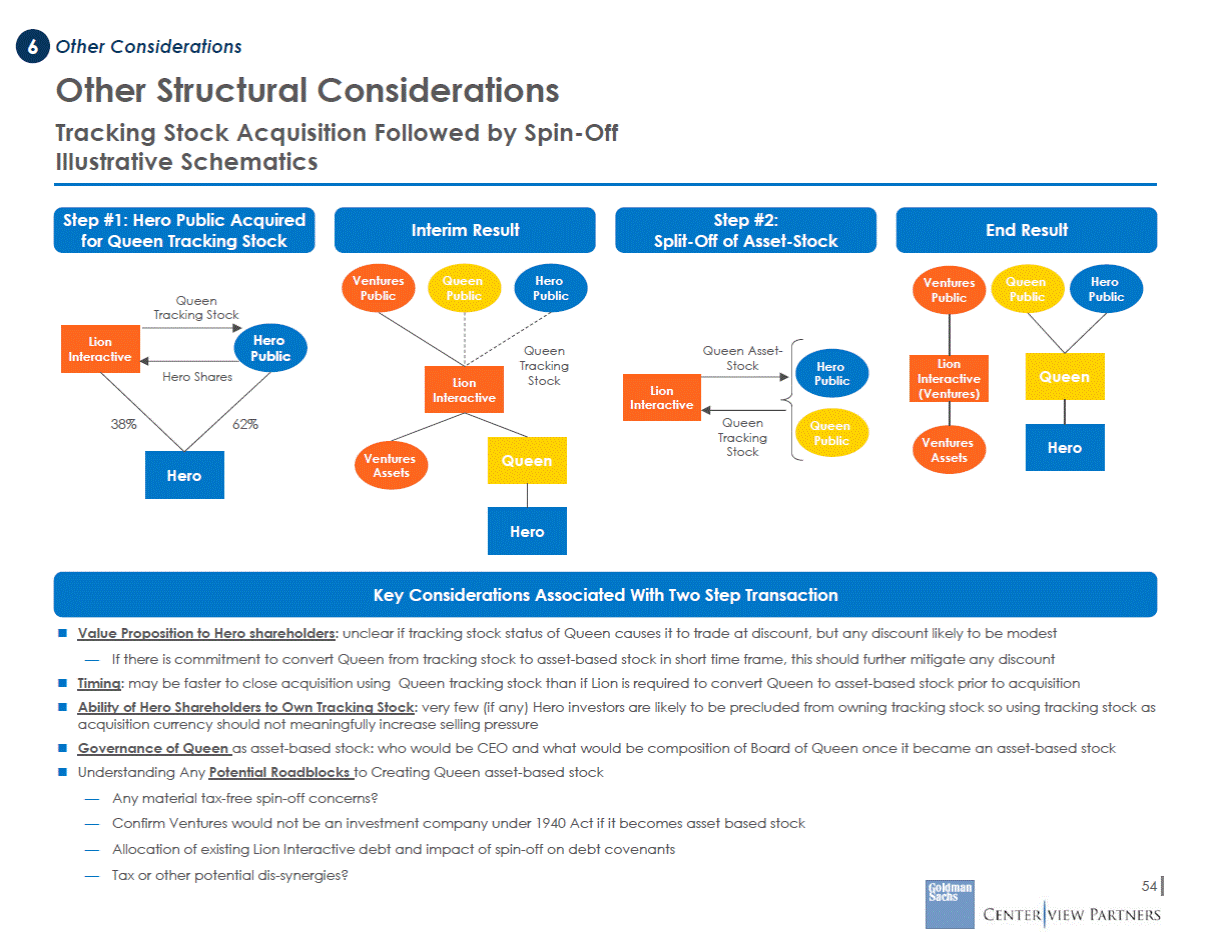
Other Considerations Other Structural Considerations Tracking Stock Acquisition Followed by Spin-Off Illustrative Schematics Step #1: Hero Public Acquired for Queen Tracking Stock Step #2: Split-Off of Asset-Stock Interim Result End Result Ventures Public Queen Public Hero Public Queen Public Hero Public Ventures Public Queen Tracking Stock Hero Public Queen Tracking Stock Queen Asset-Stock Hero Public Hero Shares Interactive Queen Tracking Stock 38% 62% Queen Public Ventures Assets Ventures Assets Key Considerations Associated With Two Step Transaction Value Proposition to Hero shareholders: unclear if tracking stock status of Queen causes it to trade at discount, but any discount likely to be modest — If there is commitment to convert Queen from tracking stock to asset-based stock in short time frame, this should further mitigate any discount Timing: may be faster to close acquisition using Queen tracking stock than if Lion is required to convert Queen to asset-based stock prior to acquisition Ability of Hero Shareholders to Own Tracking Stock: very few (if any) Hero investors are likely to be precluded from owning tracking stock so using tracking stock as acquisition currency should not meaningfully increase selling pressure Governance of Queen as asset-based stock: who would be CEO and what would be composition of Board of Queen once it became an asset-based stock Understanding Any Potential Roadblocks to Creating Queen asset-based stock — — — — Any material tax-free spin-off concerns? Confirm Ventures would not be an investment company under 1940 Act if it becomes asset based stock Allocation of existing Lion Interactive debt and impact of spin-off on debt covenants Tax or other potential dis-synergies? 54 Hero Queen Hero Lion Lion Interactive Lion Interactive (Ventures) Queen Hero Lion Interactive
VII.Preliminary Evaluation of Potential Strategic Alternatives
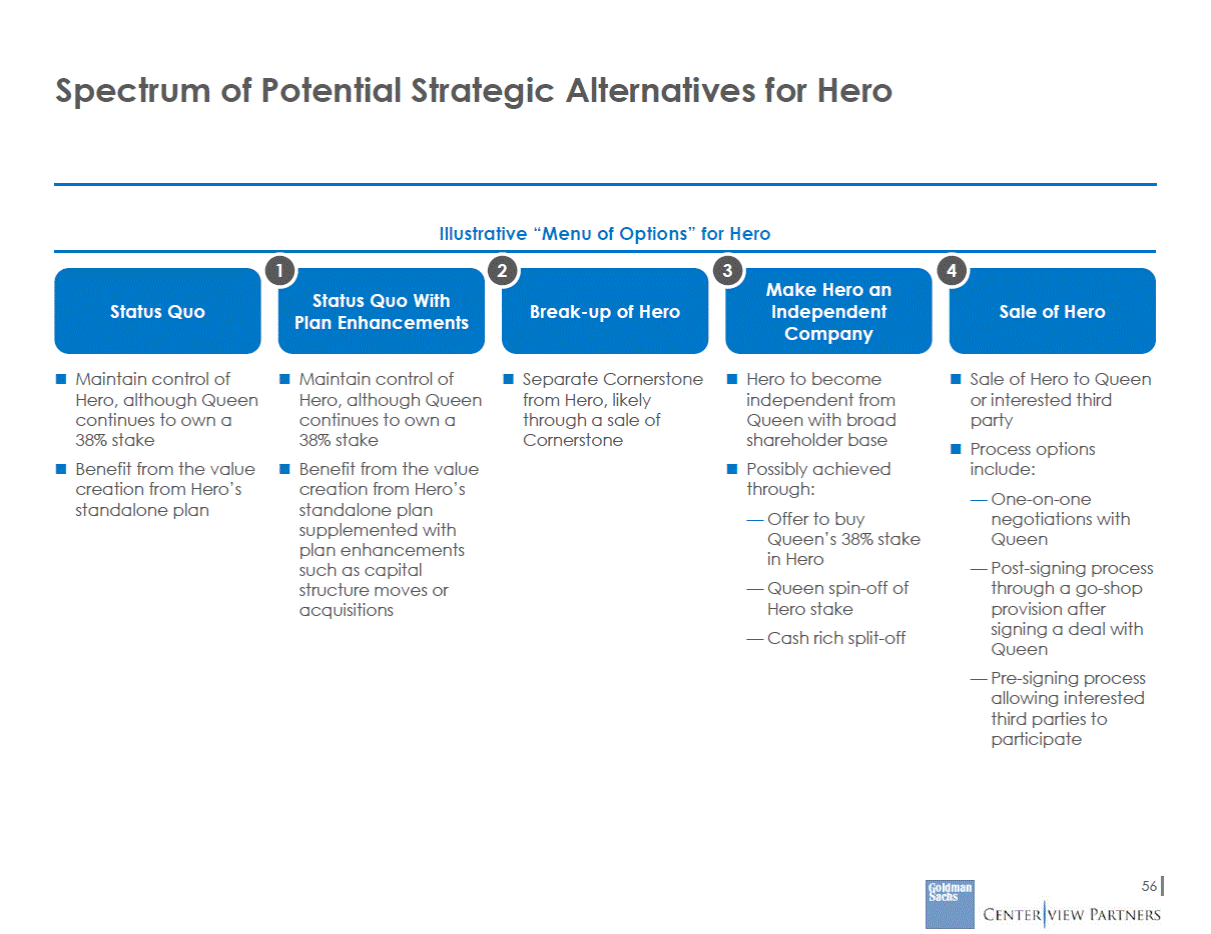
Spectrum of Potential Strategic Alternatives for Hero Illustrative “Menu of Options” for Hero Make Hero an Independent Company Status Quo With Plan Enhancements Status Quo Break-up of Hero Sale of Hero Maintain control of Hero, although Queen continues to own a 38% stake Benefit from the value creation from Hero’s standalone plan Maintain control of Hero, although Queen continues to own a 38% stake Benefit from the value creation from Hero’s standalone plan supplemented with plan enhancements such as capital structure moves or acquisitions Separate Cornerstone from Hero, likely through a sale of Cornerstone Hero to become independent from Queen with broad shareholder base Possibly achieved through: — Offer to buy Queen’s 38% stake in Hero — Queen spin-off of Hero stake — Cash rich split-off Sale of Hero to Queen or interested third party Process options include: — One-on-one negotiations with Queen — Post-signing process through a go-shop provision after signing a deal with Queen — Pre-signing process allowing interested third parties to participate 56
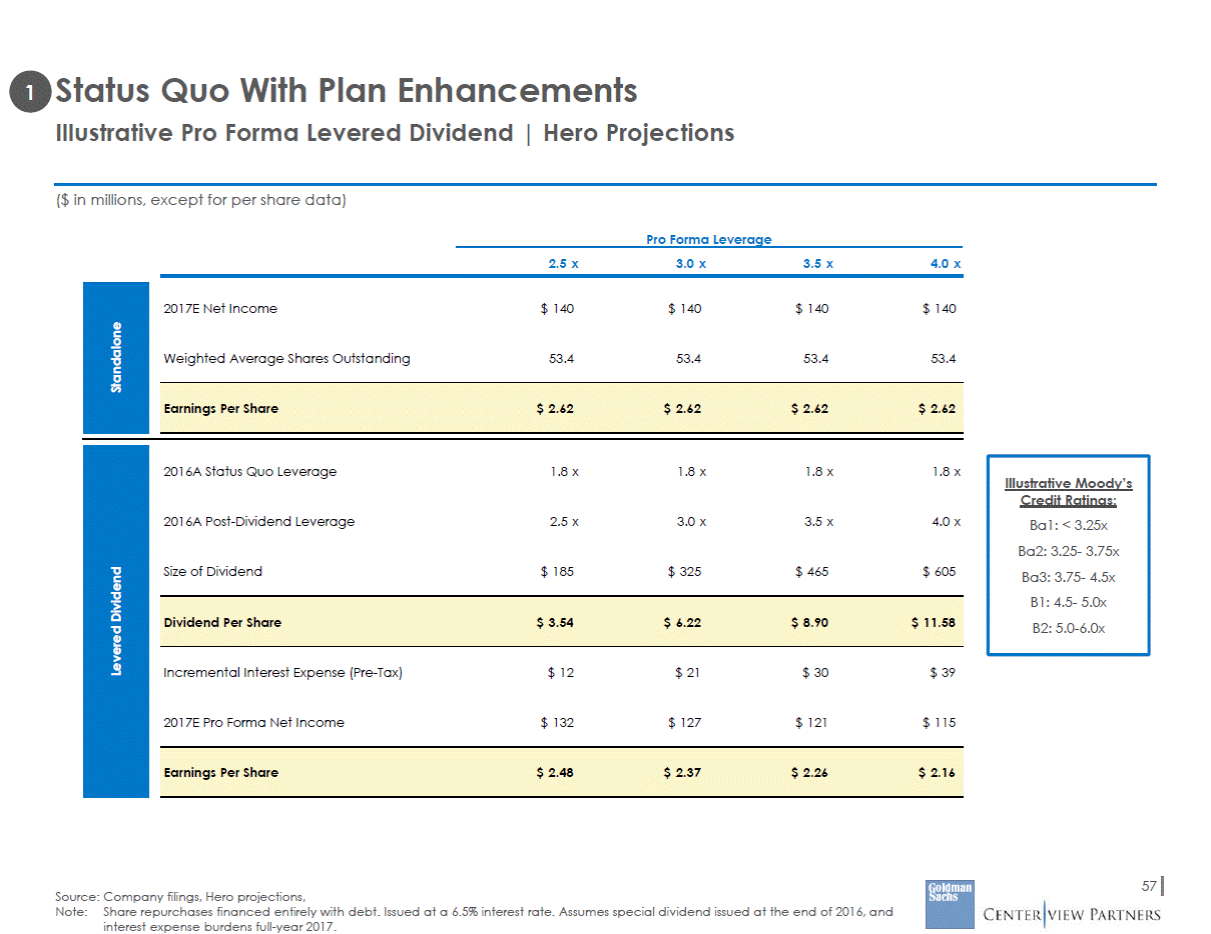
Status Quo With Plan Enhancements Illustrative Pro Forma Levered Dividend | Hero Projections ($ in millions, except for per share data) Pro Forma Leverage 2.5 x 3.0 x 3.5 x 4.0 x 2017E Net Income $ 140 $ 140 $ 140 $ 140 Weighted Average Shares Outstanding 53.4 53.4 53.4 53.4 2016A Status Quo Leverage 1.8 x 1.8 x 1.8 x 1.8 x Illustrative Moody’s Credit Ratings: 2016A Post-Dividend Leverage 2.5 x 3.0 x 3.5 x 4.0 x Ba1: < 3.25x Ba2: 3.25-3.75x Ba3: 3.75-4.5x B1: 4.5-5.0x B2: 5.0-6.0x Size of Dividend $ 185 $ 325 $ 465 $ 605 Incremental Interest Expense (Pre-Tax) $ 12 $ 21 $ 30 $ 39 2017E Pro Forma Net Income $ 132 $ 127 $ 121 $ 115 57 Source: Company filings, Hero projections, Note:Share repurchases financed entirely with debt. Issued at a 6.5% interest rate. Assumes special dividend issued at the end of 2016, and interest expense burdens full-year 2017. Levered Dividend Standalone Earnings Per Share$ 2.48$ 2.37$ 2.26$ 2.16 Dividend Per Share$ 3.54$ 6.22$ 8.90$ 11.58 Earnings Per Share$ 2.62$ 2.62$ 2.62$ 2.62
Status Quo With Plan Enhancements Potential M&A Targets Potential Bolt-On Acquisition Targets for Hero Online Retailers TV Shopping Home-Related TV Programming(1) Continued shift of consolidated sales mix from phone-based to online sales Leverage existing TV platform and expertise across a larger base Leverage existing TV platform and expertise multiple channels Leverage of logistics and fulfillment capabilities across a larger base Margin upside through economies of scale Content-based support of TV/online shopping experience across platforms Potentially incremental growth through international exposure Cross-selling between platforms to drive combined revenue Margin upside through economies of scale in network costs and production Cross-selling between platforms to drive combined revenue Focus likely on profitable targets with established platform but moderate growth and size to keep acquisition price and multiple affordable However, incremental exposure to TV-triggered sales 58 (1) Both targets listed, Cooking Channel and HGTV, are currently owned by Scripps Networks Interactive Illustrative Targets
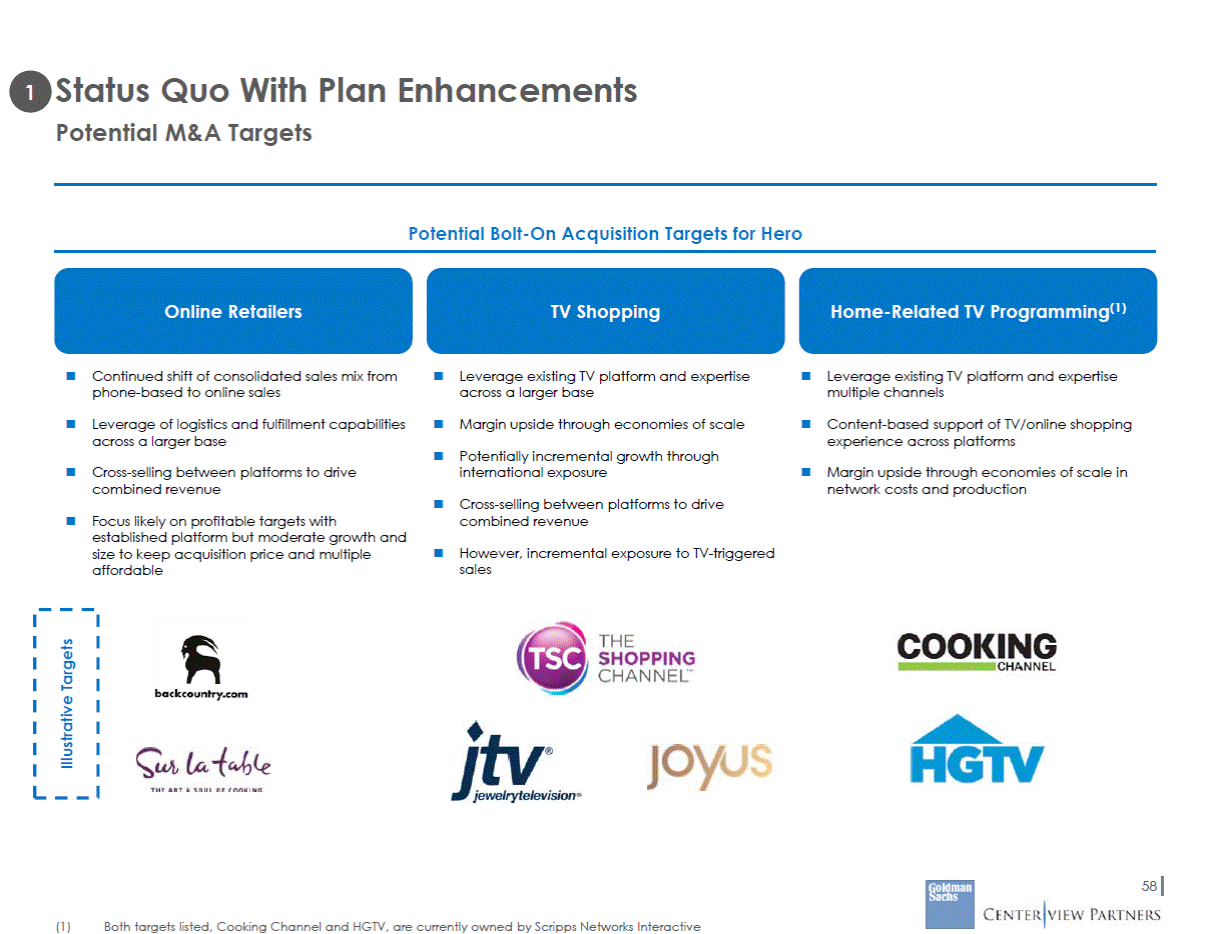
Break-Up of Hero Illustrative Sale of Cornerstone at Various Prices | Hero Projections ($ in millions, except for per share data) EBITDA4 Implied Cornerstone Enterprise Value¹ $ 41 $ 203 $ 223 $ 244 $ 264 $ 284 $ 305 Implied Tax Leakage² - - - - - - Implied Post-Tax Proceeds per Share $ 3.80 $ 4.18 $ 4.56 $ 4.94 $ 5.32 $ 5.70 Implied Hero RemainCo EV/207E EBITDA (post-SBC)³ 8.9 x 8.8 x 8.7 x 8.6 x 8.6 x 8.5 x Current 8.3 x 0.6 x 0.5 x 0.4 x 0.3 x 0.2 x 0.2 x Breakeven for Shareholders Selected Company Medians Specialty Retail Department / Mass Home Stores Cornerstone EV/EBITDA (post-SBC) EBITDA 2016A $ 41 5.0 x 5.5 x 6.0 x 6.5 x 7.0 x 7.5 x 5.6 x 6.5 x 6.1 x 2017E $ 37 5.4 6.0 6.5 7.1 7.6 8.2 6.5 6.1 6.0 Source: Company filings, Hero projections, Bloomberg, Factset as of February 3, 2017 Note: Selected company medians adjusted for comps with a similar growth profile to Cornerstone. Specialty Retail includes Best Buy, Fossil and GNC; Home Retail includes Bed Bath & Beyond, Ethan Allen, Pier 1 and Williams-Sonoma; Department Stores / Mass includes Dillards, Nordstrom, Kohls, Macy’s, Target and Wal-Mart. Implied enterprise value calculated based on $36mm in LTM 2016A EBITDA after deduction of stock-based compensation. Assumes tax basis of $723mm as per Hero management. 2017E EBITDA for Hero of $285.5mm. Pro Forma 2017E Hero RemainCo EBITDA of $238.4mm. Includes dis-synergies of approx. $10mm (assumed to be 3% of Cornerstone 2016A operating expenses). Cornerstone EBITDA pro forma for sale of Chasing Fireflies and TravelSmith. 2016A EBITDA of $40.6mm and 2017E EBITDA of $37.3mm, both calculated after stock-based compensation. (1) (2) (3) 59 (4) Required EBITDA Multiple Expansion on Hero RemainCo to Implied Post-Tax Proceeds $ 203 $ 223 $ 244 $ 264 $ 284 $ 305 Illustrative Cornerstone Acquisition EV/LTM EBITDA Multiple 5.0 x 5.5 x 6.0 x 6.5 x 7.0 x 7.5 x
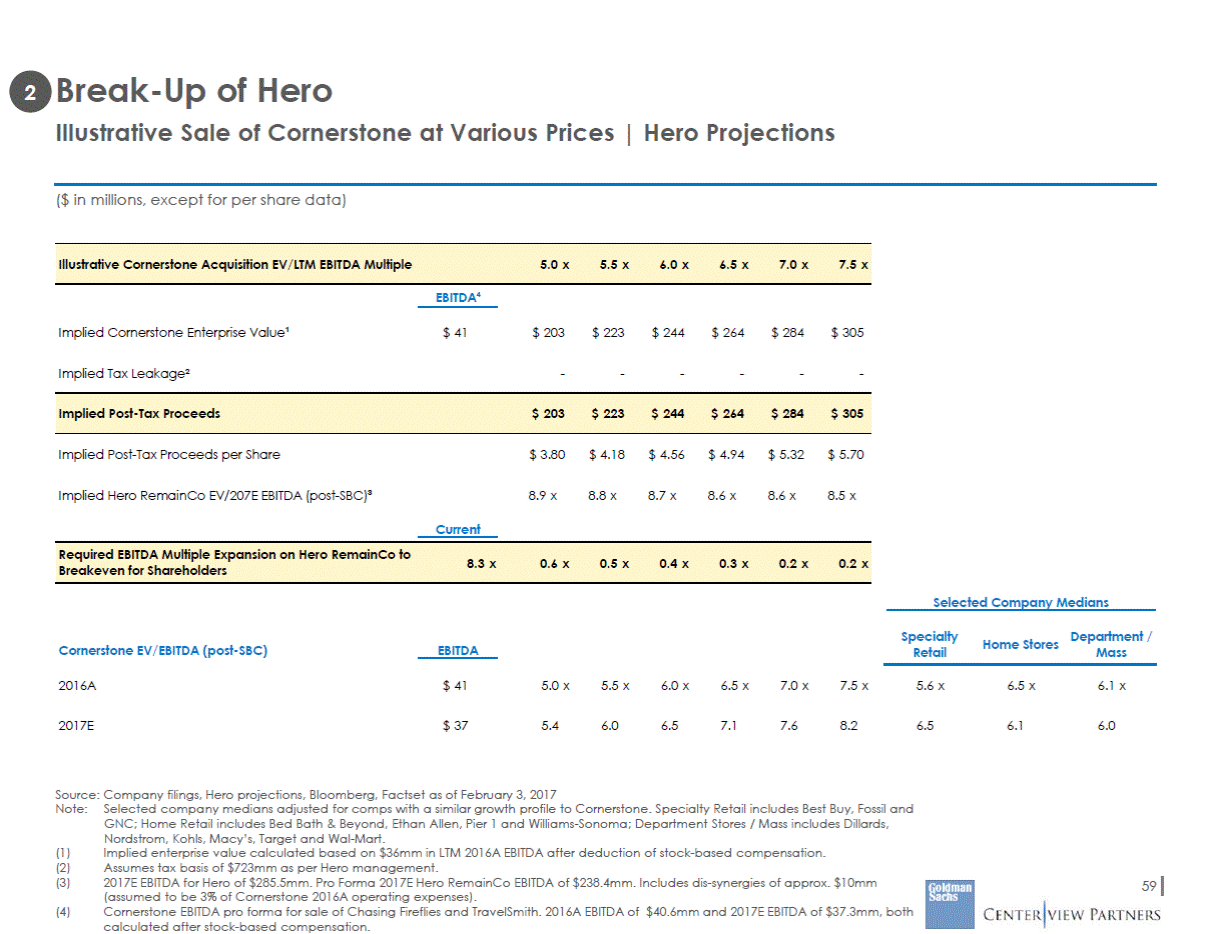
Make Hero an Independent Company Potential Tax-Efficient Exit Alternatives for Lion/Queen Cash-Rich Split-Off Hero Holding Company Spin-Off Hero RMT (Spin-Off and Collapse) I IIa IIb shareholders Queen shareholders own >50% of MergeCo an independent public company new independent Hero shareholders leverage at Hero to fund cash payment to Willingness of Queen to exit at no premium 60 Description Hero contributes Cornerstone plus cash to a new subsidiary (SplitCo) Hero repurchases the Hero shares held by Queen in exchange for 100% of SplitCo Queen contributes 38% Hero stake to a new subsidiary (SpinCo) along with a small active business Queen distributes SpinCo to Queen shareholders Spinco and Hero remain separate publicly traded companies Queen contributes 38% Hero stake and small active business to SpinCo Queen distributes SpinCo to Queen SpinCo immediately merges with Hero and Hero shareholder receive <50% of “MergeCo” stock and cash Potential Benefits Queen receives cash and Cornerstone for its Hero shares on tax-free basis Hero able to divest Cornerstone tax-free Hero becomes independent public company Hero becomes independent from Queen Hero can sell Cornerstone to optimal buyer (or retain) Tax-free to Queen and Queen Potential for SpinCo and Hero to merge after waiting period Tax-free to Queen and Queen shareholders Only one Hero security trades publicly; Hero is Hero shareholders receive cash and ~50% of Key Considerations Queen (and Lion) interest in Cornerstone Complexity of negotiation with Queen (and Lion) Business (i.e., Cornerstone) must be at least 1/3rd of value of Splitco Willingness of Queen to exit Hero at no premium Two Hero securities trade publicly (Hero and SpinCo) SpinCo needs active business (5%+ of value) to satisfy new tax-free spin-off rules Complexity of negotiation with Queen (and Lion) Capital structure impact of increased Hero shareholders
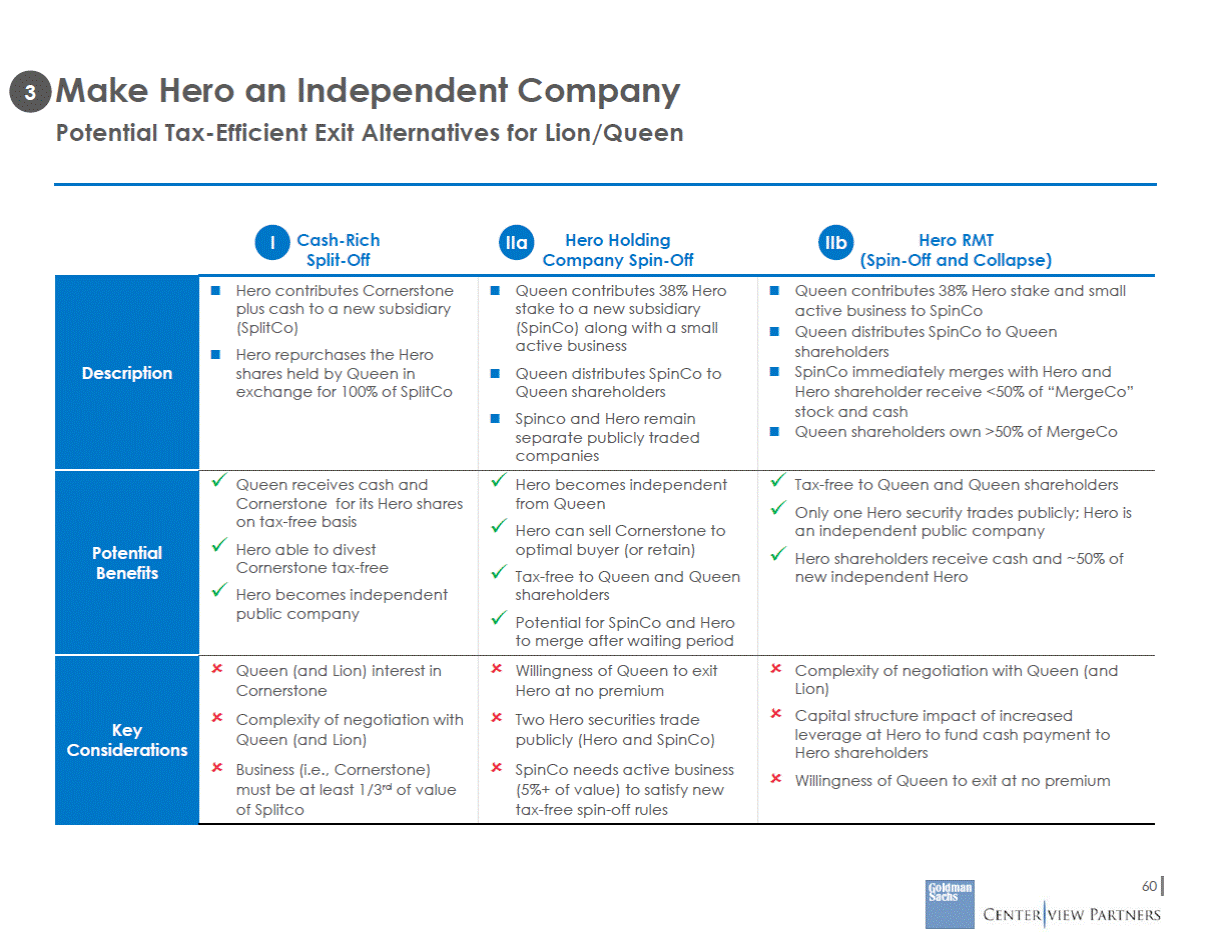
Sale of Hero Potential Buyer Universe ($ in billions) E-Commerce Department Stores Hard Goods Companies Cornerstone Buyers Recent Transactions JC Penney Land’s End Otto Capmark Financial sponsors Recent Transactions Recent Transactions Company Key Statistics Company Key Statistics Company Key Statistics MCap : $386.5 EV: $368.2 Leverage:(1.5)x Cash: $19.3 17E EV/EBITDA: 19.0x Acquired Safaba Translation Solutions in Sep-2015for undisclosed amount Acquired Zappos for $1.2bn in Nov-2009 MCap : $10.0 EV: $17.2 Leverage: 2.3x Cash: $0.5 17E EV/EBITDA: 6.0x Acquired Bluemercury for $210mm in Feb-2015 MCap : $204.9 EV: $254.1 Leverage: 1.4x Cash: $5.9 17E EV/EBITDA: 7.8x Walmart acquired Jet.com for $3.3bn in Aug-2016 Walmart Mexico sold Suburbia to El Puerto de Liverpool for $849mm in Aug-2016 MCap : $198.0 EV: $304.7 Leverage: 2.4x Cash: $2.9 17E EV/EBITDA: 6.7x Acquired Yahoo for $4.8bn in Jul-2016 Acquired Polyvore for $160mm in Jul-2015 MCap : $7.2 EV: $11.2 Leverage: 1.7x Cash: $0.6 17E EV/EBITDA: 5.0x No recent M&A activities MCap : $36.4 EV: $48.0 Leverage: 1.6x Cash: $1.2 17E EV/EBITDA: 6.5x Sold pharmacy and clinic businesses to CVS Pharmacy for $1.9bn in Jun-2015 MCap : $37.7 EV: $38.3 LTM Leverage: 0.6x Cash: $1.8 17E EV/EBITDA: 12.2x Sold Radial to for $925mm in Jul-2015 MCap : $7.7 EV: $10.0 Leverage: 1.4x Cash: $0.5 17E EV/EBITDA: 6.0x Acquired Trunk Club for $350mm in Jul-2014 Acquired HauteLook for $270mm in feb-2011 MCap : $6.1 EV: $7.0 Leverage: 0.7x Cash: $0.5 17E EV/EBITDA: 5.0x Acquired PersonalizationMall.c om for $190mm in Nov-2016 Acquired One Kings Lane in Jun-2016 EV: $14.8 $2.5bn in Aug-2015 MCap : $2.1 EV: $6.7 Leverage: 6.3x Cash: $0.2 17E EV/EBITDA: 6.0x Sold home office building in Plano for $353mn in Aug-2016 Acquired Liz Claiborne for $268mn in Oct-2011 MCap : $4.3 EV: $4.3 Leverage: 0.1x Cash: $0.1 17E EV/EBITDA: 6.3x Sold credit card portfolio to Alliance Data Systems Corporation in Sep-2016 Chinese E-Commerce MCap : $251.0 EV: $249.7 Leverage: (1.0)x Cash: $19.3 17E EV/EBITDA: 19.3x Acquired Weibo for $135mm in Sep-2016 Acquired Beijing Zhuoyi Xunchang Technology for $200mn in Jul-2016 MCap : $1.5 EV: $4.9 Leverage: 8.5x Cash: $0.1 17E EV/EBITDA: 8.3x Acquired Gilt Groupe for $250mm in Jan-2016 Acquired GALERIA Kaufhof GmbH for $2.7bn in Jun-2015 Acquired Saks for $2.9bn in Jul-2013 MCap : $0.6 EV: $0.7 Leverage: 1.3x Cash: $0.0 17E EV/EBITDA: 5.9x No recent M&A activities MCap : $60.8 EV: $55.7 Leverage: (2.1)x Cash: $1.7 17E EV/EBITDA: 19.2x Sold UberChina stake in Aug-2016 for undisclosed amount Sold Baidu Music for undisclosed amount in Dec-2015 MCap : $1.9 EV: $2.7 Leverage: 1.3x Cash: $0.1 17E EV/EBITDA: 4.6x No recent meaningful M&A activities Financial Sponsor / Quasi Strategic Buyer MCap : $40.2 EV: $39.3 LTM Leverage: 50.6x Cash: $3.7 17E EV/EBITDA: 41.1x Acquired Niuhai E-commerce for $2.9bn in Jul-2016 Acquired HotelVP in Jan-2014 for undisclosed amount Recent Transactions Company Key Statistics Dry Powder: $27.5 Bought Ideal Shopping Direct in Sep-2015for undisclosed amount Total Debt: $4.8 Cash: $0.4 Acquired mytheresa.com GmbH for $194mm in Sep-2014 MCap : $6.7 EV: $6.6 Leverage: (0.2)x Cash: $0.7 17E EV/EBITDA: 10.3x Acquired Ovation Entertainment for $56mn in Feb-2014 Acquired Lefeng.com for $133mn in Feb-2014 61 Source: Capital IQ as of February 3, 2017, Press Releases, News Articles. Note:LTM Leverage is calculated as LTM Net Debt/LTM EBITDA. Queen MCap : $8.8 Acquired zulily for LTM Leverage: 3.3x Cash: $0.3 17E EV/EBITDA: 7.6x
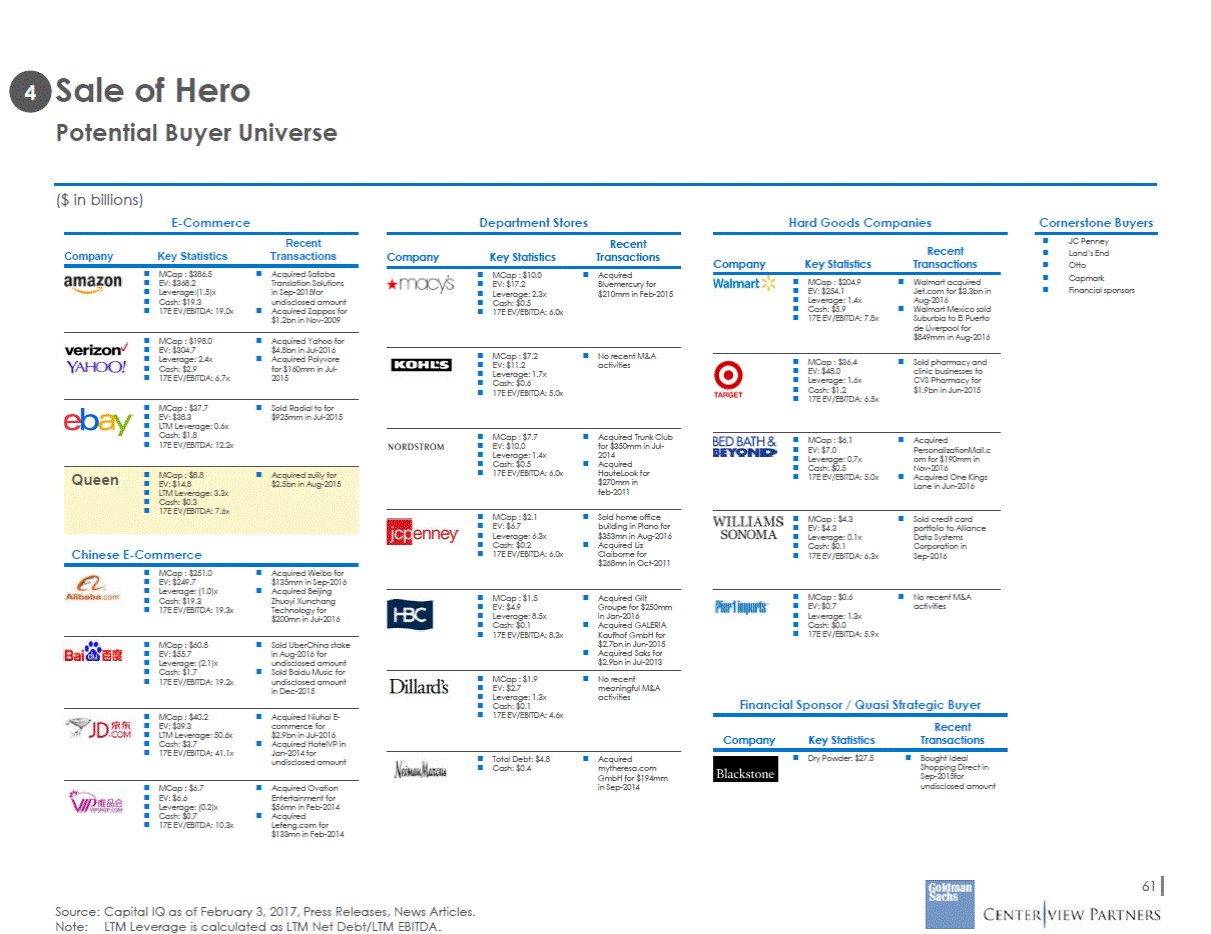
VIII. Process Considerations and Potential Next Steps
Key Next Steps and Potential Communication with Queen If Committee Decides to Focus on Standalone… Committee to message to Lion that the Company is focused on executing its long-term plan in the near-term Must consider ways Lion may respond – how might pressure be applied? If Committee Decides to Engage Further… Committee to reach out to Lion and indicate that preliminary work with advisors is completed and convey a willingness to listen Potential Next Communication with Queen Depending on proposal, may be early opportunity to use process leverage and extract concessions as a “price of admission” for further engagement Potentially convey inadequacy of current proposal against strength of the standalone plan Upon improved proposal, setup and control process that maintains/maximizes Hero leverage Formulate diligence / engagement plan that highlights Queen’s need for the asset Understand their assumptions and articulate other sources of value (e.g., dissipating headwinds, synergies, margin opportunities) Conduct thorough diligence on Queen to more fully evaluate proposal Potential Response to Formal Proposal and Engagement Primary leverage comes from the “walk away” option Additional leverage may come from either the threat of engaging with potentially interested 3rd parties or actually running a broader auction process (pre-signing market check) If Queen improves its proposal enough, Committee may move forward with deal and structure a go-shop process to explore higher value alternatives potentially with a “drag along” agreement with Queen (post-signing market check) Maximize Competitive Tension 63
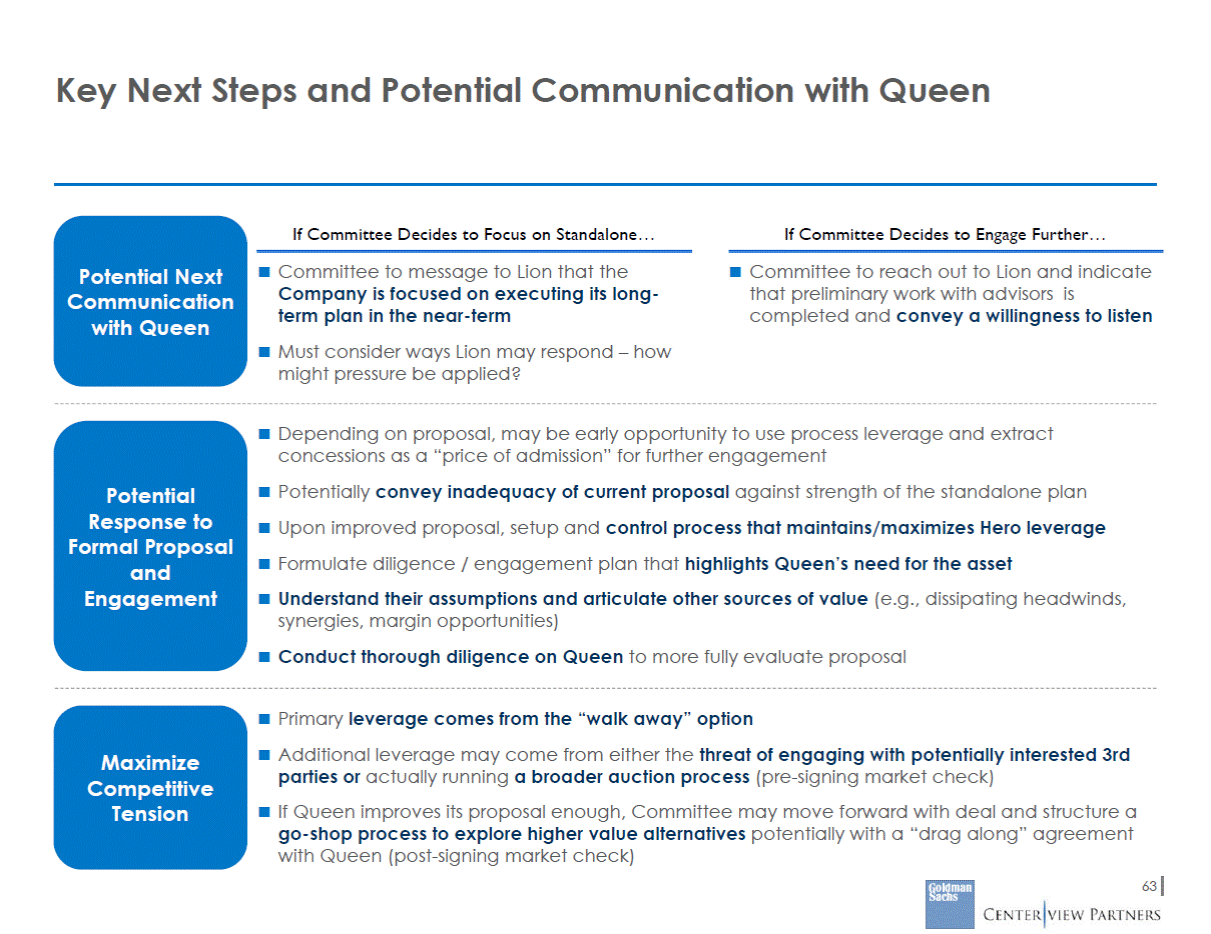
Appendix
Hero Projections Summary Projections imply 8.1% Adjusted EBITDA CAGR and 8.8% EPS CAGR from 2016A-2021E 65 Source: Hero Management. (1) (2) Adjusted EBITDA is before deduction of stock based compensation expense. Comparable EBITDA is after deduction of stock-based compensation expense. Historical 2014A2015A2016A HSN Revenue$2,476$2,542$2,475 Cornerstone Revenue1,1141,1511,095 (Less): Eliminations(2)(2)(2) Projections 2017P2018E2019E2020E2021E $2,549$2,626$2,704$2,785$2,869 1,0891,1621,2431,3161,390 (1)(1)(1)(1)(1) '14-'16A'16A-'21E CAGRCAGR (0.0%)3.0% (0.9%)4.9% Total Revenue$3,588$3,691$3,567 YoY Growth2.9%(3.3%) $3,637$3,786$3,946$4,100$4,257 1.9%4.1%4.2%3.9%3.8% (0.3%)3.6% Gross Profit$1,273$1,315$1,217 $1,251$1,316$1,383$1,447$1,513 (2.2%)4.5% % Margin35.5%35.6%34.1% 34.4%34.8%35.0%35.3%35.5% (Less): Operating Expenses($931)($957)($918) ($944)($970)($1,006)($1,039)($1,072) % of Sales25.9%25.9%25.7% 26.0%25.6%25.5%25.3%25.2% Adjusted EBITDA(1)$342$357$299 % Margin9.5%9.7%8.4% $307$346$377$408$441 8.4%9.1%9.5%9.9%10.4% (6.5%)8.1% (Less): D&A / FA Sale (44) (44) (43) (Less): SBC (16) (18) (19) (Less): Adjustments 2 (11) (31) Reported EBIT$285$284$206 (Less): Net Interest(7) (15)(16) Pre-Tax Income$278$269$190 (Less): Taxes (105) (100)(71) Net Income$173$169$119 Plus: Adjustments 0 6 20 Adjusted Net Income$173$176$138 (47)(49)(52)(56)(59) (21)(22)(22)(23)(24) ––––– $238$275$302$329$358 (15)(16)(17)(17)(17) $224$259$286$312$341 (84) (97) (107) (117)(128) $140$162$178$195$213 ––––– $140$162$178$195$213 (15.0%)11.7% (10.6%)9.0% Adjusted EPS$3.23$3.28$2.62 YoY Growth1.7%(20.3%) $2.62$3.03$3.34$3.65$3.99 0.1%15.7%10.3%9.4%9.1% (9.9%)8.8% Memo: Diluted Shares53.653.552.9 Tax Rate37.7%37.1%37.4% Comparable EBITDA(2) $327$339 $280 53.453.453.453.453.4 37.5%37.5%37.5%37.5%37.5% $286$324$354$385$417 (7.4%)8.3%
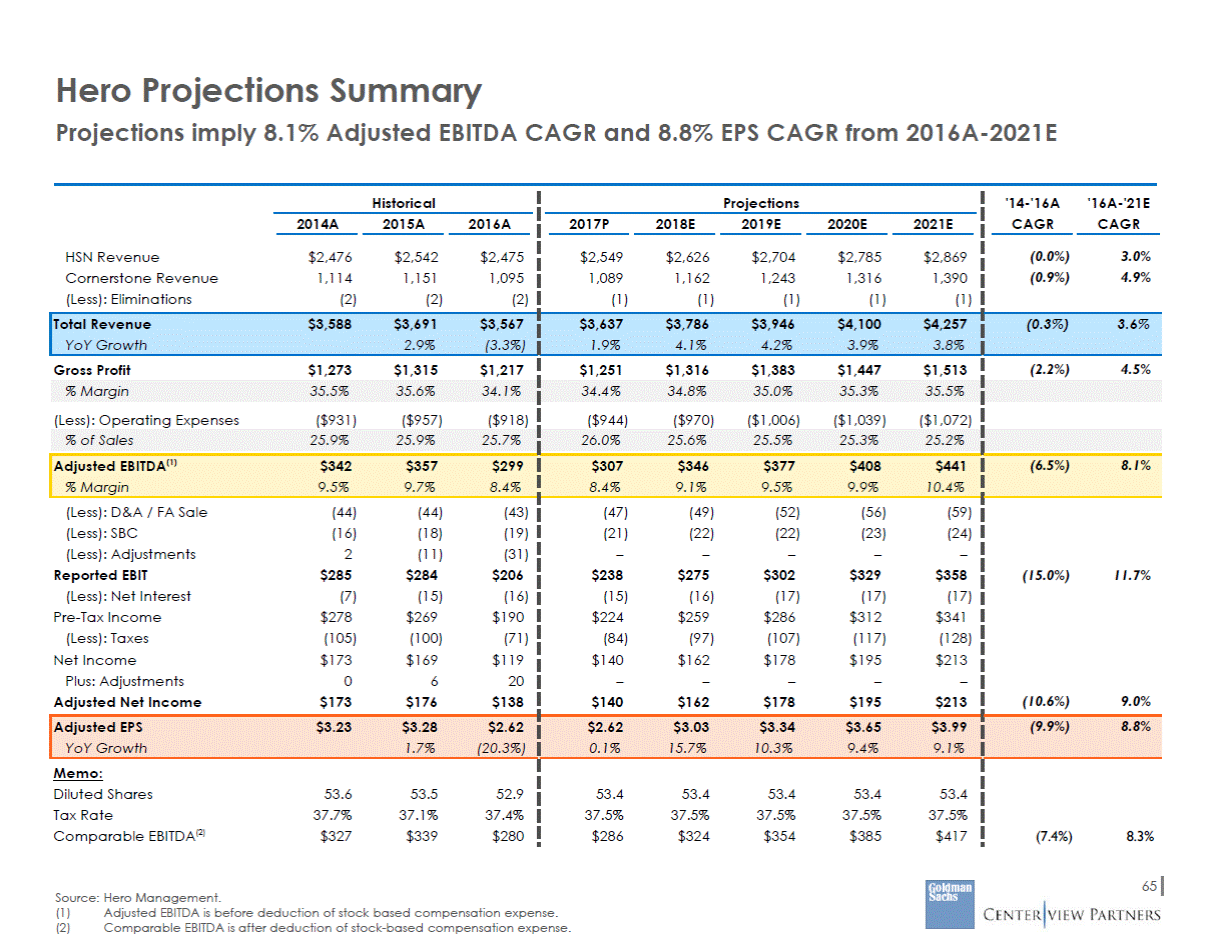
Illustrative Hero Discounted Cash Flow Analysis Reflects Hero Management Case Centerview Perspective Hero Standalone Unlevered Free Cash Flows Fiscal Year Ending December 31, 2016A 2017E 2018E 2019E 2020E 2021E Adjusted EBITDA (Less): Stock-Based Compensation Comparable EBITDA(1) (Less): D&A (Less): Loss on Sale of FA Adjusted EBIT (Less): Taxes Plus: D&A (Less): in Net Working Capital (Less): Capital Expenditures Plus: Loss on Sale of FA Unlevered Free Cash Flow YoY Growth $299 (19) $280 (43) (0) $237 $307 (21) $286 (47) (1) $238 (89) 47 (19) (59) 1 $118 $346 (22) $324 (48) (1) $275 (103) 48 (18) (82) 1 $122 3% $377 (22) $354 (51) (1) $302 (113) 51 (16) (84) 1 $141 16% $408 (23) $385 (55) (1) $329 (123) 55 (14) (80) 1 $168 19% $441 (24) $417 (58) (1) $358 (134) 58 (17) (73) 1 $193 15% Enterprise Value ($bn) Perpetuity Growth Rate Implied LTM Exit Multiple Perpetuity Growth Rate Value per Share ($) Perpetuity Growth Rate Discount Rate 1.0% 2.0% 3.0% 1.0% 2.0% 3.0% 1.0% 2.0% 3.0% 9.50% 10.00% 10.50% $2.3 2.2 2.1 $2.6 2.4 2.2 $2.9 2.7 2.5 6.5x 6.2x 5.9x 7.5x 7.0x 6.6x 8.7x 8.1x 7.6x $35.15 32.61 30.34 $39.79 36.67 33.91 $45.83 41.86 38.42 66 Source: Hero Management, Wall Street research, and Factset as of February 3, 2017. Note:Dollars in millions, unless otherwise noted. Assumes mid-year discounting convention. Balance sheet information as of December 31, 2016. (1) Comparable EBITDA is calculated after deduction of stock-based compensation expense .
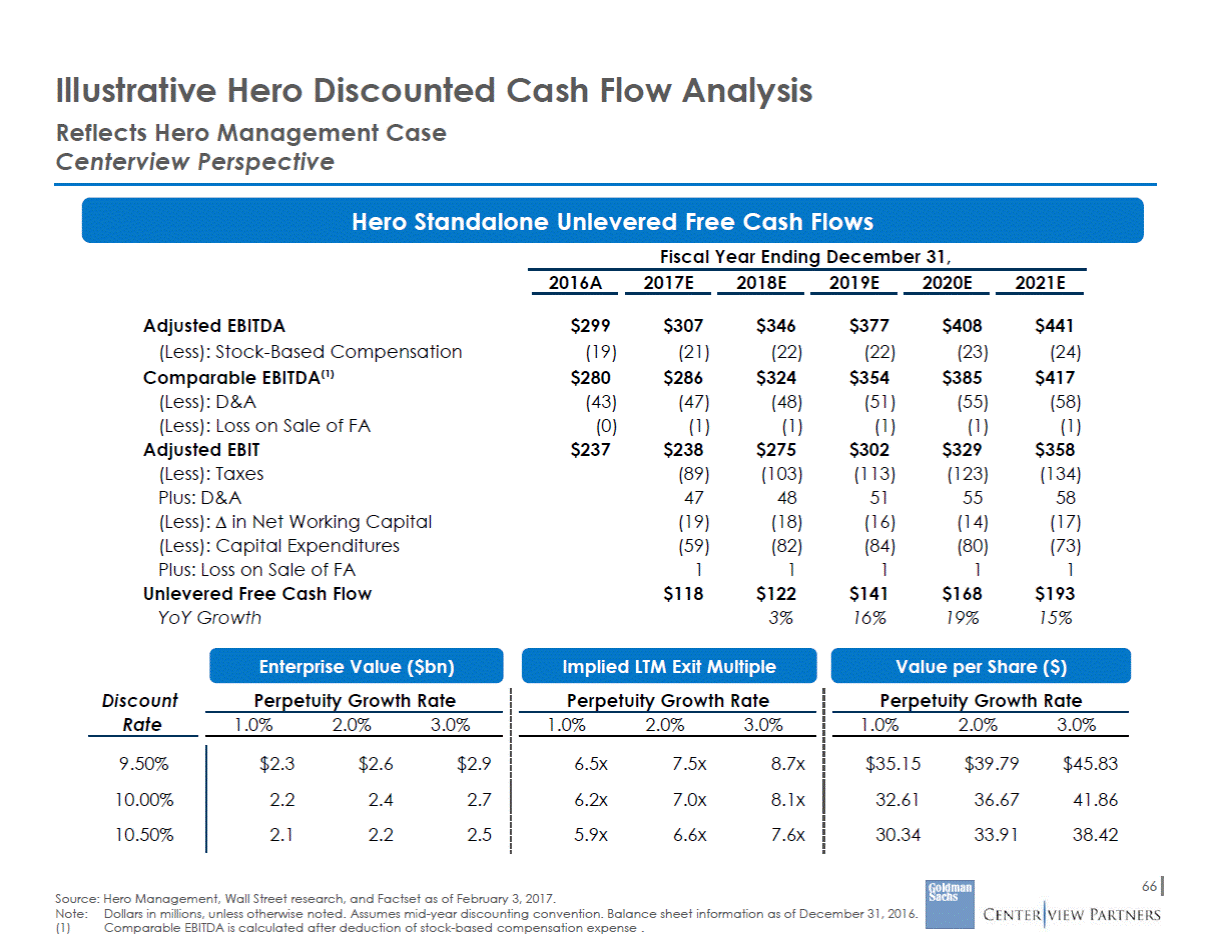
Illustrative Discounted Cash Flow Analysis Projected Unlevered Free Cash Flow & Terminal Value Goldman Sachs Perspective ($ in millions, except for per share data) Historical Management Projections Terminal Year 2014A $ 3,588 - 2015A $ 3,691 2.9 % 2016A $ 3,567 (3.3)% 2017E $ 3,637 1.9 % 2018E $ 3,786 4.1 % 2019E $ 3,946 4.2 % 2020E $ 4,100 3.9 % 2021E $ 4,257 3.8 % Revenue % Growth $ 4,343 2.0 % % Margin Stock-Based Compensation 9.7 % $ 16 9.7 % $ 18 8.4 % $ 19 8.4 % $ 21 9.1 % $ 22 9.5 % $ 22 9.9 % $ 23 10.4 % $ 24 10.4 % $ 24 % Margin Depreciation & Amortization Other Expenses¹ 9.2 % $ 44 (2) 9.2 % $ 43 12 7.8 % $ 43 31 7.9 % $ 47 1 8.6 % $ 48 1 9.0 % $ 51 1 9.4 % $ 55 1 9.8 % $ 58 1 9.8 % $ 59 - % Margin Less: Adjusted Tax Expense (37.5%) Plus: Depreciaton & Amortization Less: Capital Expenditures Less: Increase in NWC Plus: Other Non-Cash Items 8.1 % 7.7 % 5.8 % 6.6 % $ 89 47 59 19 1 7.3 % $ 103 48 82 18 1 7.7 % $ 113 51 84 16 1 8.0 % $ 123 55 80 14 1 8.4 % $ 134 58 73 17 1 8.4 % $ 137 59 66 7 - % of EBITDA 38.5 % 35.2 % 37.5 % 41.1 % 43.8 % 48.0 % Illustrative Terminal Value Assumed Perpetuity Growth Rate Illustrative WACC Terminal FCF 2.0 % 9.0 % $ 216 Terminal Value at Exit Implied Terminal Value LTM EBITDA Multiple $ 3,081 7.2 x Present Value of Terminval Value $ 2,090 Terminal Value % of Total Value (-) Net Financial Debt Equity Value Shares Outstanding (mm) 78.0 % $ 472 $ 2,207 53.47 Source: Hero Historical Financials and Projections. Note: Cash flows discounted to 01-Jan-2017 using mid-year convention for cash flows. Share price based on diluted shares outstanding. Implied EBITDA multiples based on adjusted EBITDA (post-SBC). Includes loss on sale of FA. Does burden EBIT with stock-based compensation expense. 67 (1) (2) Illustrative Implied Equity Value per Share $ 41.27 Total DCF Value $ 2,679 $ 216 $ 118 $ 122 $ 141 $ 168 $ 193 Unlevered Free Cash Flow $ 366 $ 238 $ 275 $ 302 $ 329 $ 358 EBIT² $ 290 $ 284 $ 206 $ 425 $ 286 $ 324 $ 354 $ 385 $ 417 Adj. EBITDA (post-SBC) $ 332 $ 339 $ 280 $ 449 $ 307 $ 346 $ 377 $ 408 $ 441 Adj. EBITDA (pre-SBC) $ 347 $ 357 $ 299
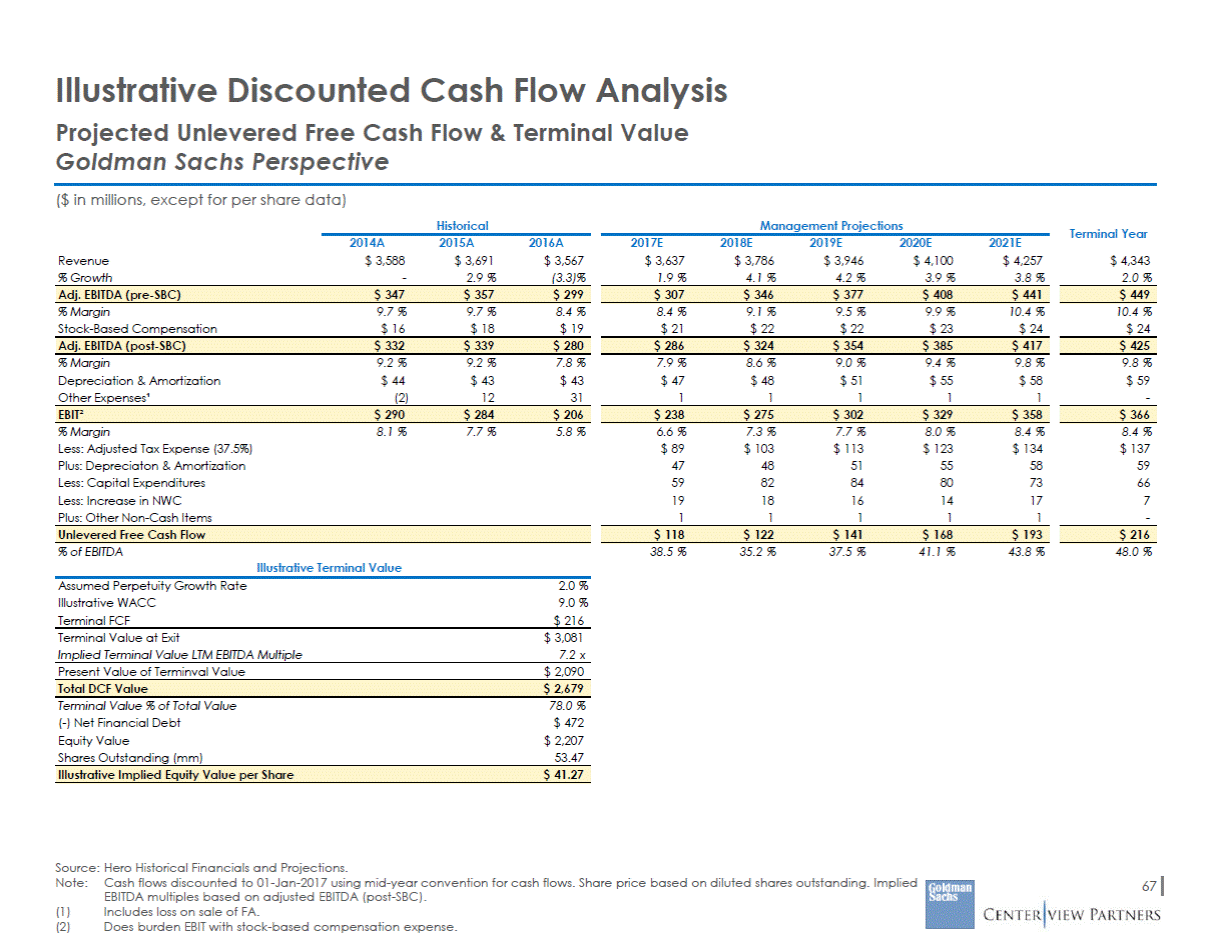
Illustrative Discounted Cash Flow Implied Value Per Share of Hero Goldman Sachs Perspectives Sensitivities ($ in millions, except for per share data) Enterprise Value Value per Share 1.5 % 2.0 % 2.5 % 1.5 % 2.0 % 2.5 % 8.0 % 8.0 % 9.0 % 9.0 % 10.0 % 10.0 % Implied Exit LTM EBITDA Multiple(1) % of EV from Terminal Value 1.5 % 2.0 % 2.5 % 1.5 % 2.0 % 2.5 % 8.0 % 8.0 % 9.0 % 9.0 % 10.0 % 10.0 % 68 Source: Hero Projections. Note:Free cash flow discounted to 01-Jan-2017 using mid-year convention for cash flows. Terminal value calculated as of 2021E. (1) Calculated as terminal value at exit divided by terminal year adjusted EBITDA (post-SBC). 7.9 x 8.5 x 9.1 x 6.9 x 7.2 x 7.7 x 6.1 x 6.3 x 6.7 x WACC 79.7 % 80.8 % 82.0 % 77.0 % 78.0 % 79.1 % 74.4 % 75.3 % 76.3 % WACC Perpetuity Growth Rate Perpetuity Growth Rate $ 46.70 $ 49.81 $ 53.48 $ 39.05 $ 41.27 $ 43.82 $ 33.17 $ 34.78 $ 36.61 WACC $ 2,973 $ 3,145 $ 3,348 $ 2,560 $ 2,679 $ 2,817 $ 2,244 $ 2,330 $ 2,428 WACC Perpetuity Growth Rate Perpetuity Growth Rate
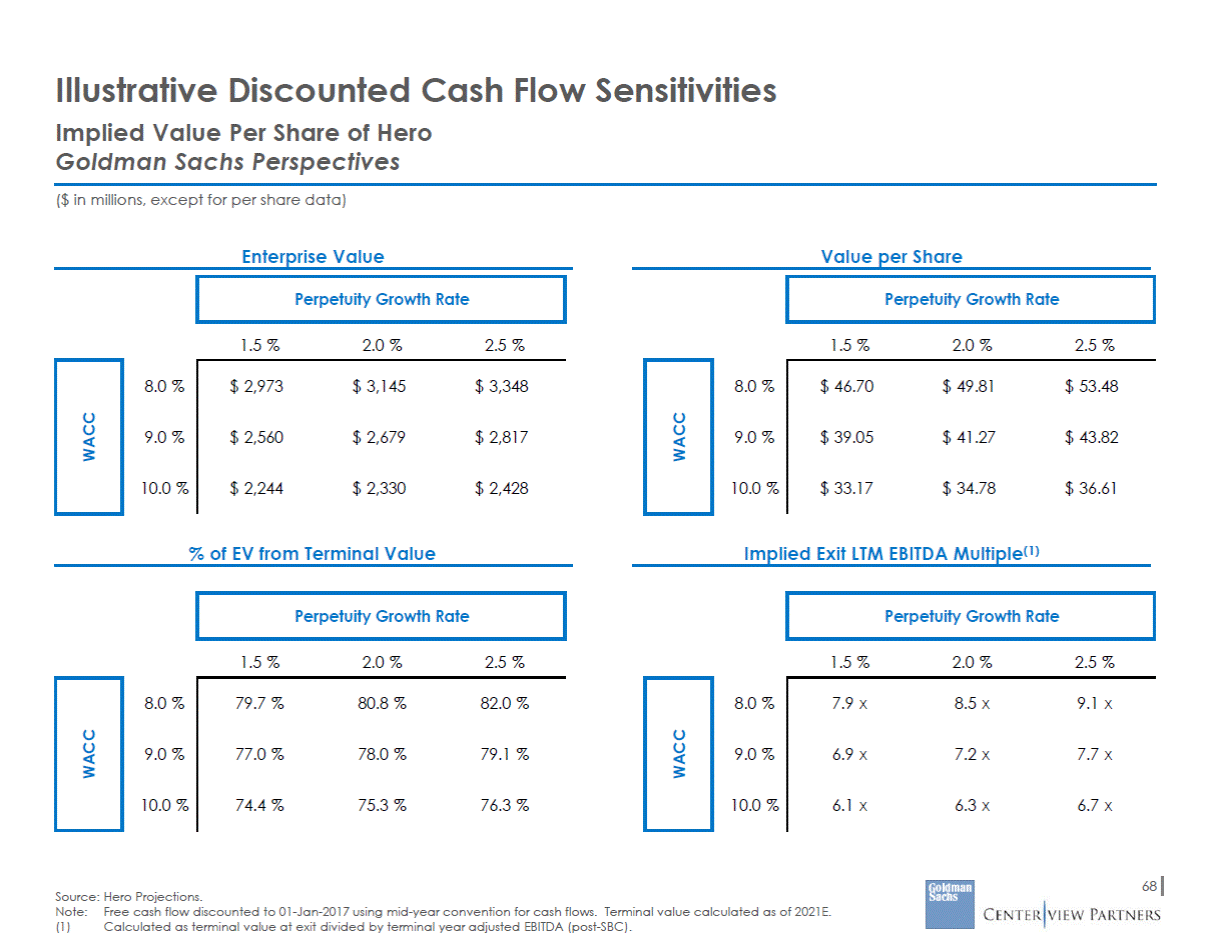
Select Transaction Multiples Specialty Retail Home Stores Department / Mass EV / LTM EBITDA Date Target Acquiror TEV Source: Company filings, Wall Street research. Note:Based on select retail transactions with TEV above $0.5bn since 1/1/2010. Excludes transactions where public information to calculate EV / LTM EBITDA is unavailable: Perry Corp / Barney’s New York, AEA Investors / At Home Group, Avon / Silpada Designs, Bain Capital / Bob’s Discount Furniture, Berkshire Hathaway / Oriental Trading Co., Wal-Mart / Jet.com, Hudson’s Bay / Gilt Groupe, Investor Group / eBay Enterprise , Ahold / Bol.com, Naspers Limited / Markafoni, Amazon.com / Quidsj, Rakuten / Price Minister. 69 25th Percentile 7.2x Median 9.4x 75th Percentile 11.8x Feb-14 Zale Corporation Signet Jewelers $1,174 15.6x May-12 Cost Plus Bed Bath & Beyond 682 12.7x Feb-13 Office Max Office Depot 1,789 12.2x Feb-16 Rona Lowe's 2,285 12.1x Oct-16 Cabela's Bass Pro Shop 5,649 11.8x May-12 Charming Shoppes Ascena Retail Group 828 9.9x Jul-13 Saks Hudson's Bay 2,614 9.8x Sep-13 Neiman Marcus CPP / Ares 6,000 9.4x Nov-15 Petco CVC, CPP 4,600 9.4x Dec-14 PetSmart BC Partners; GIC, Others 8,702 9.1x May-15 ANN Inc. Ascena Retail Group 2,072 8.6x Dec-13 Nine West Sycamore Partners 2,154 8.0x Dec-10 Jo-Ann Stores Leonard Green & Partners, L.P 1,529 7.2x Nov-12 Oriental Trading Co Berkshire Hathaway 500 7.1x Aug-15 Belk Sycamore 2,867 6.9x Nov-12 The Brick Leon's Furniture 784 6.8x Sep-14 Bluestem Brands Capmark Financial Group 565 6.3x
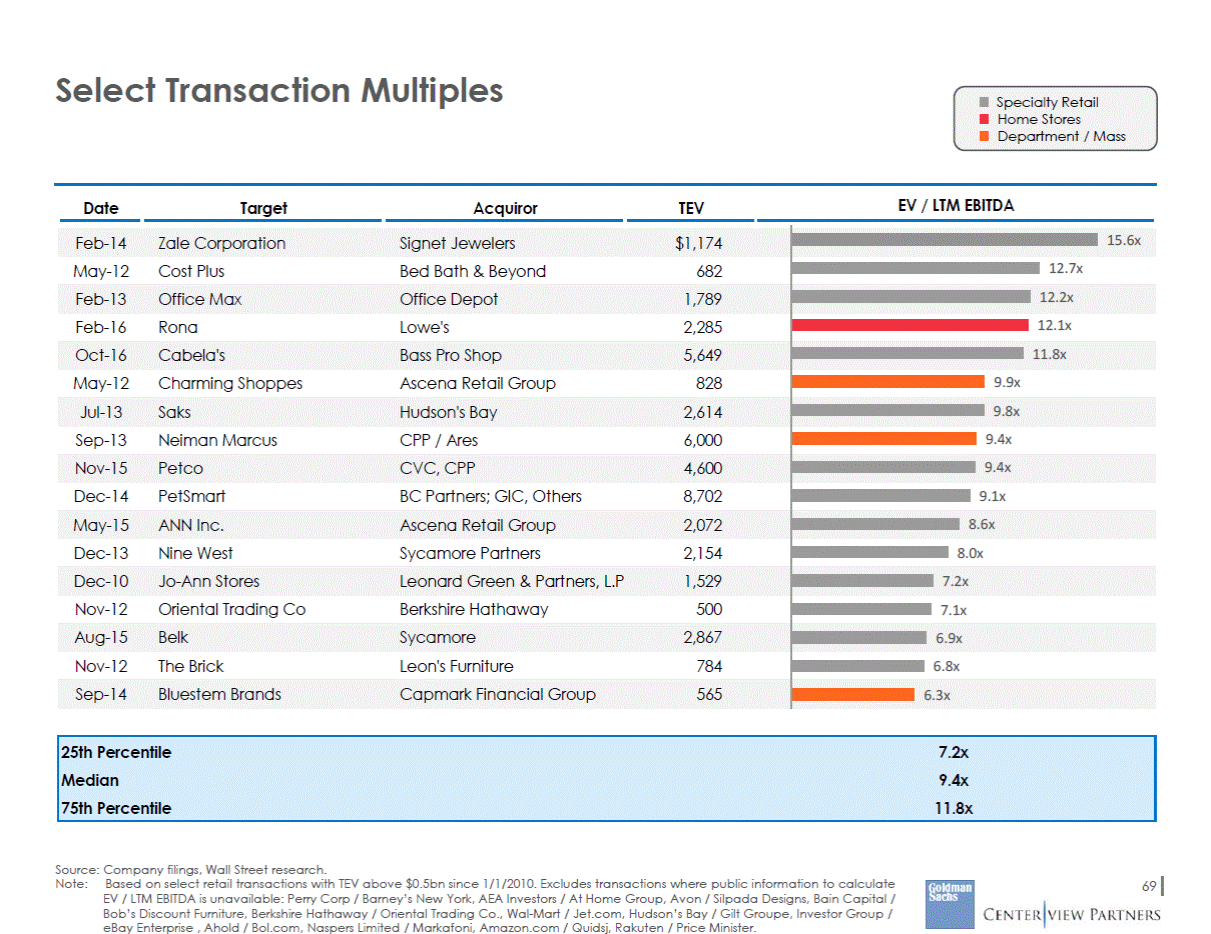
Acquisition Premia for U.S. Precedent Transactions Last 5 Year Date Range | U.S. Targets with $1bn to $5bn EV Goldman Sachs Perspective Median Acquisition Premia for All Stock Deals(1) 25th Percentile Median 75th Percentile 49.1 % 18.3 % 9.3 % 6.3 % 3.5 % 1 Day 1 Week 1 Month 1 Day 1 Week 1 Month 1 Day 1 Week 1 Month Median Acquisition Premia for All Cash Deals(2) 25th Percentile Median 75th Percentile 47.7 % 49.3 % 44.2 % 34.7 % 30.9 % 29.3 % 22.9 % 20.5 % 17.8 % 1 Day 1 Week 1 Month 1 Day 1 Week 1 Month 1 Day 1 Week 1 Month 70 Source: Thomson Financial Securities Data as of February 3, 2017. (1) (2) Includes 28 all-stock deals. Includes 170 all-cash deals. 0.7 % 12.8 % 34.5 % 26.5 %
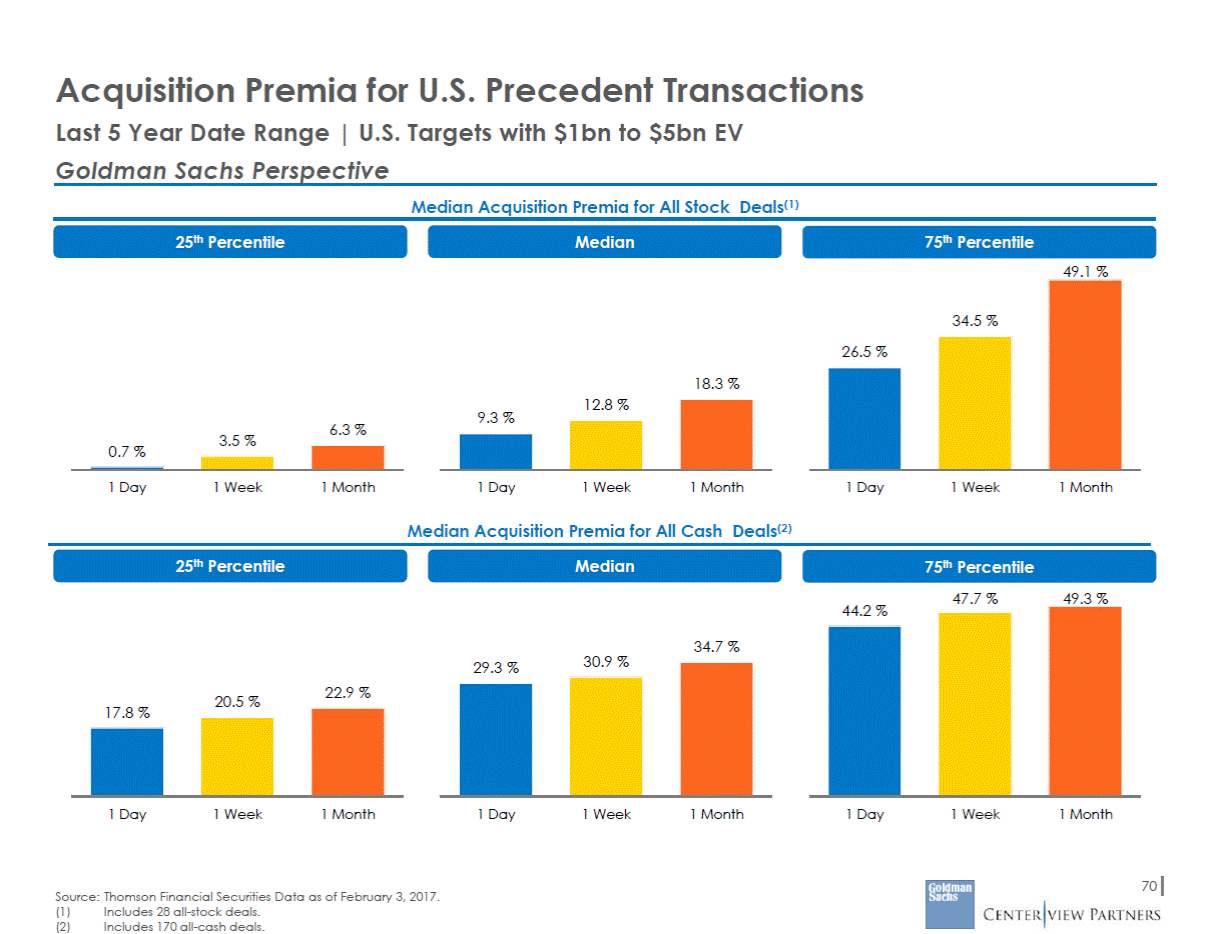
Queen Standalone Street Financials Historical Street Projections CAGR 2014A 2015A 2016E 2017E 2018E 2019E 2020E 2021E '14-16E '16-21E Gross Profit $3,650 $3,322 $3,377 $3,439 $3,585 $3,768 $3,941 $4,118 (3.8%) 4.0% (Less): Operating Expenses ($1,711) ($1,435) ($1,457) ($1,425) ($1,438) ($1,435) ($1,509) ($1,544) (Less): Stock-Based Comp. (Less): D&A (Less): Other Reported EBIT Plus: Equity Earnings / Other (Less): Net Interest Expense Pre-Tax Income (Less): Taxes Net Income (Less): NCI & Other Net Income to Queen Plus: Adjustments Adjusted Net Income to Queen (83) (587) (7) $1,262 (14) (312) $936 (306) $630 (54) $576 219 $795 (60) (657) – $1,170 91 (283) $978 (304) $674 (34) $640 238 $878 (67) (883) – $970 36 (291) $715 (250) $465 (26) $438 350 $789 (69) (709) – $1,235 43 (281) $997 (349) $648 (37) $611 254 $865 (73) (451) – $1,623 52 (285) $1,389 (486) $903 (51) $852 115 $967 (77) (311) – $1,946 58 (282) $1,722 (603) $1,119 (64) $1,055 64 $1,119 (80) (281) – $2,071 64 (274) $1,861 (651) $1,210 (69) $1,141 39 $1,180 (84) (273) – $2,217 71 (262) $2,026 (709) $1,317 (75) $1,242 29 $1,271 (12.3%) 18.0% (0.4%) 10.0% Memo: Comparable EBITDA(2) $1,856 $1,827 $1,853 $1,944 $2,073 $2,257 $2,352 $2,490 (0.1%) 6.1% 71 Source: Wall Street research. (1) (2) Adjusted EBITDA is before deduction of stock based compensation expense. Comparable EBITDA is after deduction of stock-based compensation expense. Adjusted Diluted EPS$1.68$1.80$1.67$1.97$2.37$2.94$3.30$3.75(0.3%)17.6% YoY Growth7.5%(7.5%)17.9%20.8%23.9%12.0%13.9% Adjusted EBITDA(1)$1,939$1,887$1,920$2,014$2,146$2,333$2,432$2,574(0.5%)6.0% % Margin19.3%20.6%18.6%18.9%19.2%19.8%19.7%20.0% % of Sales17.1%15.7%14.1%13.4%12.8%12.2%12.3%12.0% % Margin36.4%36.2%32.7%32.2%32.0%32.0%32.0%32.0% Revenue$10,028$9,169$10,314$10,664$11,196$11,776$12,315$12,8691.4%4.5% YoY Growth(8.6%)12.5%3.4%5.0%5.2%4.6%4.5%
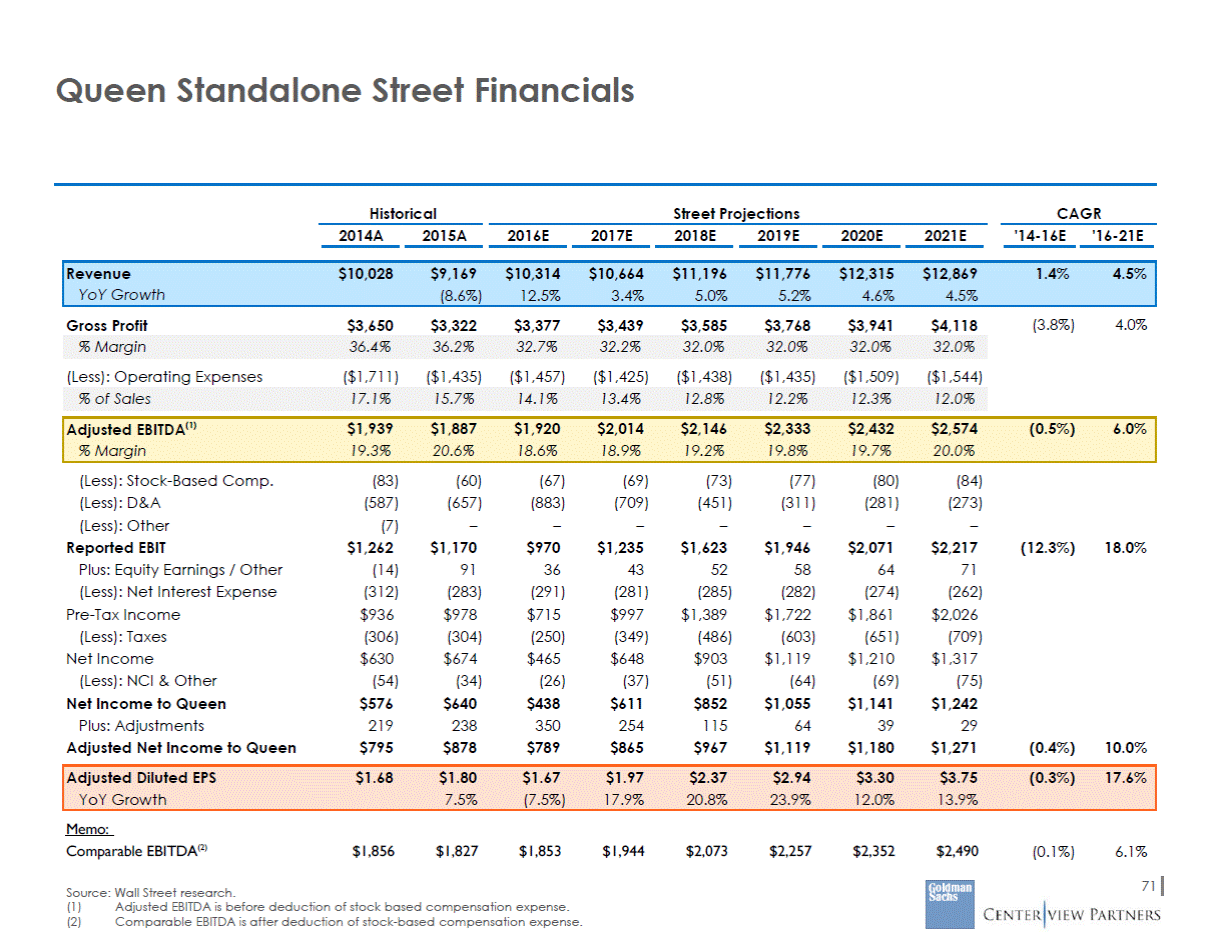
Illustrative Public Market Present Value of Future Share Price Analysis Based on Queen Street Projections Based on 1 Year Forward EV/EBITDA Multiples | Goldman Sachs Perspective Present Value of Future Stock Price + Dividends at 11.5% Cost of Equity Future Value of Share Price $ 46.55 $ 41.96 $ 39.87 $ 35.42 $ 34.72 $ 30.37 $ 38.62 $ 30.11 $ 27.15 $ 28.76 $ 25.55 $ 28.25 $ 24.21 $ 27.93 $ 24.42 $ 32.14 $ 25.34 $ 21.71 $ 27.15 $ 24.99 $ 23.19 $ 21.84 $ 18.75 $ 18.75 $ 21.21 $ 19.02 Current 1/1/2018 1/1/2019 1/1/2020 1/1/2021 Current 1/1/2018 1/1/2019 1/1/2020 1/1/2021 7.0x Forward EV/EBITDA 7.6x Forward EV/EBITDA 8.5x Forward EV/EBITDA Jan-2018E Jan-2019E Jan-2020E Jan-2021E 1-Yr Forward EBITDA $ 2,073 $ 2,257 $ 2,352 $ 2,490 Net Debt1 $ 5,625 $ 5,317 $ 4,921 $ 4,438 Diluted Shares Outstanding (mm) 421.7 392.4 368.1 347.4 - - - - Dividends Per Share Source: Wall Street projections supplemented with extrapolated historical financial trends, Factset as of as of February 3, 2017 Note:Present Value of Future Stock Price includes dividends discounted based on mid-year convention. Future share prices and dividends discounted to 1/1/2017. 72 (1) Includes non-financial adjustments related to noncontrolling interest and equity investments.
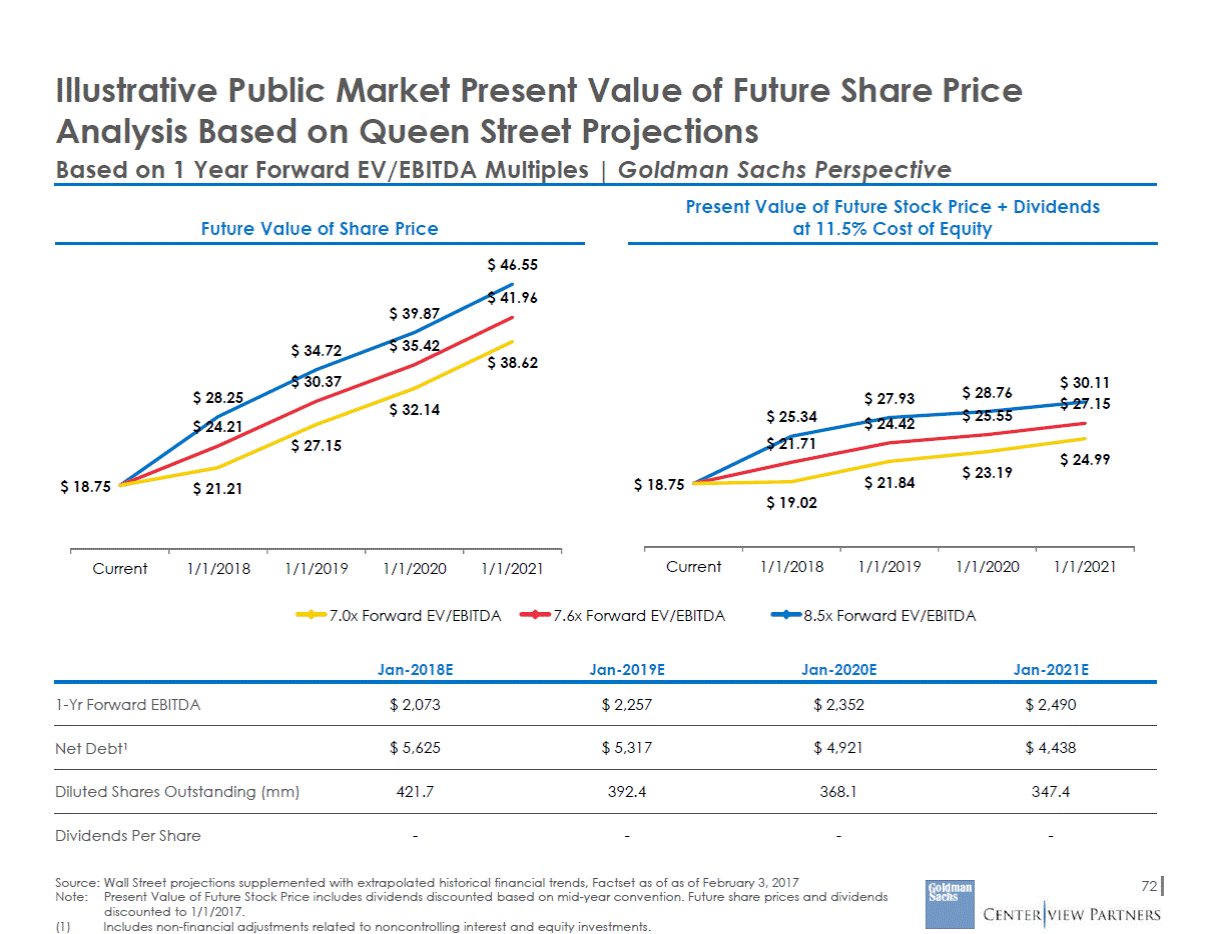
Illustrative Queen Discounted Cash Flow Analysis Based on Street Expectations Centerview Perspective Queen Standalone Unlevered Free Cash Flows Fiscal Year Ending December 31, 2016A 2017E 2018E 2019E 2020E 2021E Adjusted EBITDA (Less): Stock-Based Compensation Comparable EBITDA(1) (Less): D&A (Excluding Trans. Amort.) Adjusted EBIT (Less): Taxes Plus: D&A (Exluding Trans. Amort.) (Less): in Net Working Capital (Less): Capital Expenditures Unlevered Free Cash Flow YoY Growth $1,920 (67) $1,853 (344) $1,509 $2,014 (69) $1,944 (319) $1,625 (569) 319 (68) (245) $1,062 $2,146 (73) $2,073 (274) $1,800 (630) 274 (94) (258) $1,092 2.8% $2,333 (77) $2,257 (213) $2,044 (715) 213 (102) (271) $1,169 7.0% $2,432 (80) $2,352 (221) $2,131 (746) 221 (88) (283) $1,234 5.6% $2,574 (84) $2,490 (229) $2,261 (791) 229 (103) (296) $1,300 5.3% Enterprise Value ($bn) Perpetuity Growth Rate Implied LTM Exit Multiple Perpetuity Growth Rate Value per Share ($) Perpetuity Growth Rate Discount Rate 1.0% 2.0% 3.0% 1.0% 2.0% 3.0% 1.0% 2.0% 3.0% 9.0% 9.5% 10.0% $16.1 15.1 14.3 $17.8 16.6 15.6 $20.1 18.6 17.3 7.0x 6.6x 6.3x 8.1x 7.6x 7.1x 9.5x 8.8x 8.2x $21.54 19.59 17.80 $25.05 22.69 20.62 $29.73 26.66 24.03 73 Source: Wall Street research and Factset as of February 3, 2017. Note:Dollars in millions, unless otherwise noted. Assumes mid-year discounting convention. Balance sheet information as of September 30, 2016. (1) Comparable EBITDA is calculated after deduction of stock-based compensation expense .
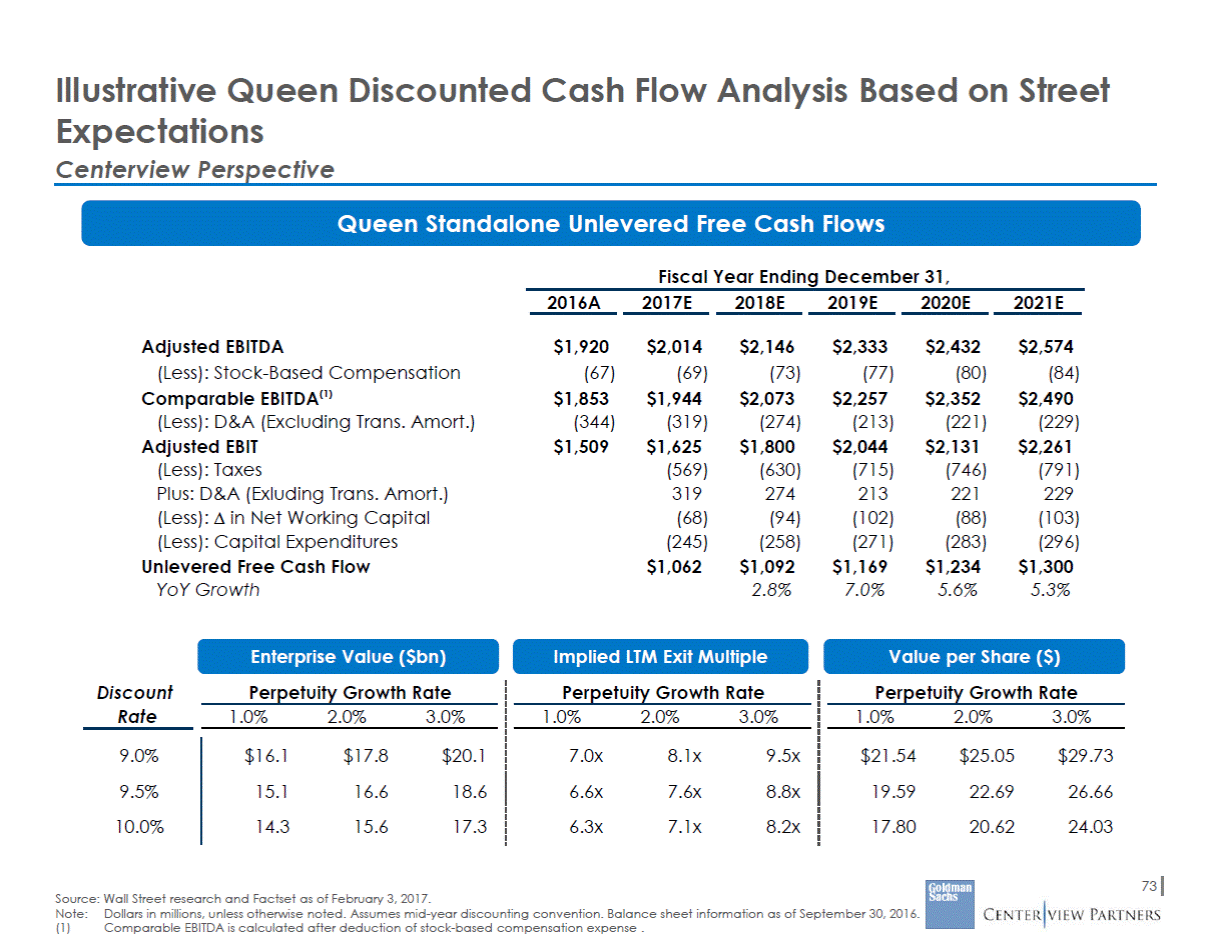
Illustrative Discounted Cash Flow Analysis Projected Unlevered Free Cash Flow & Terminal Value Goldman Sachs Perspective ($ in millions, except for per share data) Historical Management Projections Terminal Year $ 13,126 2.0 % 2014A $ 10,028 - 2015A $ 9,169 (8.6)% 2016A $ 10,314 12.5 % 2017E $ 10,664 3.4 % 2018E $ 11,196 5.0 % 2019E $ 11,776 5.2 % 2020E $ 12,315 4.6 % 2021E $ 12,869 4.5 % Revenue % Growth % Margin Stock-Based Compensation 19.3 % $ 83 20.6 % $ 60 18.6 % $ 67 18.9 % $ 69 19.2 % $ 73 19.8 % $ 77 19.7 % $ 80 20.0 % $ 84 20.0 % $ 85 % Margin Depreciation Amortization 18.5 % $ 148 $ 129 19.9 % $ 140 $ 138 18.0 % $ 191 $ 153 18.2 % $ 196 $ 123 18.5 % $ 204 $ 70 19.2 % $ 213 - 19.1 % $ 221 - 19.4 % $ 229 - 19.4 % $ 234 - % Margin Less: Adjusted Tax Expense (35%) Plus: Depreciaton Plus: Amortization Less: Capital Expenditures Less: Increase in NWC 15.7 % 16.9 % 14.6 % 15.2 % $ 569 196 123 245 68 16.1 % $ 630 204 70 258 94 17.4 % $ 715 213 - 271 102 17.3 % $ 746 221 - 283 88 17.6 % $ 791 229 - 296 103 17.6 % $ 807 234 - 262 27 % of Adjusted EBITDA 52.8 % 50.9 % 50.1 % 50.8 % 50.5 % 55.0 % Illustrative Terminal Value Assumed Perpetuity Growth Rate Illustrative WACC Terminal FCF 2.0 % 9.0 % $ 1,443 Terminal Value at Exit Implied Terminal Value LTM EBITDA Multiple $ 20,618 8.1 x Present Value of Terminval Value $ 13,990 Terminal Value % of Total Value (-) Net Debt (-) Noncontrolling Interest (+) Queen Chinese Joint Venture (+) Queen Stake in Hero Equity Value Shares Outstanding (mm) 74.8 % $ 6,062 $ 836 $ 242 $ 694 $ 12,742 465.36 Source: Queen historical financials and Wall Street projections supplemented with extrapolated historical financial trends, Factset as of as of February 3, 2017. Implied EBITDA multiples based on adjusted EBITDA (post-SBC). Note:Cash flows discounted to 01-Jan-2017 using mid-year convention for cash flows. 74 (1) Includes adjustments for equity associates and noncontrolling interest. Illustrative Implied Equity Value per Share $ 27.38 Total DCF Value $ 18,705 $ 1,443 Unlevered Free Cash Flow $ 1,062 $ 1,092 $ 1,169 $ 1,234 $ 1,300 $ 2,306 EBIT $ 1,571 $ 1,549 $ 1,509 $ 1,625 $ 1,800 $ 2,044 $ 2,131 $ 2,261 $ 2,540 Adj. EBITDA (post-SBC) $ 1,855 $ 1,827 $ 1,853 $ 1,944 $ 2,073 $ 2,257 $ 2,352 $ 2,490 $ 2,625 Adj. EBITDA (pre-SBC) $ 1,938 $ 1,887 $ 1,920 $ 2,014 $ 2,146 $ 2,333 $ 2,432 $ 2,574
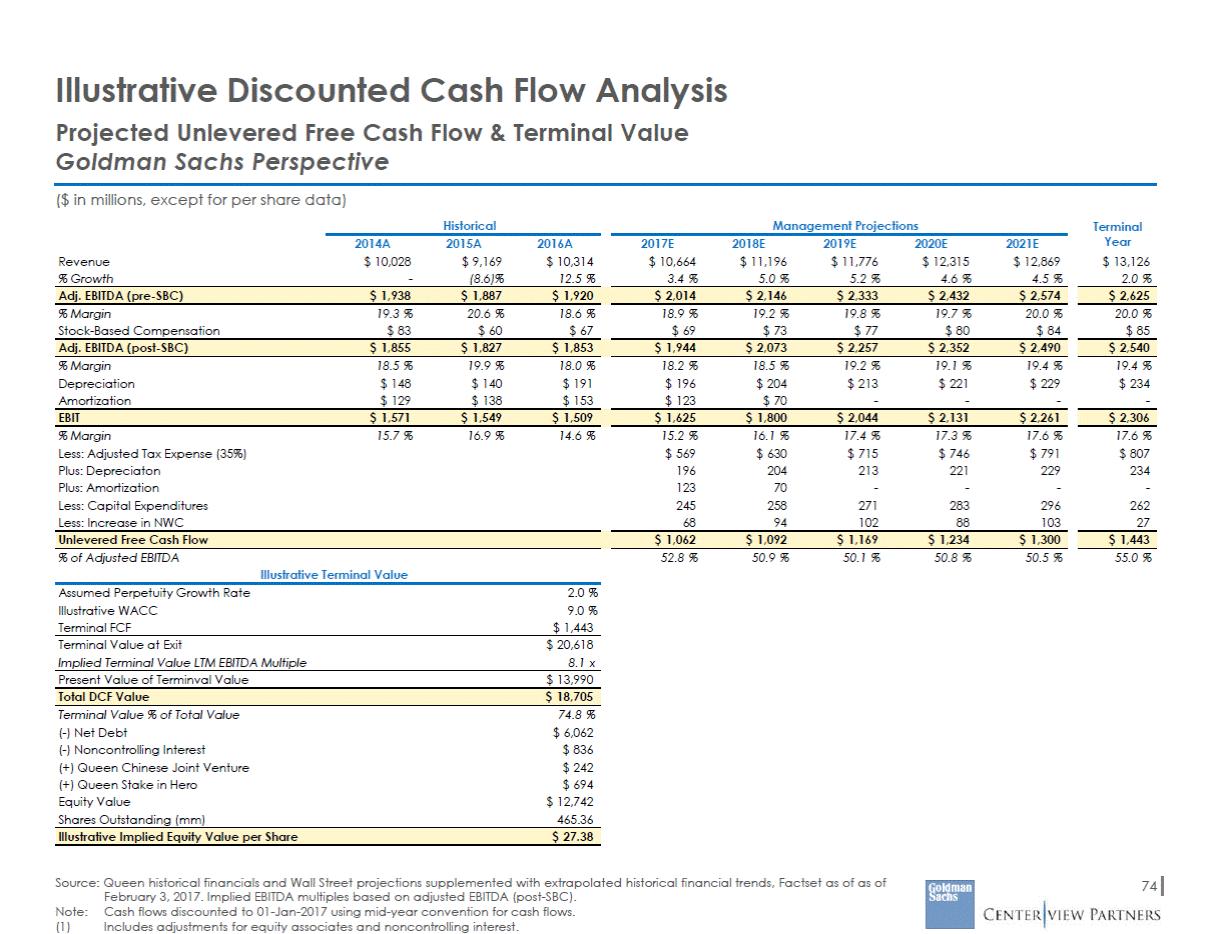
Illustrative Discounted Cash Flow Implied Value Per Share of Queen Goldman Sachs Perspective Sensitivities ($ in millions, except for per share data) Enterprise Value Value per Share 1.5 % 2.0 % 2.5 % 1.5 % 2.0 % 2.5 % 8.0 % 8.0 % 9.0 % 9.0 % 10.0 % 10.0 % Implied Exit LTM EBITDA Multiple(1) % of EV from Terminal Value 1.5 % 2.0 % 2.5 % 1.5 % 2.0 % 2.5 % 8.0 % 8.0 % 9.0 % 9.0 % 10.0 % 10.0 % 75 Source: Wall Street projections supplemented with extrapolated historical financial trends, Factset as of as of February 3, 2017. Note:Free cash flow discounted to 01-Jan-2017 using mid-year convention for cash flows. Terminal value calculated as of 2021E. (1) Calculated as terminal value at exit divided by terminal year adjusted EBITDA (post-SBC). 8.8 x 9.5 x 10.2 x 7.6 x 8.1 x 8.7 x 6.7 x 7.1 x 7.5 x WACC 76.6 % 77.9 % 79.3 % 73.6 % 74.8 % 76.1 % 70.7 % 71.8 % 73.0 % WACC Perpetuity Growth Rate Perpetuity Growth Rate $ 31.24 $ 33.77 $ 36.75 $ 25.59 $ 27.38 $ 29.44 $ 21.27 $ 22.58 $ 24.07 WACC $ 20,598 $ 21,835 $ 23,297 $ 17,832 $ 18,705 $ 19,712 $ 15,720 $ 16,360 $ 17,086 WACC Perpetuity Growth Rate Perpetuity Growth Rate
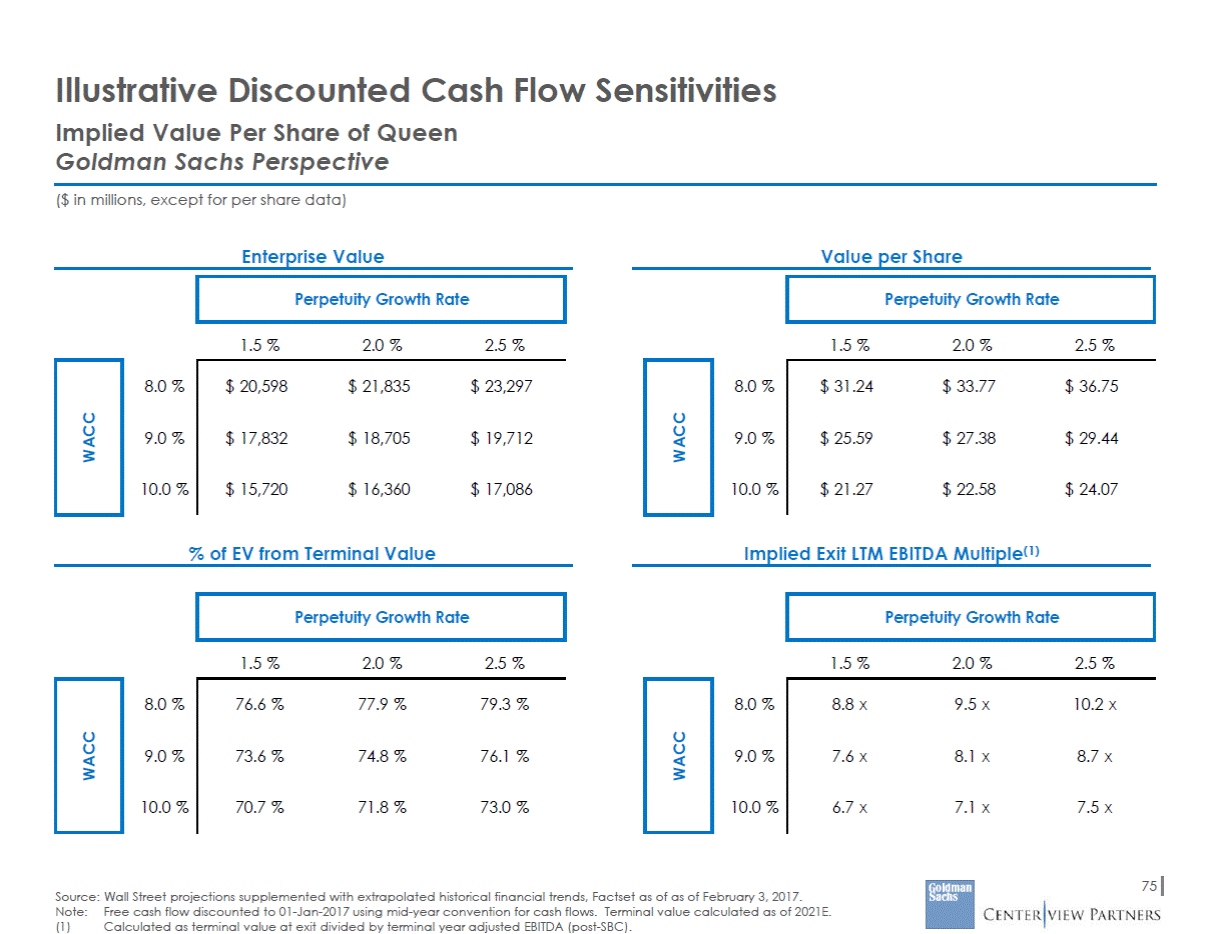
Pro Forma Combination Financials Assumes 2x exchange ratio and $125mm of run-rate synergies; excludes the impact of additional purchase accounting amortization created through a transaction Fiscal Year Ending December 31, '16A-'21E CAGR 2016A 2017E 2018E 2019E 2020E 2021E Queen Revenue Hero Revenue Revenue Synergies $10,314 3,567 – $10,664 3,637 – $11,196 3,786 – $11,776 3,946 – $12,315 4,100 – $12,869 4,257 – 4.5% 3.6% Memo: Hero S/A Growth 1.9% 4.1% 4.2% 3.9% 3.8% Queen Adjusted EBITDA Hero Adjusted EBITDA Net Synergies (Including Cost to Achieve) $1,920 299 – $2,014 307 (25) $2,146 346 25 $2,333 377 125 $2,432 408 125 $2,574 441 125 6.0% 8.1% Memo: Hero Standalone Margin (Less): Stock Based Compensation (Less): D&A / Other (Less): Equity Losses in Affiliates (Less): Interest Expense Pre-tax Income (Less): Taxes (Less): NCI Net Income To Queen Shareholders Plus: Adjustments 8.4% 8.4% (90) (756) (9) (299) $1,141 (404) (37) $700 270 9.1% (94) (500) (9) (310) $1,604 (567) (51) $985 139 9.5% (99) (363) (9) (311) $2,053 (725) (64) $1,264 64 9.9% (103) (336) (9) (305) $2,211 (782) (69) $1,361 39 10.4% (107) (332) (9) (292) $2,399 (848) (75) $1,476 29 Source: Hero Management. Note:For illustrative purposes, assumes $125mm of run-rate synergies phased in 0% in 2017E, 50% in 2018E, and 100% thereafter. Cost to achieve synergies equal to 50% of run-rate synergies and incurred 40% in 2017E and 60% in 2018E. 76 (1) Adjusted EBITDA is before deduction of stock based compensation expense. Adjusted EPS$1.93$2.43$3.08$3.46$3.95 Accretion / (Dilution) - $(0.04)0.050.130.170.19 Accretion / (Dilution) - %(1.9%)2.2%4.6%5.0%5.2% Adjusted Net Income to Queen Shareholders$970$1,124$1,327$1,400$1,505 Pro Forma Adjusted EBITDA(1)$2,219$2,296$2,517$2,835$2,964$3,1397.2% % Margin16.0%16.1%16.8%18.0%18.1%18.3% Pro Forma Revenue$13,882$14,301$14,982$15,722$16,414$17,1264.3% % YoY Growth3.0%4.8%4.9%4.4%4.3%
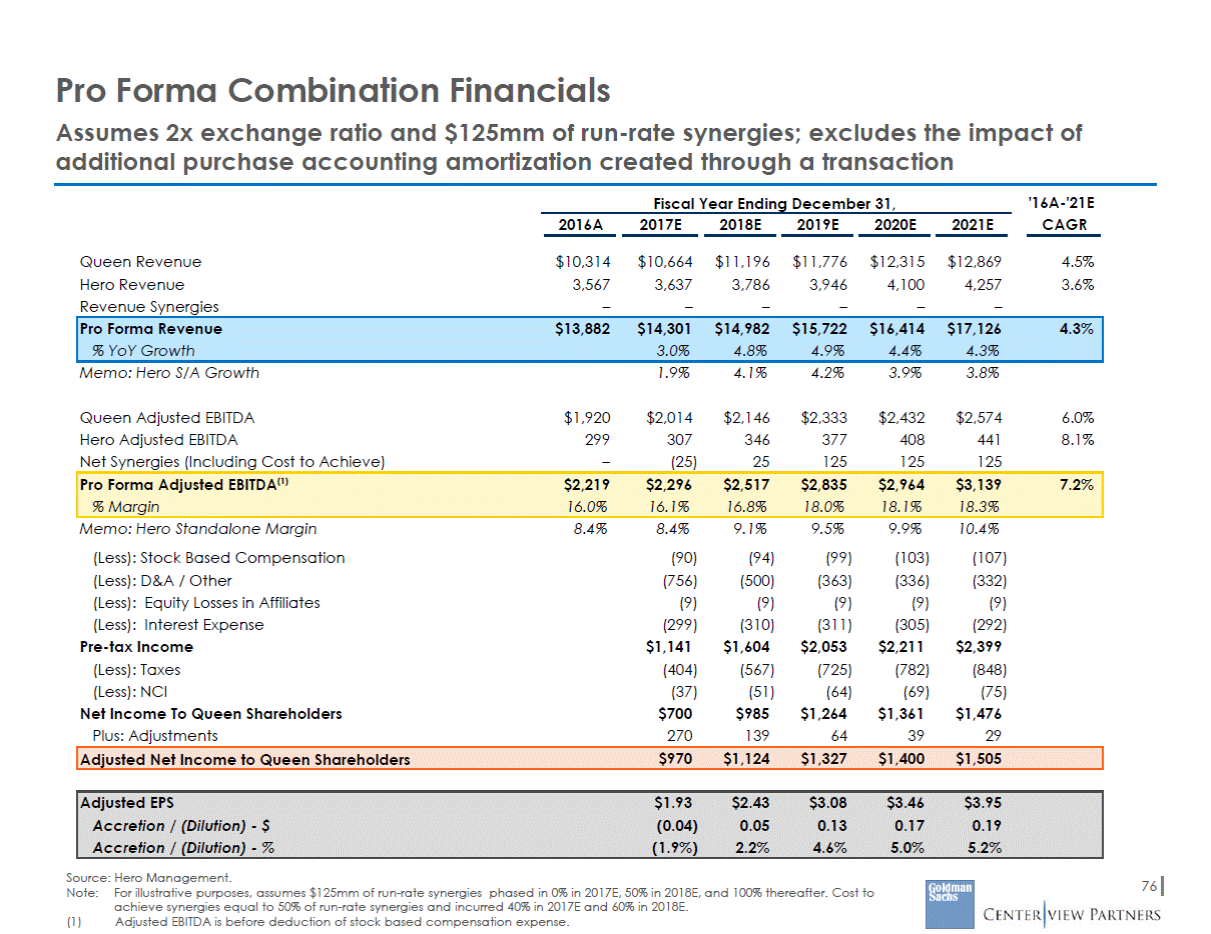
Illustrative Pro Forma Discounted Cash Flow Valuation Assumes an illustrative $125mm of run-rate synergies Centerview Perspective Pro Forma Unlevered Free Cash Flows Fiscal Year Ending December 31, 2016A 2017E 2018E 2019E 2020E 2021E Adjusted EBITDA (Less): Stock Based Compensation Comparable EBITDA(1) (Less): D&A (Excluding Trans. Amort.)(2) (Less): Costs to Achieve Synergies Adjusted EBIT (Less): Taxes Plus: D&A (Less): in Net Working Capital (Less): Capital Expenditures Unlevered Free Cash Flow YoY Growth $2,219 (86) $2,133 (418) – $1,715 $2,321 (90) $2,230 (366) (25) $1,839 (651) 366 (87) (305) $1,163 $2,555 (94) $2,460 (323) (38) $2,100 (742) 323 (112) (339) $1,229 6% $2,835 (99) $2,736 (265) – $2,471 (873) 265 (117) (355) $1,391 13% $2,964 (103) $2,861 (276) – $2,585 (914) 276 (102) (363) $1,483 7% $3,139 (107) $3,032 (288) – $2,744 (970) 288 (120) (369) $1,573 6% Enterprise Value ($bn) Implied LTM Exit Multiple Equity Value ($bn) Discount Rate Perpetuity Growth Rate Perpetuity Growth Rate Perpetuity Growth Rate 1.0% 2.0% 3.0% 1.0% 2.0% 3.0% 1.0% 2.0% 3.0% 9.00% 9.50% 10.00% $19.2 18.1 17.1 $21.3 19.9 18.7 $24.1 22.3 20.7 7.0x 6.6x 6.2x 8.0x 7.5x 7.1x 9.5x 8.8x 8.2x $12.0 10.8 9.8 $14.1 12.7 11.4 $16.9 15.1 13.5 Source: Hero Management, Wall Street research, and Factset as of February 3, 2017. Note: Assumes mid-year discounting convention. For illustrative purposes, assumes $125mm of run-rate synergies phased in 0% in 2017E, 50% in 2018E, and 100% thereafter. Cost to achieve synergies equal to 50% of run-rate synergies and incurred 40% in 2017E and 60% in 2018E. Adjusted EBITDA is before deduction of stock based compensation expense. Comparable EBITDA is calculated after deduction of stock-based compensation expense . Includes other. 77 (1) (2)
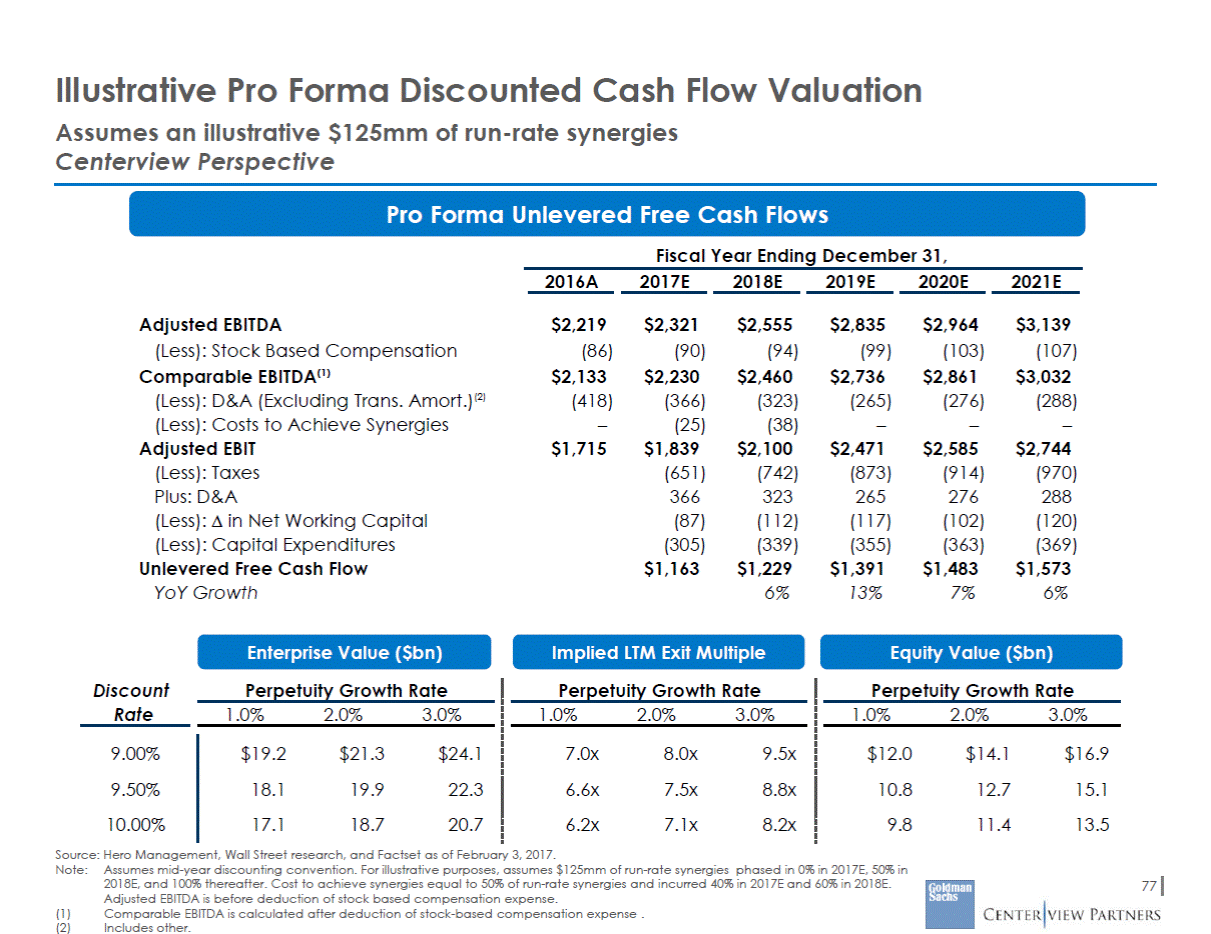
Illustrative Discounted Cash Flow Analysis at Projected Unlevered Free Cash Flow & Terminal Value Goldman Sachs Perspective 2.00x Exchange Ratio ($ in millions, except for per share data) Pro Forma Historical Pro Forma Terminal Year 2015A $ 12,860 - 2016A $ 13,882 7.9 % 2017E $ 14,301 3.0 % 2018E $ 14,982 4.8 % 2019E $ 15,722 4.9 % 2020E $ 16,414 4.4 % 2021E $ 17,126 4.3 % Revenue % Growth $ 17,469 2.0 % % Margin Stock-Based Compensation Synergies Costs to Achieve Synergies 17.5 % $ 78 0 0 16.0 % $ 86 0 0 16.2 % $ 90 0 25 16.6 % $ 94 63 38 17.2 % $ 99 125 0 17.3 % $ 103 125 0 17.6 % $ 107 125 0 17.6 % $ 110 125 0 % Margin Depreciation Amortization Other Expenses 16.8 % $ 183 138 12 15.4 % $ 233 153 31 15.4 % $ 243 123 1 16.2 % $ 252 70 1 17.4 % $ 264 0 1 17.4 % $ 275 0 1 17.7 % $ 287 0 1 17.7 % $ 293 0 1 % Margin Less: Adjusted Tax Expense (Blended) Plus: Depreciaton Plus: Amortization Less: Capital Expenditures Less: Increase in NWC Plus: Other Non-Cash Items 14.3 % 12.4 % 12.9 % $ 651 243 123 305 87 1 14.0 % $ 742 252 70 339 112 1 15.7 % $ 873 264 - 355 117 1 15.7 % $ 914 275 - 363 102 1 16.0 % $ 970 287 - 369 120 1 16.0 % $ 989 293 - 328 34 - % of EBITDA 50.1 % 49.3 % 51.3 % 52.2 % 52.2 % 56.6 % Illustrative Terminal Value Assumed Perpetuity Growth Rate Illustrative WACC Terminal FCF 2.0 % 9.0 % $ 1,739 Terminal Value at Exit Implied Terminal Value LTM EBITDA Multiple $ 24,843 8.0 x Present Value of Terminval Value $ 16,857 Terminal Value % of Total Value (-) Net Financial Debt (-) Noncontrolling Interest (+) Queen Chinese Joint Venture Equity Value Shares Outstanding (mm) 75.5 % $ 6,646 $ 836 $ 242 $ 15,096 533.00 Source: Hero historical financials and projections, Queen historical financials and Wall Street projections supplemented with extrapolated historical financial trends, Factset as of as of February 3, 2017. Note:Cash flows discounted to 01-Jan-2017 using mid-year convention for cash flows. Includes $125mm of run-rate synergies and $63mm of one-off implementation costs per management guidance. 78 (1) Includes adjustments for equity associates and noncontrolling interests. Illustrative Implied Equity Value per Share $ 28.32 Total DCF Value $ 22,337 $ 1,739 $ 1,163 $ 1,229 $ 1,391 $ 1,483 $ 1,573 Unlevered Free Cash Flow $ 2,797 $ 1,839 $ 2,100 $ 2,471 $ 2,585 $ 2,744 EBIT $ 1,833 $ 1,715 $ 3,090 $ 2,205 $ 2,423 $ 2,736 $ 2,861 $ 3,032 Adj. EBITDA (post-SBC, incl. Synergies) $ 2,166 $ 2,133 $ 3,075 $ 2,321 $ 2,492 $ 2,710 $ 2,839 $ 3,014 Adj. EBITDA (pre-SBC) $ 2,244 $ 2,219
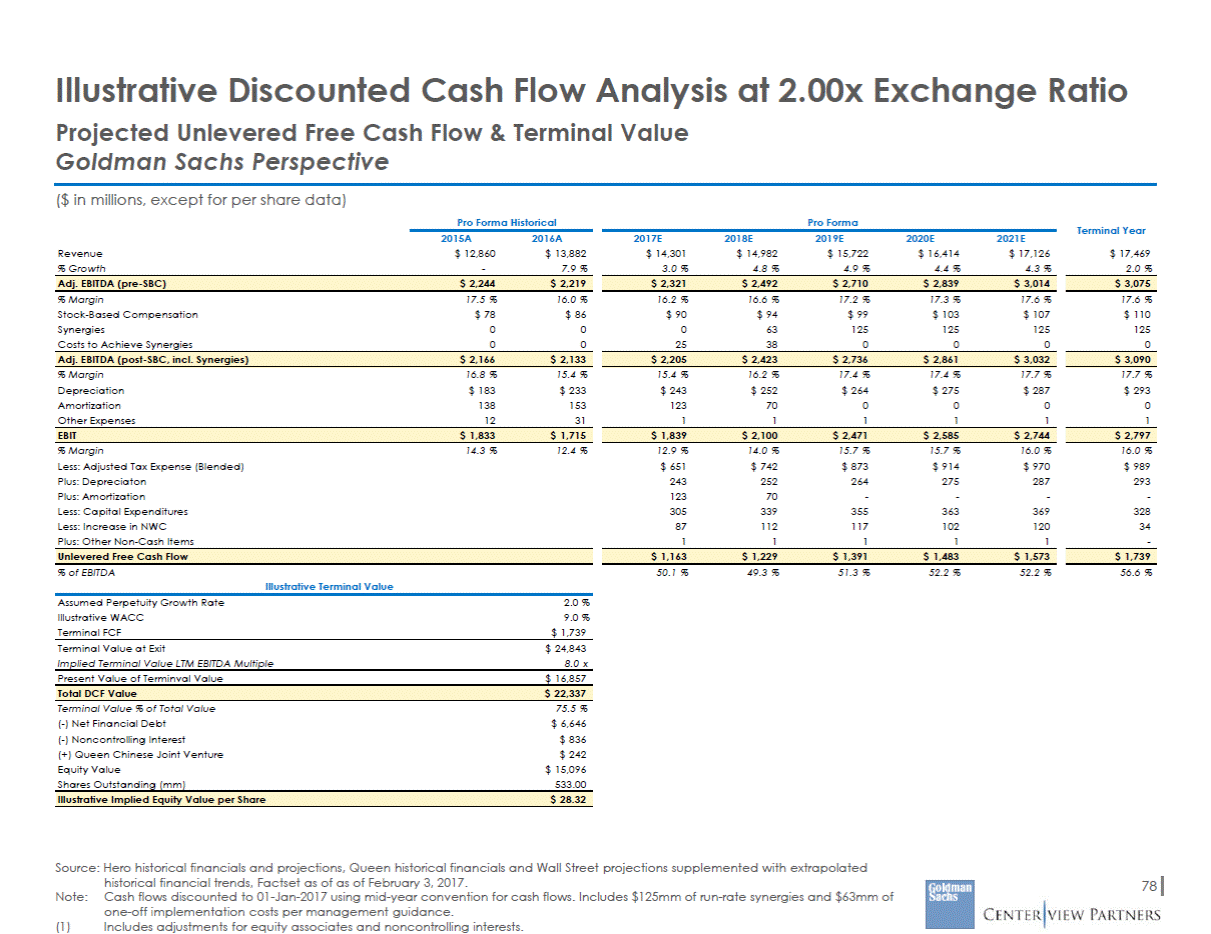
Illustrative DCF Sensitivities at 2.00 Exchange Ratio Implied Value Per Share of Pro Forma Combined Hero and Queen Goldman Sachs Perspective ($ in millions, except for per share data) Enterprise Value Value per Share 1.5 % 2.0 % 2.5 % 1.5 % 2.0 % 2.5 % 8.0 % 8.0 % 9.0 % 9.0 % 10.0 % 10.0 % Implied Exit LTM EBITDA Multiple(1) % of EV from Terminal Value 1.5 % 2.0 % 2.5 % 1.5 % 2.0 % 2.5 % 8.0 % 8.0 % 9.0 % 9.0 % 10.0 % 10.0 % Source: Hero projections, Wall Street projections supplemented with extrapolated historical financial trends for Queen, Factset as of as of February 3, 2017. Note:Free cash flow discounted to 01-Jan-2017 using mid-year convention for cash flows. Terminal value calculated as of 2021E. Includes $125mm of run-rate synergies and $63mm of one-off implementation costs per management guidance. 79 (1) Calculated as terminal value at exit divided by terminal year adjusted EBITDA (post-SBC). 8.7 x 9.4 x 10.1 x 7.6 x 8.0 x 8.6 x 6.7 x 7.0 x 7.4 x WACC 77.2 % 78.5 % 79.9 % 74.3 % 75.5 % 76.7 % 71.4 % 72.5 % 73.7 % WACC Perpetuity Growth Rate Perpetuity Growth Rate $ 32.43 $ 35.09 $ 38.23 $ 26.45 $ 28.32 $ 30.49 $ 21.87 $ 23.24 $ 24.80 WACC $ 24,626 $ 26,107 $ 27,857 $ 21,293 $ 22,337 $ 23,541 $ 18,748 $ 19,513 $ 20,380 WACC Perpetuity Growth Rate Perpetuity Growth Rate
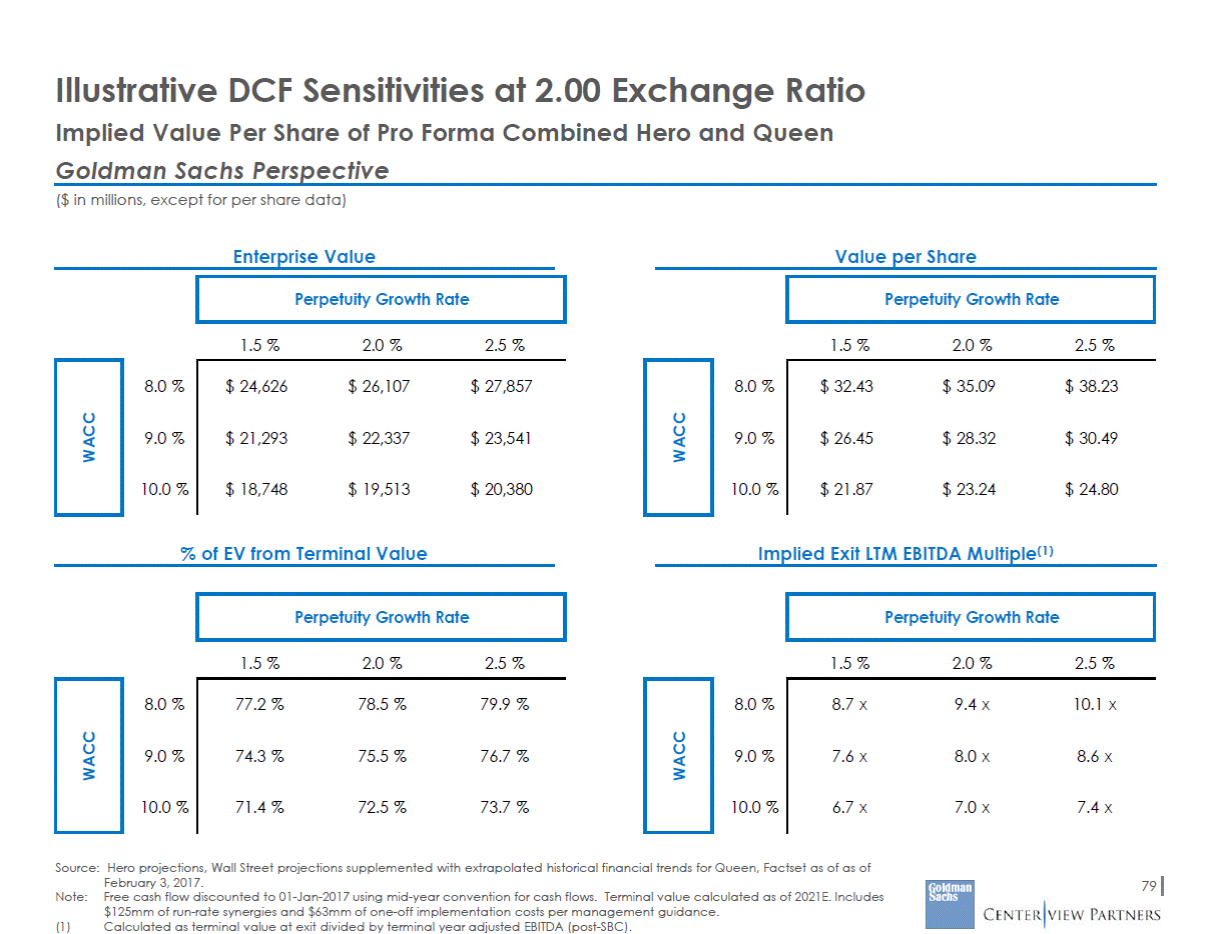
Illustrative Pro Forma Public Market Present Value of Future Share Price Analysis Based on Hero Management and Queen Street Based on 1 Year Forward EV/EBITDA Multiples | Goldman Sachs Perspective Present Value of Future Stock Price at 11.5% Cost of Equity at 2.00x Exchange Ratio Present Value of Future Stock Price at 11.5% Cost of Equity at 2.20x Exchange Ratio $ 30.98 $ 28.18 $ 30.57 $ 27.81 $ 29.62 $ 26.57 $ 29.23 $ 26.22 $ 28.73 $ 28.35 $ 25.08 $ 26.41 $ 26.07 $ 25.42 $ 22.95 $ 22.65 $ 25.54 $ 25.20 $ 23.70 $ 23.38 $ 22.28 $ 21.98 $ 18.75 $ 18.75 $ 19.70 $ 19.44 Current 1/1/2018 1/1/2019 1/1/2020 1/1/2021 Current 1/1/2018 1/1/2019 1/1/2020 1/1/2021 7.0x Forward EV/EBITDA 7.7x Forward EV/EBITDA (blended) 8.5x Forward EV/EBITDA Jan-2018E Jan-2019E Jan-2020E Jan-2021E Jan-2018E Jan-2019E Jan-2020E Jan-2021E Value to HSN Value to HSN 7.0x NTM EV/EBITDA 7.0x NTM EV/EBITDA $ 52.83 $ 57.46 $ 59.24 $ 61.96 $ 57.35 $ 62.38 $ 64.31 $ 67.25 7.7x NTM EV/EBITDA 7.7x NTM EV/EBITDA $ 45.90 $ 50.84 $ 53.15 $ 56.37 $ 49.82 $ 55.18 $ 57.69 $ 61.18 8.5x NTM EV/EBITDA 8.5x NTM EV/EBITDA $ 39.40 $ 44.56 $ 47.39 $ 51.08 $ 42.76 $ 48.36 $ 51.44 $ 55.44 80 Source: Hero projections, Wall Street projections supplemented with extrapolated historical financial trends, Factset as of as of February 3, 2017 Note:Blended multiples calculated based current Hero and Queen NTM EV / EBITDA multiple, weighted by EBITDA each year. Includes $125mm of run-rate synergies and $63mm of one-off implementation costs per management guidance.
