Disclaimer (Centerview Partners) This presentation has been prepared by Centerview Partners LLC (“Centerview”) for use solely by the Special Committee of the Board of Directors of HSN, Inc. (“Hero” or the “Company”) in connection with its evaluation of a proposed transaction involving the Company and for no other purpose. The information contained herein is based upon information supplied by Hero and publicly available information, and portions of the information contained herein may be based upon statements, estimates and forecasts provided by the Company. Centerview has relied upon the accuracy and completeness of the foregoing information, and have not assumed any responsibility for any independent verification of such information or for any independent evaluation or appraisal of any of the assets or liabilities (contingent or otherwise) of the Company or any other entity, or concerning the solvency or fair value of the Company or any other entity. With respect to financial forecasts, including wit h respect to estimates of potential synergies, Centerview has assumed that such forecasts have been reasonably prepared on bases reflecting the best currently available estimates and judgments of the management of the Company as to its financial performances, and at your direction Centerview has relied upon such forecasts, as provided by the Company’s management, with respect to the Company, including as to expected synergies. Centerview assumes no responsibility for and expresses no view as to such forecasts or the assumptions on which they are based. The information set forth herein is based upon economic, monetary, market and other conditions as in effect on, and the information made available to us as of, the date hereof, unless indicated otherwise and Centerview assumes no obligation to update or otherwise revise these materials. The financial analysis in this presentation is complex and is not necessarily susceptible to a partial analysis or summary de scription. In performing this financial analysis, Centerview has considered the results of its analysis as a whole and did not necessarily attribute a particular weight to any particular portion of the analysis considered. Furthermore, selecting any portion of Centerview’s analysis, without considering the analysis as a whole, would create an incomplete view of the process underlying its financial analysis. Centerview may have deemed various assumptions more or less probable than other assumptions, so the reference ranges resulting from any particular portion of the analysis described above should not be taken to be Centerview’s view of the actual value of the Company. These materials and the information contained herein are confidential, were not prepared with a view toward public disclosure , and may not be disclosed publicly or made available to third parties without the prior written consent of Centerview. These materials and any other advice, written or oral, rendered by Centerview are intended solely for the benefit and use of the Special Committee of the Board of Directors of the Company (in its capacity as such) in its consideration of the proposed transaction, and are not for the benefit of, and do not convey any rights or remedies for any holder of securities of the Company or any other person. Centerview will not be responsible for and has not provided any tax, accounting, actuarial, legal or other specialist advice. These materials are not intended to provide the sole basis for evaluating the p roposed transaction, and this presentation does not represent a fairness opinion, recommendation, valuation or opinion of any kind, and is necessarily incomplete and should be viewed solely in conjunction with the oral presentation provided by Centerview. 1
Disclaimer (Goldman Sachs) These materials have been prepared and are provided by Goldman Sachs on a confidential basis solely for the information and assistance of the Special Committee of the Board of Directors (the "Special Committee") of Hero (the "Company") in connection with its consideration of the matters referred to herein. These materials and Goldman Sachs’ presentation relating to these materials (the “Confidential Information”) may not be disclosed to any third party or circulated or referred to publicly or used for or relied upon for any other purpose without the prior written consent of Goldman Sachs. The Confidential Information was not prepared with a view to public disclosure or to conform to any disclosure standards under any state, federal or international securities laws or other laws, rules or regulations, and Goldman Sachs does not take any responsibility for the use of the Confidential Information by persons other than those set forth above. Notwithstanding anything in this Confidential Information to the contrary, the Company may disclose to any person the US federal income and state income tax treatment and tax structure of any transaction described herein and all materials of any kind (including tax opinions and other tax analyses) that are provided to the Company relating to such tax treatment and tax structure, without Goldman Sachs imposing any limitation of any kind. The Confidential Information has been prepared by the Investment Banking Division of Goldman Sachs and is not a product of its research department. Goldman Sachs and its affiliates are engaged in advisory, underwriting and financing, principal investing, sales and trading, research, investment management and other financial and non-financial activities and services for various persons and entities. Goldman Sachs and its affiliates and employees, and funds or other entities they manage or in which they invest or have other economic interests or with which they co-invest, may at any time purchase, sell, hold or vote long or short positions and investments in securities, derivatives, loans, commodities, currencies, credit default swaps and other financial instruments of the Company, any other party to any transaction and any of their respective affiliates or any currency or commodity that may be involved in any transaction. Goldman Sachs’ investment banking division maintains regular, ordinary course client service dialogues with clients and potential clients to review events, opportunities, and conditions in particular sectors and industries and, in that connection, Goldman Sachs may make reference to the Company, but Goldman Sachs will not disclose any confidential information received from the Company. The Confidential Information has been prepared based on historical financial information, forecasts and other information obtained by Goldman Sachs from publicly available sources, the management of the Company or other sources (approved for our use by the Company in the case of information from management and non-public information). In preparing the Confidential Information, Goldman Sachs has relied upon and assumed, without assuming any responsibility for independent verification, the accuracy and completeness of all of the financial, legal, regulatory, tax, accounting and other information provided to, discussed with or reviewed by us, and Goldman Sachs does not assume any liability for any such information. Goldman Sachs does not provide accounting, tax, legal or regulatory advice. Goldman Sachs has not made an independent evaluation or appraisal of the assets and liabilities (including any contingent, derivative or other off-balance sheet assets and liabilities) of the Company or any other party to any transaction or any of their respective affiliates and has no obligation to evaluate the solvency of the Company or any other party to any transaction under any state or federal laws relating to bankruptcy, insolvency or similar matters. The analyses contained in the Confidential Information do not purport to be appraisals nor do they necessarily reflect the prices at which businesses or securities actually may be sold or purchased. Goldman Sachs’ role in any due diligence review is limited solely to performing such a review as it shall deem necessary to support its own advice and analysis and shall not be on behalf of the Company. Analyses based upon forecasts of future results are not necessarily indicative of actual future results, which may be significantly more or less favorable than suggested by these analyses, and Goldman Sachs does not assume responsibility if future results are materially different from those forecast. The Confidential Information does not address the underlying business decision of the Company to engage in any transaction, or the relative merits of any transaction or strategic alternative referred to herein as compared to any other transaction or alternative that may be available to the Company. The Confidential Information is necessarily based on economic, monetary, market and other conditions as in effect on, and the information made available to Goldman Sachs as of, the date of such Confidential Information and Goldman Sachs assumes no responsibility for updating or revising the Confidential Information based on circumstances, developments or events occurring after such date. The Confidential Information does not constitute any opinion, nor does the Confidential Information constitute a recommendation to the Special Committee, any security holder of the Company or any other person as to how to vote or act with respect to any transaction or any other matter. The Confidential Information, including this disclaimer, is subject to, and governed by, any written agreement between the Company, the Board and/or any committee thereof, on the one hand, and Goldman Sachs, on the other hand. 2
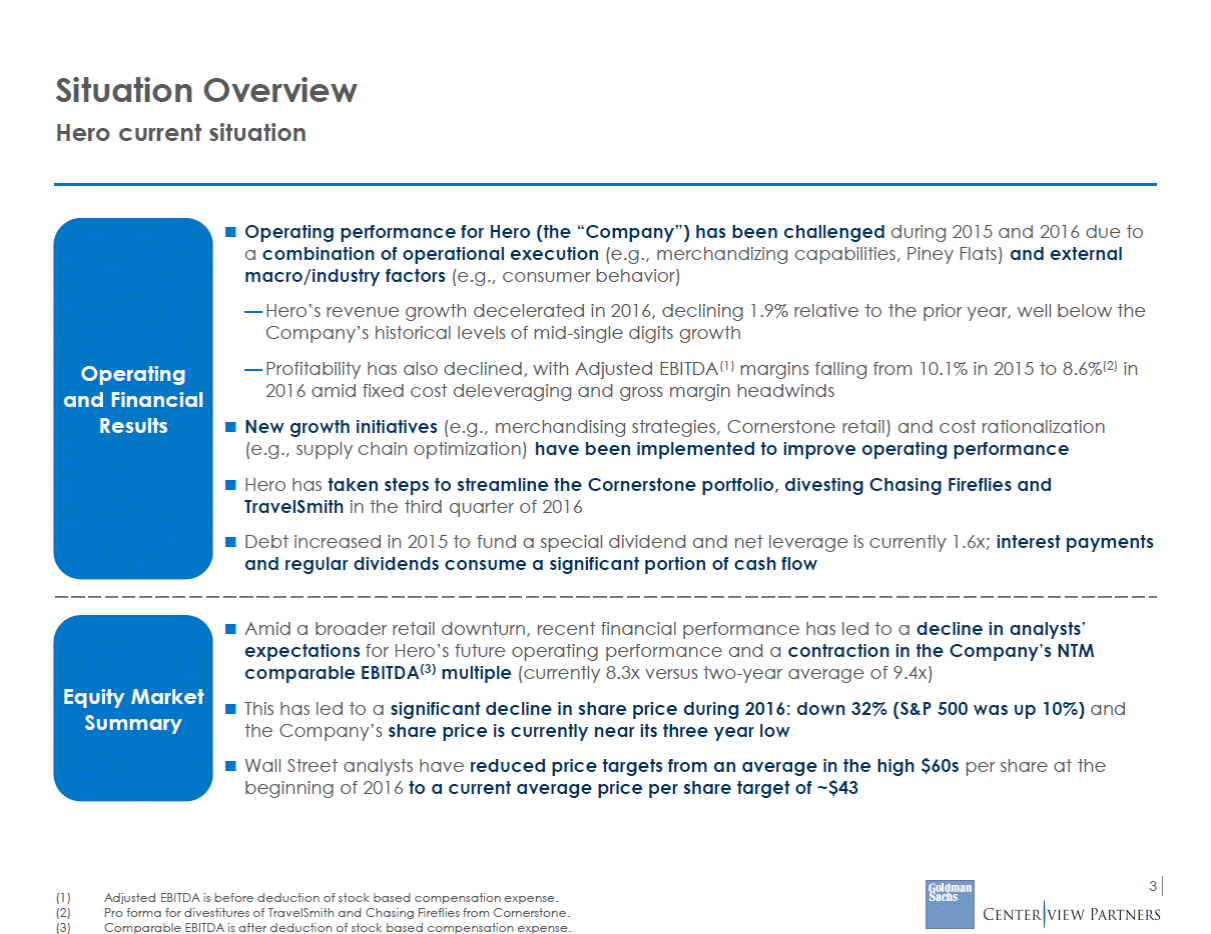
Situation Overview Hero current situation Operating performance for Hero (the “Company”) has been challenged during 2015 and 2016 due to a combination of operational execution (e.g., merchandizing capabilities, Piney Flats) and external macro/industry factors (e.g., consumer behavior) — Hero’s revenue growth decelerated in 2016, declining 1.9% relative to the prior year, well below the Company’s historical levels of mid-single digits growth — Profitability has also declined, with Adjusted EBITDA(1) margins falling from 10.1% in 2015 to 8.6%(2) in 2016 amid fixed cost deleveraging and gross margin headwinds New growth initiatives (e.g., merchandising strategies, Cornerstone retail) and cost rationalization (e.g., supply chain optimization) have been implemented to improve operating performance Hero has taken steps to streamline the Cornerstone portfolio, divesting Chasing Fireflies and TravelSmith in the third quarter of 2016 Debt increased in 2015 to fund a special dividend and net leverage is currently 1.6x; interest payments and regular dividends consume a significant portion of cash flow Operating and Financial Results Amid a broader retail downturn, recent financial performance has led to a decline in analysts’ expectations for Hero’s future operating performance and a contraction in the Company’s NTM comparable EBITDA(3) multiple (currently 8.3x versus two-year average of 9.4x) This has led to a significant decline in share price during 2016: down 32% (S&P 500 was up 10%) and the Company’s share price is currently near its three year low Wall Street analysts have reduced price targets from an average in the high $60s per share at the beginning of 2016 to a current average price per share target of ~$43 Equity Market Summary 3 (1) (2) (3) Adjusted EBITDA is before deduction of stock based compensation expense. Pro forma for divestitures of TravelSmith and Chasing Fireflies from Cornerstone. Comparable EBITDA is after deduction of stock based compensation expense.
Situation Overview Context for discussion of potential combination with Queen Hero management has presented to the Board its long-term operating forecast (“Projections”): — Projections assume a return of organic revenue growth (+3.2%) in 2017 and an overall CAGR over the projection period of +3.9%(1) — Adjusted EBITDA margins decline slightly (20bps) in 2017 and then are forecast to expand ~200bps to 10.4% from 2017-2021 — The Projections contemplate a ’16-’21 EPS CAGR of ~9%, with cash available to continue funding the dividend and buybacks to maintain a constant share count over time Projections are in excess of Wall Street consensus, which forecasts ~0.5% revenue growth in 2017 and 3.6% revenue growth in 2018 Hero Financial Projections In late 2016, Queen’s CEO conveyed verbally to Hero’s Chairman that Queen would be interested in exploring a transaction to acquire Hero with stock at a “modest premium” Hero’s Board formed a Special Committee to evaluate its long-term business plan and consider various alternatives, and verbally informed Queen of the process Queen has not submitted a formal indication of interest Queen Situation A number of key assumptions will need to be considered as the Board reviews the range of strategic alternatives potentially available to the Company: — Business Plan Execution: Ability for Hero to reaccelerate growth from its current decline to the growth rates assumed in the Projections, which are more consistent with historical performance — Balance Sheet Recapitalization: Comfort level with increasing the Company’s target leverage level in order to execute enhanced capital return alternatives — Acquisition Alternatives: Ability to execute and finance potentially attractive acquisitions given the Company’s current operating performance and balance sheet Strategic Alternatives Introduction 4 (1) Pro forma for divestitures of TravelSmith and Chasing Fireflies from Cornerstone.
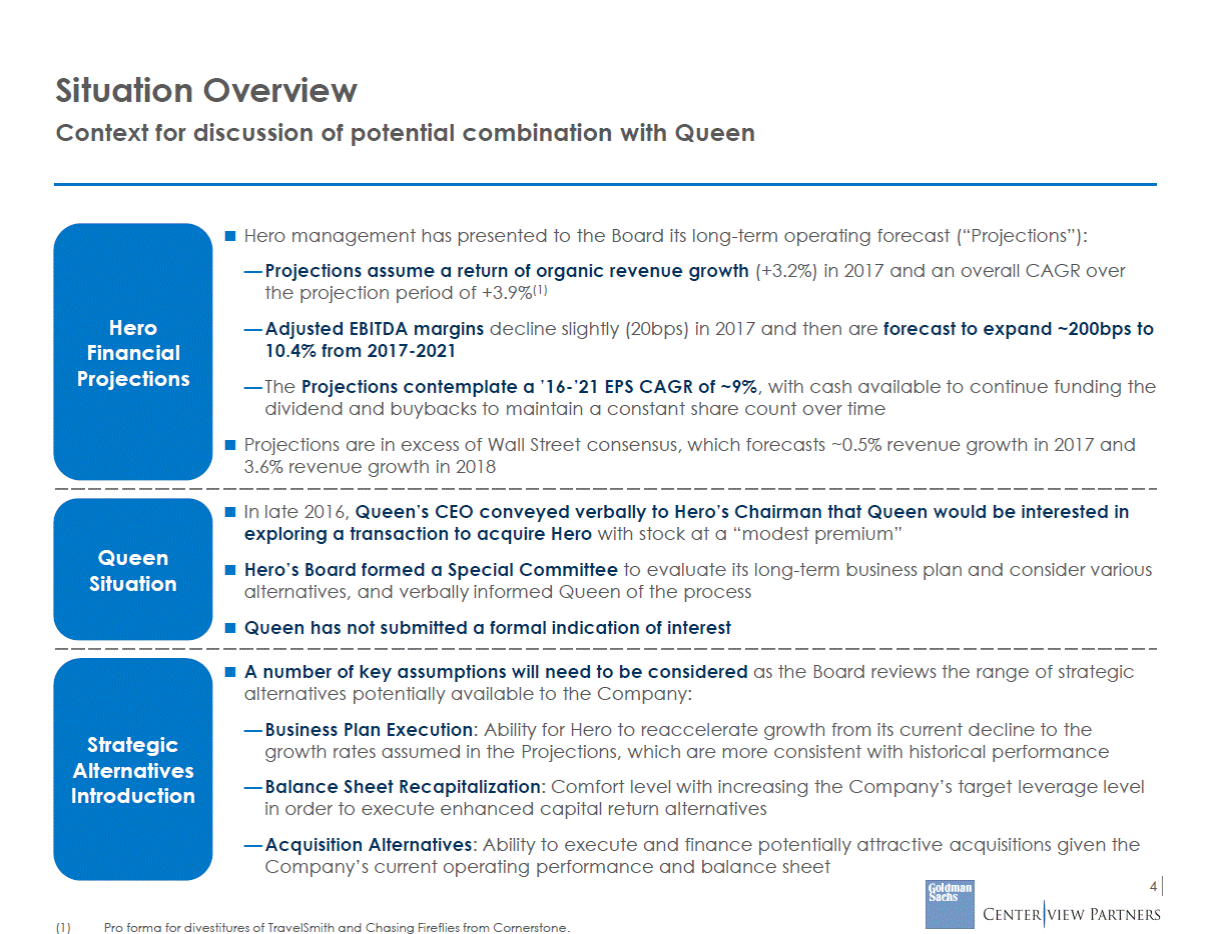
Trading Multiples Have Contracted Across Retail Universe Comparable EV/NTM EBITDA Comparable NTM P/E 14.0x 23.0x 13.0x 21.0x 12.1x 18.2% 12.0x 19.0x 11.0x 17.5x (4.3%) 17.0x 10.0x 15.8x (13.9%) 14.2x (17.5%) 13.7x (33.9%) 12.7x (30.3%) 8.3x (31.0%) 8.5x (6.1%) 7.6x (22.2%) 7.2x (16.0%) 6.3x (34.3%) 9.0x 15.0x 8.0x 13.0x 7.0x 11.0x 6.0x 10.1x (54.1%) 9.0x 5.0x Jan-15 Jul-15 Jan-16 Jul-16 Jan-17 Jan-15 Jul-15 Jan-16 Jul-16 Jan-17 Specialty Retail(1) Home Stores(1) Department/Mass(1) eCommerce(1) Hero Queen Source: Hero Management, company filings and Factset as of February 3, 2017. Note: Comparable EBITDA calculated after deduction of stock-based compensation expense from Adjusted EBITDA. Comparable EPS is calculated after deduction of stock-based compensation expense and before deduction of after-tax intangible amortization from EPS. 5 (1) Specialty Retail includes BBY, DKS, FL, FOSL, GNC, TIF; Home Stores includes BBBY, ETH, PIR, RH, WSM; Department/Mass includes DDS, KSS, M, JWN, ROST, TGT, TJX, WMT; eCommerce includes eBay and OSTK. OSTK excluded from P/E average.
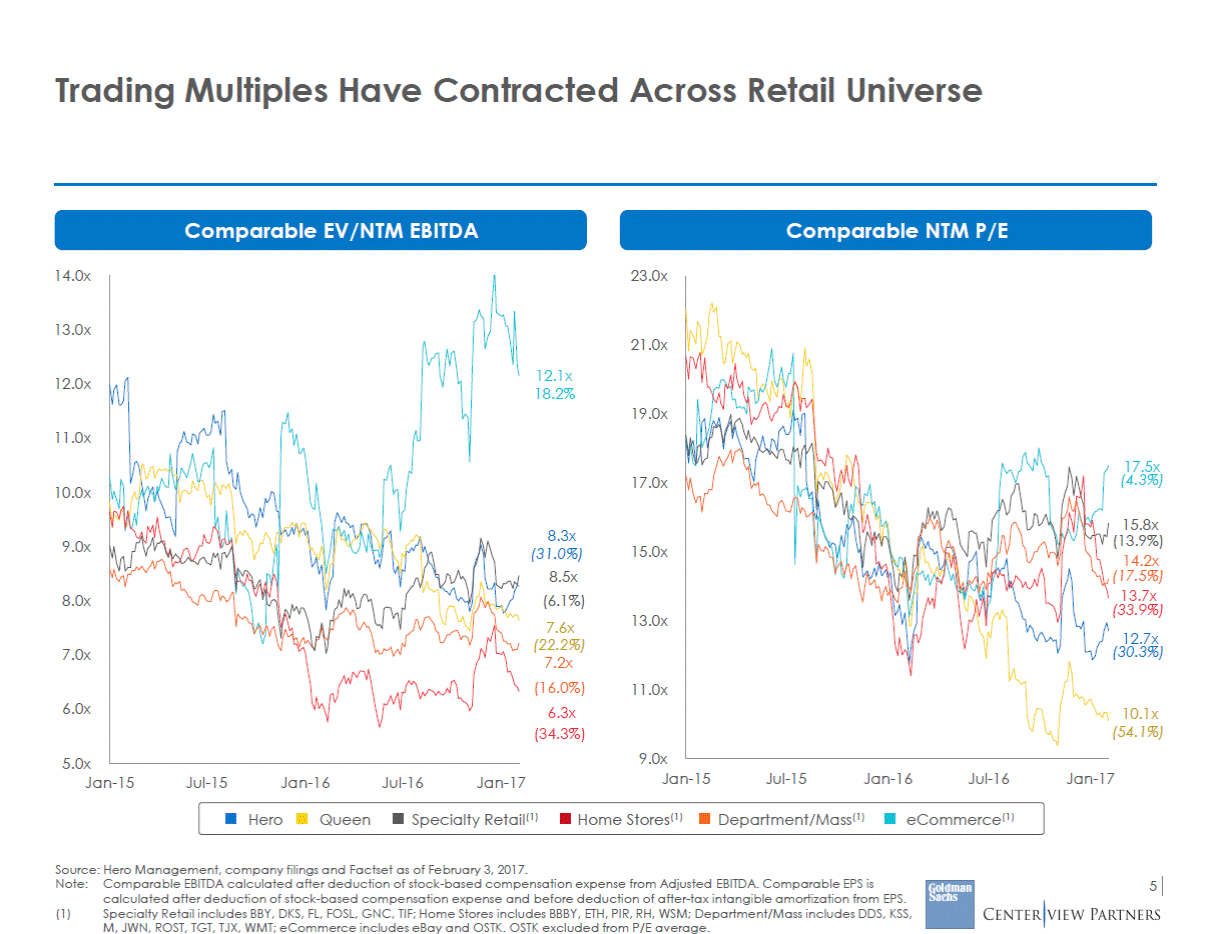
Hero Stock Price Performance Since Feb-2015 Hero Special Dividend $80 $70 $60 $50 $40 $ 34.65 $30 Feb-2015 Jun-2015 Oct-2015 Feb-2016 Jun-2016 Oct-2016 Feb-2017 6 Source: Company filings, IBES, Bloomberg as of February 3, 2017. Closing Price ($) EPS of $0.52 8 o resulting a — Reported 1Q’16 results: EPS of $0.54 vs. IBES volatile retail environment combined with EPS of $0.70 vs. IBES 04-May-2016 consensus of $0.53 — Stock reaction: (0.4)% — Results were down due to impact of the the repositioning of product portfolio 07-Nov-2016 — Reported 3Q’16 results: vs. IBES consensus of $0.5 — Stock reaction: (13.2)% — Results were down due t divestiture of TS and CFF, loss on sale of $11mm 04-Aug-2016 — Reported 2Q’16 results: EPS of $0.74 vs. IBES consensus of $0.80 — Stock reaction: (10.0)% — Digital sales growth of 2% more than offset by net sales decrease in Hero and CBI 24-Feb-2016 — Announced 4Q & FY15 results: EPS of $3.28 vs. IBES consensus of $3.19; stock price saw highest gain since Aug-2011 — Stock reaction: 7.5% — Sales affected by highly promotional retail environment 26-Feb-2015 — Reported 4Q & FY14 results: EPS of $3.23 vs. IBES consensus of $3.19 — Stock reaction: 1.5% — Annual sales grew 5% to $3.6bn, gaining momentum throughout the year 04-Nov-2015 — Announced 3Q’15 results: consensus of $0.76 — Stock reaction: (13.0)% — Strategic changes did not pay off; certain brands weigh on quarter results Hero Historical Value Since 19-Feb-2015$ 51.21 1-Year VWAP43.42 1-M onth VWAP34.14 1Y High54.68 1Y Low31.25 06-Aug-2015 — Announced 2Q’15 results: EPS of $0.81 vs. IBES consensus of $0.81, but missed revenue estimates by 1.1% — Stock reaction: (10.6)% — Street not positive on outlook of the business 06-May-2015 — Reported 1Q’15 results: EPS of $0.63 vs. IBES consensus of $0.58 — Stock reaction: 3.8% — Television marketing campaign results in direct response and in turn, sales growth
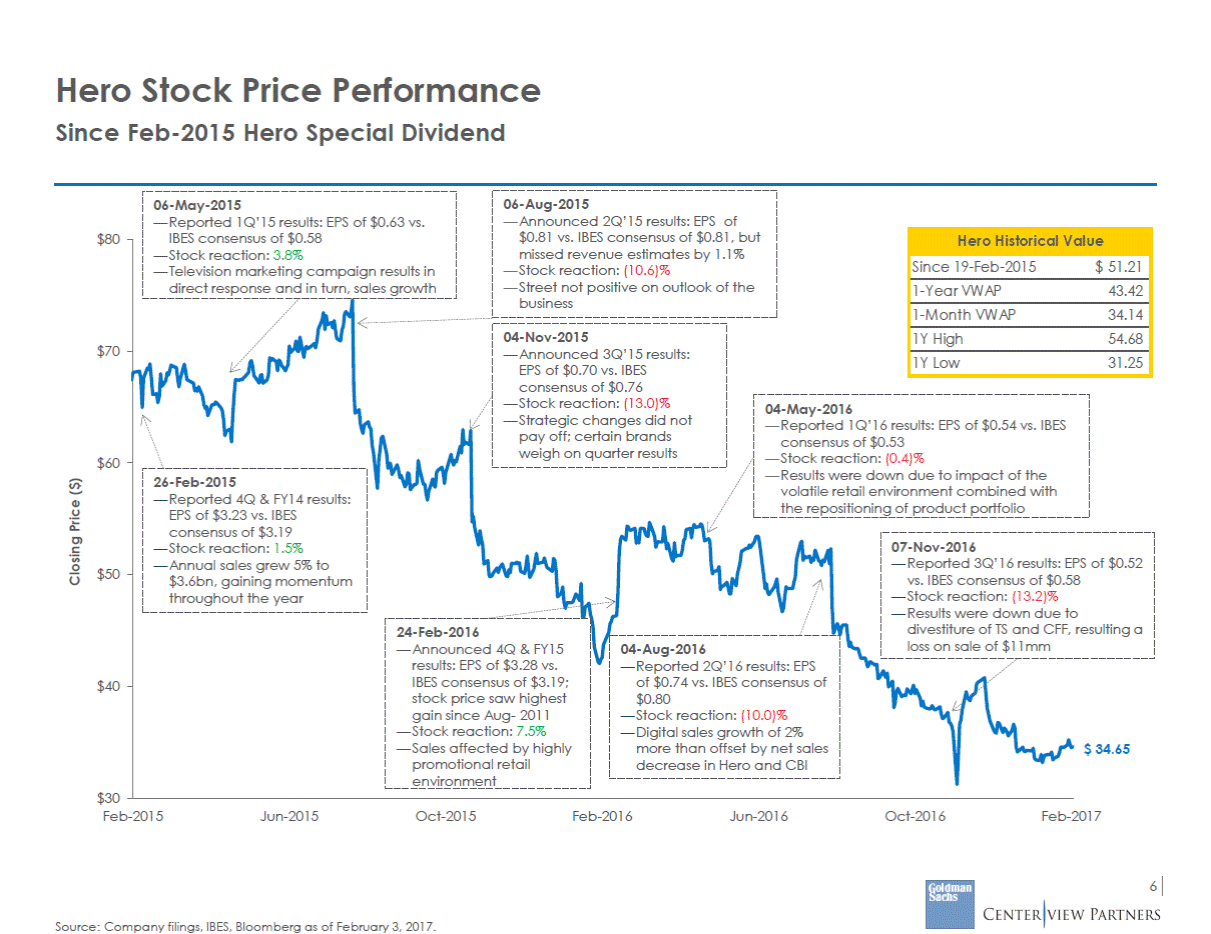
Public Trading Comparables Specialty Retail Home Stores Department / Mass eCommerce NTM EV / Comparable EBITDA NTM Comparable P/E ULTA Ross Tiffany & Co. TJX eBay RH Wal-Mart Pier 1 Imports Ethan Allen Nordstrom Dick's Foot Locker Williams-Sonoma Best Buy Hero Consensus Fossil Target Kohl's Dillard's Macy's Queen Bed, Bath & Beyond GNC ULTA eBay Overstock Ross TJX Tiffany & Co. Hero Consensus Wal-Mart Queen Ethan Allen Fossil RH Dick's Foot Locker Target Williams-Sonoma GNC Nordstrom Macy's Pier 1 Imports Best Buy Kohl's Bed, Bath & Beyond Dillard's 33.9x 16.3x 12.4x 21.0x 20.6x 11.9x 11.2x 19.9x 10.6x 10.6x 17.5x 16.5x 8.3x 15.4x 15.3x 14.8x 7.8x 7.6x 7.5x 14.1x 13.7x 13.2x 7.2x 7.0x 6.9x 6.9x 13.0x 12.8x 12.7x 12.3x 6.5x 6.2x 6.2x 12.0x 6.0x 6.0x 5.9x 10.6x 10.4x 10.2x 10.1x 5.2x 5.0x 5.0x 8.7x 4.4x 4.6x 6.0x 6.9x 9.2x 10.5x 13.2x 16.0x 25th Percentile: Median: 75th Percentile: 25th Percentile: Median: 75th Percentile: Stats Ex - Hero 7 Source: Hero management, company filings and FactSet as of February 3, 2017. Note:Comparable EBITDA calculated after deduction of stock-based compensation expense from Adjusted EBITDA. Comparable EPS is calculated after deduction of stock-based compensation expense and before deduction of after-tax intangible amortization from EPS.
Overview of Hero Standalone Plan Projections reflect a return to historical levels of growth and margin improvements driven by in-process initiatives Projections imply a return to historical levels of growth (prior to challenging 2016) —Top-line initiatives include improvements to TV distribution and viewer experience (e.g., one-click remote-buying), product pricing and expanding digital capabilities, etc. A number of in-process initiatives expected to drive margins above historical levels —Initiatives include supply chain efficiencies (tailwind from resolution of Piney Flats issues and automation), merchandising initiatives, etc. The Projections reflect a number of positive developments in December and January: —Resolution of Piney Flats issues; increased confidence in ability to drive margin improvement led by new Chief Merchandising Officer; clarified view of trends in business mix —Broker estimates do not reflect these developments and as a result lag the Projections —Resulted in stronger outlook for 2017 relative to Plan shared with Board in December Relative to Queen, Hero top-line growth is in-line but EBITDA growth and margin expansion are higher due to a low 2016 EBITDA base and the initiatives discussed above 8
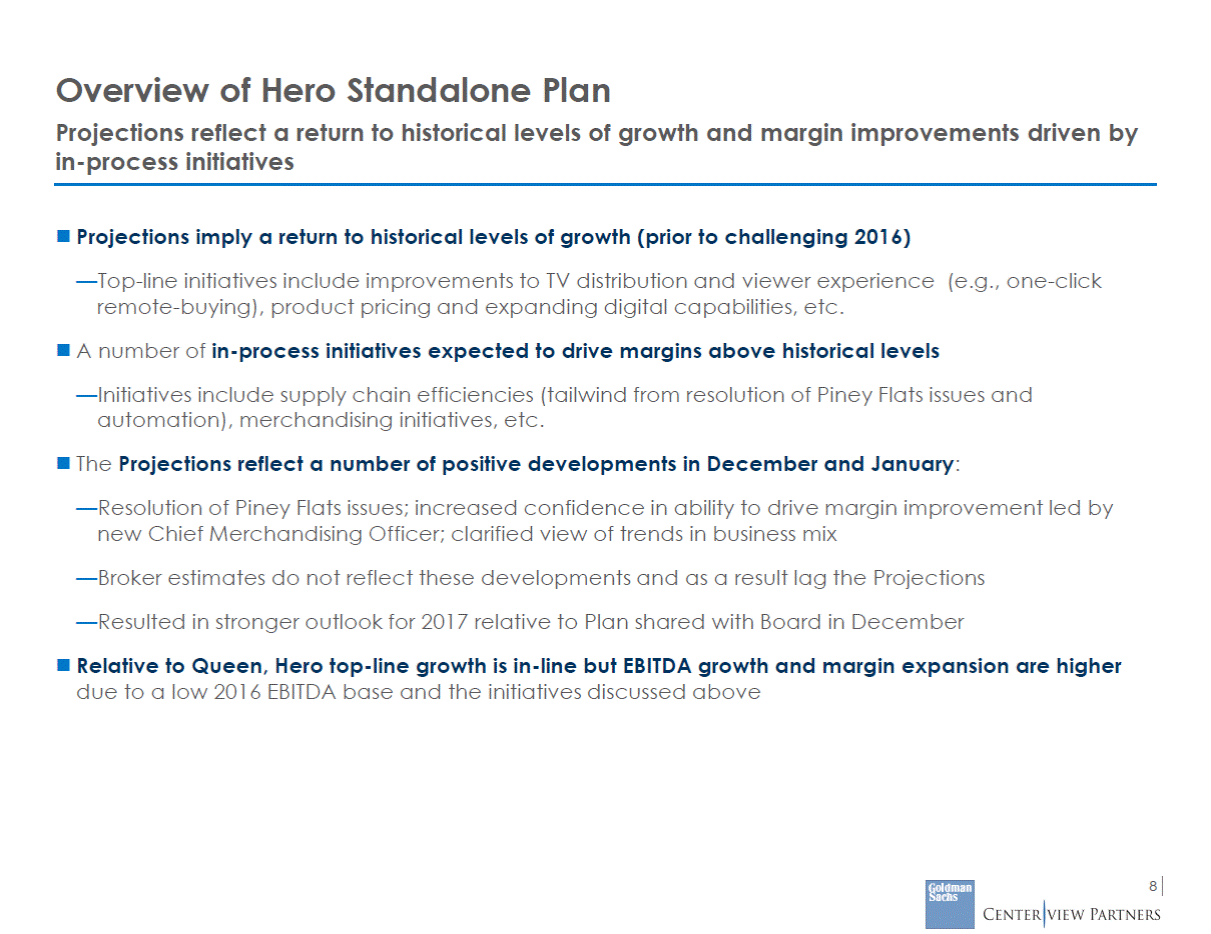
Hero Projections Summary Projections imply 7.7% Adjusted EBITDA CAGR and 8.8% EPS CAGR from 2016A-2021E Revenue Adjusted EBITDA(1) EPS 2015A 2016A 2017E 2018E 2019E 2020E 2021E 2015A 2016A 2017E 2018E 2019E 2020E 2021E 2015A 2016A 2017E 2018E 2019E 2020E 2021E YoY Growth % Margin % YoY Growth 3.4% (1.9%) 3.2% 4.1% 4.2% 3.9% 3.8% 10.1% 8.6% 8.4% 9.1% 9.5% 9.9% 10.4% 2% (20%) 0% 16% 10% 9% 9% 9 Source: Hero Management. Note:Revenue and EBITDA historical figures are pro forma for divestitures of TravelSmith and Chasing Fireflies from Cornerstone. (1) Adjusted EBITDA is before deduction of stock based compensation expense. $361 $441 $408 $377 $346 $304 $307 $3.28 $3.99 $3.65 $3.34 $3.03 $2.62 $2.62 $3,591 $3,524 $4,257 $4,100 $3,946 $3,786 $3,637
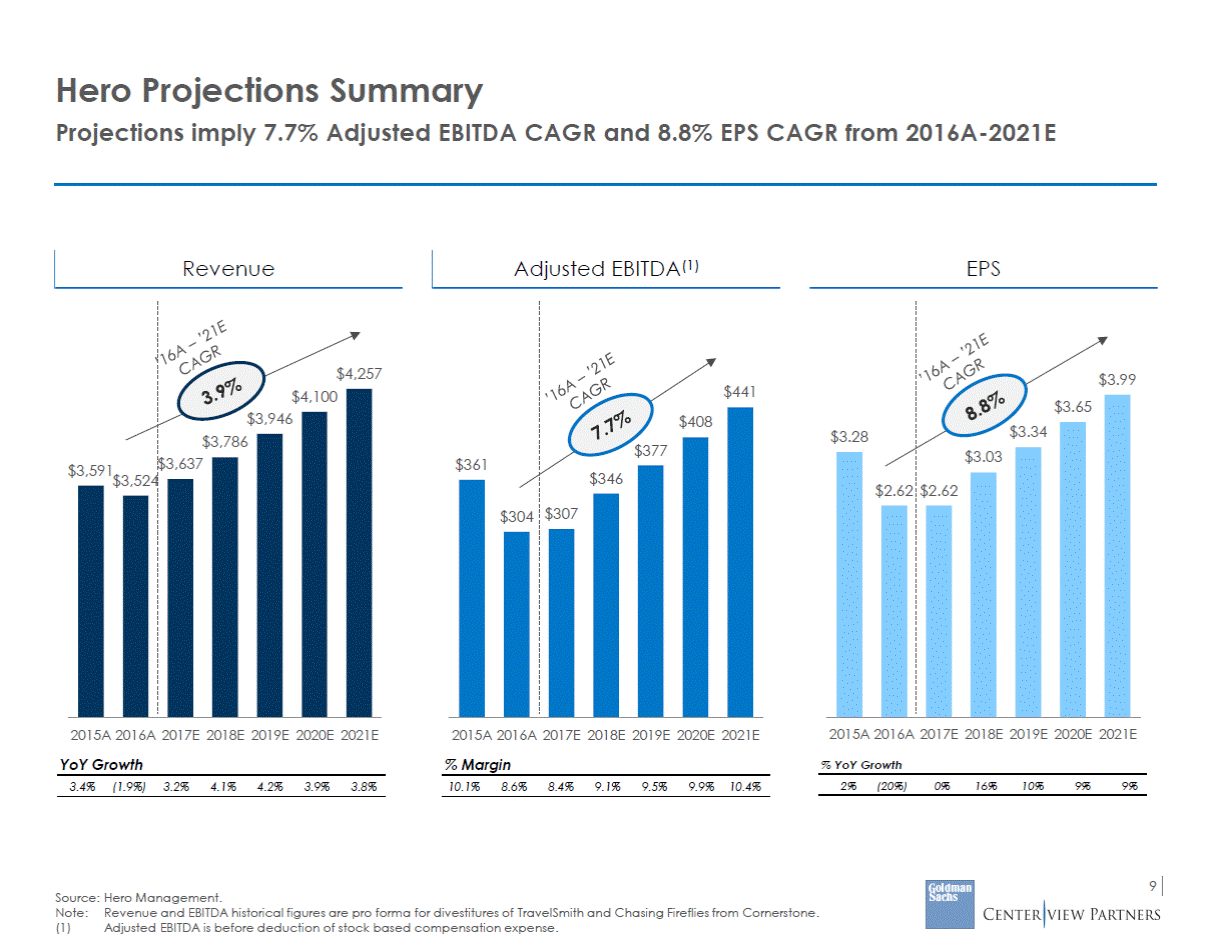
Projection Assumptions: Historical Context Projections reflect a return to historical growth rates and HSN segment margin expansion driven by in-process initiatives Adjusted EBITDA Margin(1) Revenue CAGR 12.9% Queen EBITDA margin: 18% Queen – U.S.: ’14A-’16E: ’16E-’18E: 1.1% 3.0% 10.5% 10.4% 3.9% 3.0% HSN (2.7%) '12A - '15A HSN Avg. '16A HSN '17P HSN '21E HSN '12A - '15A HSN '16A HSN '16A - '21E HSN 6.0% 5.0% 5.8% Cornerstone(2) 5.1% 4.3% 3.9% (0.0%) '16A CBI '12A - '15A CBI Avg. '16A CBI '17P CBI '21E CBI '12A - '15A CBI '16A - '21E CBI 10 Source: Hero Management. (1) (2) Adjusted EBITDA is before deducting stock based compensation expense. Cornerstone historical financials pro forma for sale of Chasing Fireflies and TravelSmith. 11.4%
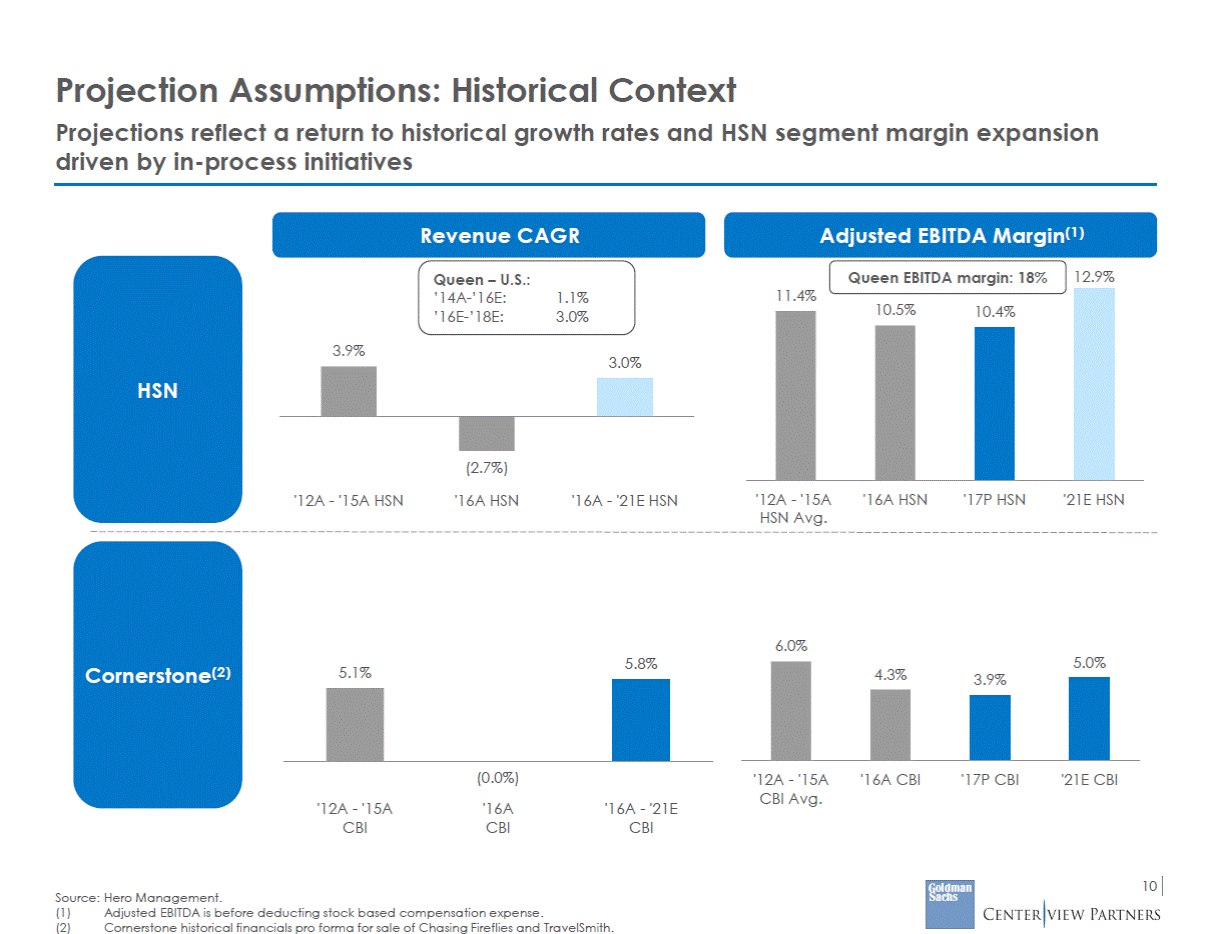
Summary of Illustrative Financial Analyses for Hero Per Management Projections Analyses Illustrative Price per Share Comments EV/EBITDA on 2018E-2021E Comparable EBITDA(2) $ 51 $ 53 8.0% to 10.0% weighted average cost of capital $ 46 9.5% to 10.5% weighted average cost of capital High: EV/LTM EBITDA 10.0x (2016 Comparable EBITDA of $285mm ) $ 44 $ 43 stock deals with U.S. targets with $1bn - $5bn in EV $ 42 $ 50 cash deals with U.S. targets with $1bn - $5bn in EV $ 42 Low: 12x NTM EPS (2017 Comparable EPS of $2.62)(2) $ 39 Low: 7x NTM EBITDA (2017 Comparable EBITDA of $286mm)(2) $ 55 Low: $31.24 (07-Nov-2016) $ 54 Low: $27.00 (BAML 07-Nov-2016) Source: Public filings, Hero Projections, Bloomberg, Factset, Wall Street research as of as of February 3, 2017 11 (1) (2) (3) Including dividends. Comparable EBITDA and EPS are after deduction of stock based compensation expense. Comparable EBITDA after deduction of stock based compensation expense. Pro forma for sale of Chasing Fireflies and TravelSmith. Present Value of Future Share Price(1) Goldman Sachs$ 36 PV of 1-4 year future share price based on 7.5–9.5x one year forward Assuming cost of equity of 10.0% Discounted Cash Flow Goldman Sachs$ 33 1.5% to 2.5% perpetuity growth rate Discounted Cash Flow Centerview Partners$ 30 1.0% to 3.0% perpetuity growth rate Selected Transactions$ 34 (3) Low: EV/LTM EBITDA 8.0x (2016 Comparable EBITDA of $285mm(3)) Precedent Premia (All Stock Deals) Goldman Sachs$ 35 Based on typical premiums over past 5 years of 0-25% for precedent Precedent Premia (All Cash Deals) Goldman Sachs Based on typical premiums over past 5 years of 20-45% for precedent Trading Range – P/E Centerview Partners$ 31 High: 16x NTM EPS (2017 Comparable EPS of $2.62)(2) Trading Range – EV / EBITDA Centerview Partners$ 29 High: 9x NTM EBITDA (2017 Comparable EBITDA of $286mm)(2) For Reference: 52-Week Trading Range$ 31 High: $54.68 (18-Mar-2016) For Reference: Analyst Price Targets$ 27 High: $54.00 (Maxim 28-Nov-2016) Current Price : $34.65
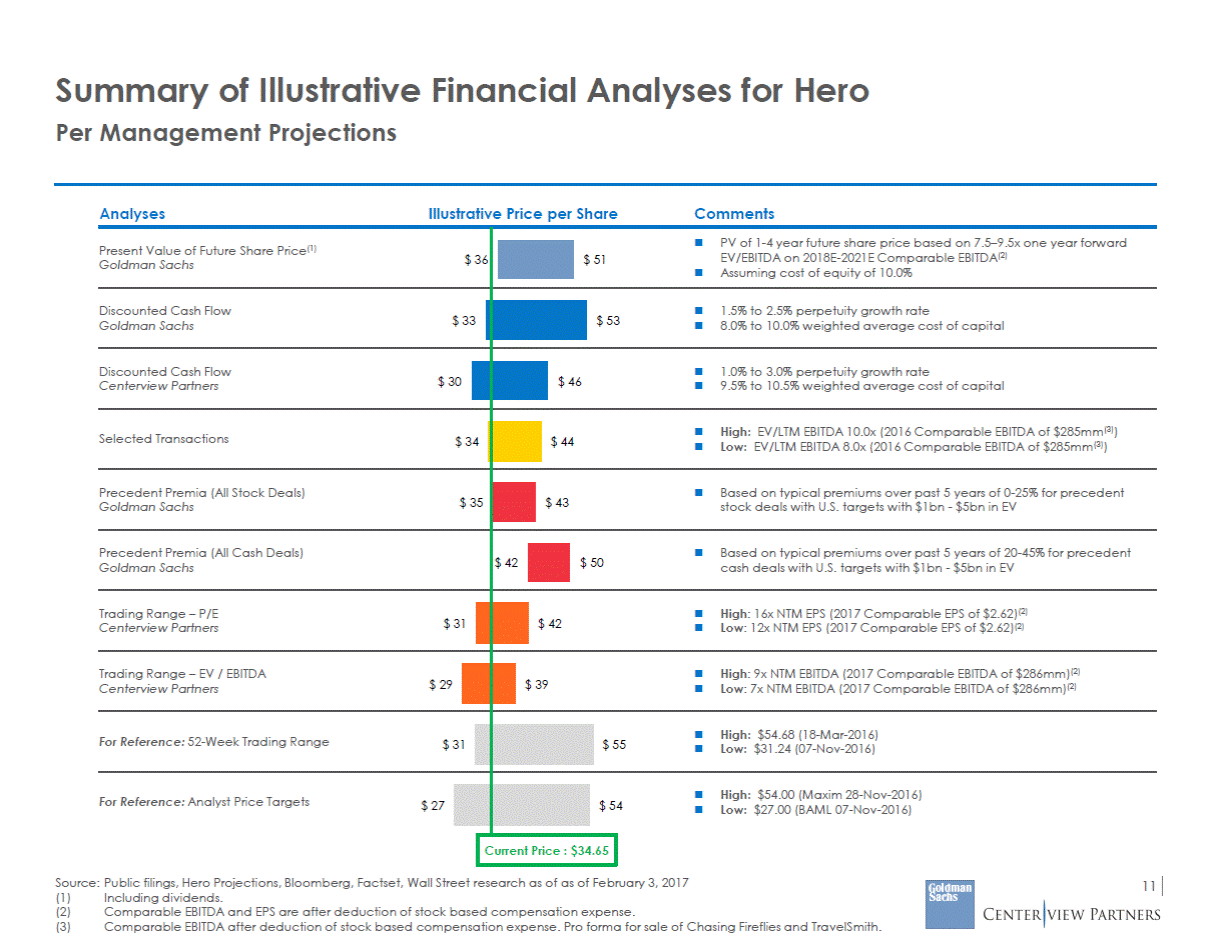
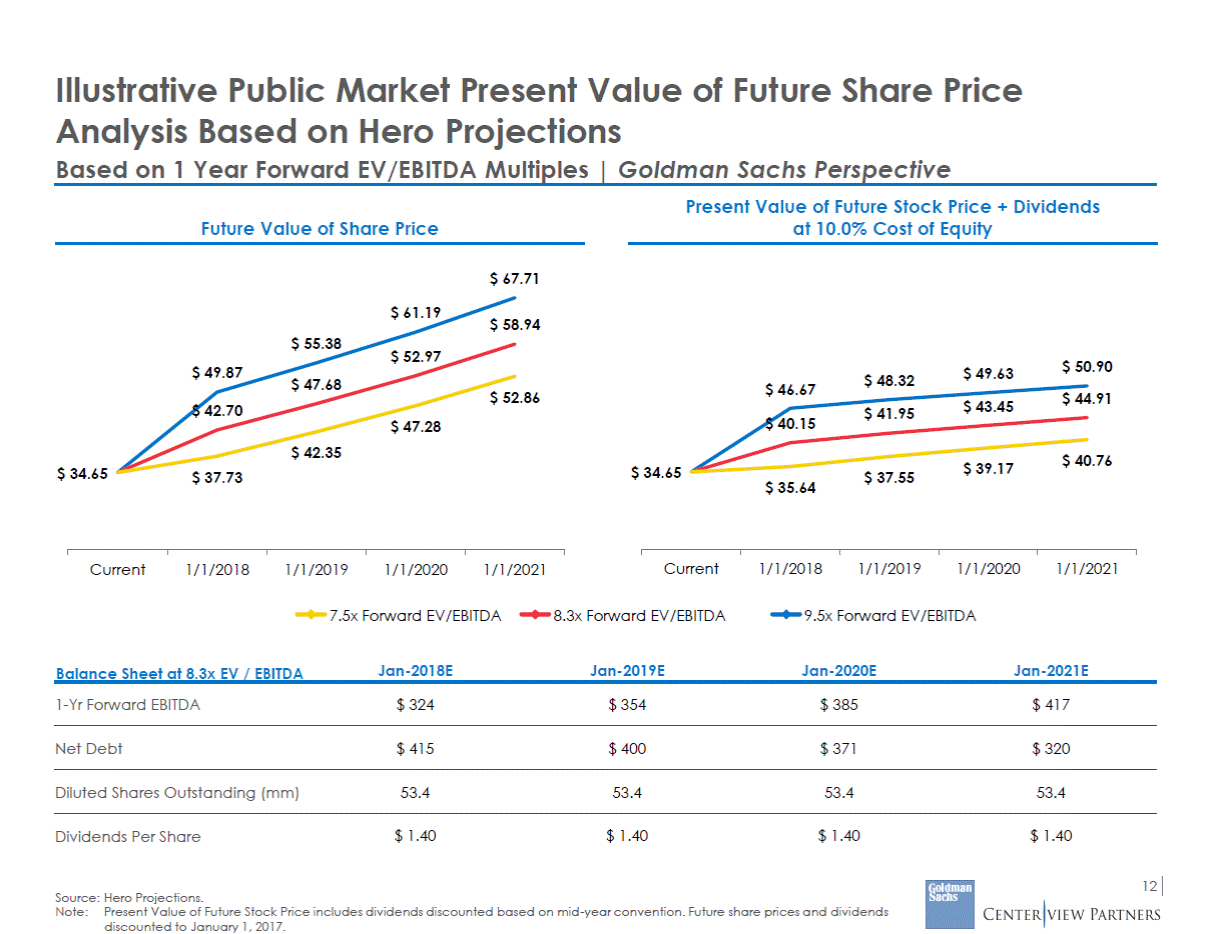
Illustrative Public Market Present Value of Future Share Price Analysis Based on Hero Projections Based on 1 Year Forward EV/EBITDA Multiples | Goldman Sachs Perspective Present Value of Future Stock Price + Dividends at 10.0% Cost of Equity Future Value of Share Price $ 67.71 $ 61.19 $ 58.94 $ 55.38 $ 52.97 $ 50.90 $ 49.87 $ 49.63 $ 48.32 $ 47.68 $ 46.67 $ 52.86 $ 44.91 $ 43.45 $ 42.70 $ 41.95 $ 40.15 $ 47.28 $ 42.35 $ 40.76 $ 39.17 $ 34.65 $ 34.65 $ 37.73 $ 37.55 $ 35.64 Current 1/1/2018 1/1/2019 1/1/2020 1/1/2021 Current 1/1/2018 1/1/2019 1/1/2020 1/1/2021 7.5x Forward EV/EBITDA 8.3x Forward EV/EBITDA 9.5x Forward EV/EBITDA Balance Sheet at 8.3x EV / EBITDA Jan-2018E Jan-2019E Jan-2020E Jan-2021E $ 324 $ 354 $ 385 $ 417 1-Yr Forward EBITDA Net Debt $ 415 $ 400 $ 371 $ 320 Diluted Shares Outstanding (mm) 53.4 53.4 53.4 53.4 Dividends Per Share $ 1.40 $ 1.40 $ 1.40 $ 1.40 12 Source: Hero Projections. Note:Present Value of Future Stock Price includes dividends discounted based on mid-year convention. Future share prices and dividends discounted to January 1, 2017.
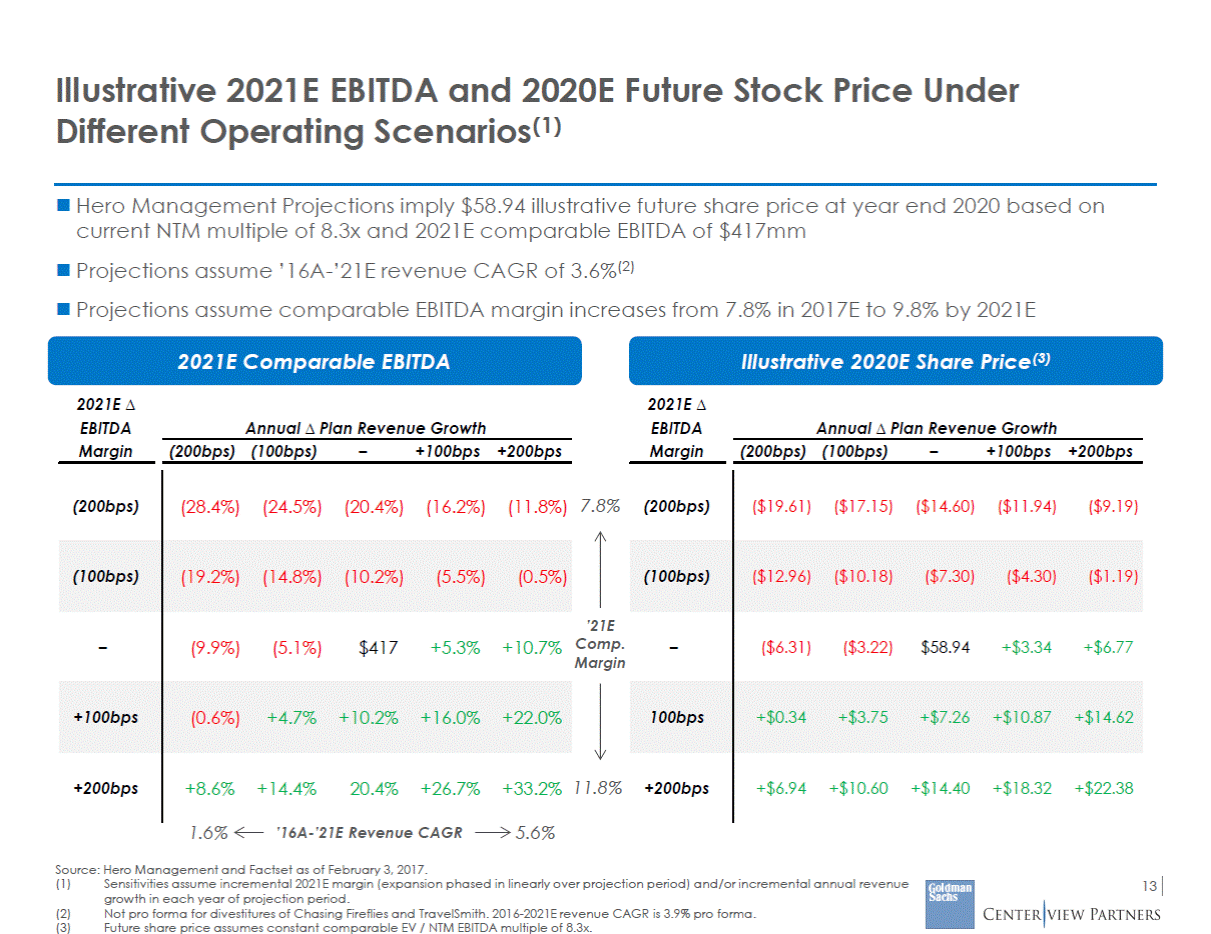
Illustrative 2021E EBITDA and 2020E Future Stock Price Under Different Operating Scenarios(1) Hero Management Projections imply $58.94 illustrative future share price at year end 2020 based on current NTM multiple of 8.3x and 2021E comparable EBITDA of $417mm Projections assume ’16A-’21E revenue CAGR of 3.6%(2) Projections assume comparable EBITDA margin increases from 7.8% in 2017E to 9.8% by 2021E 2021E Comparable EBITDA Illustrative 2020E Share Price(3) 2021E EBITDA Margin 2021E EBITDA Margin Annual Plan Revenue Growth Annual Plan Revenue Growth (200bps) (100bps) – +100bps +200bps (200bps) (100bps) – +100bps +200bps 7.8% ’21E Comp. Margin 11.8% 1.6% 5.6% ’16A-’21E Revenue CAGR Source: Hero Management and Factset as of February 3, 2017. (1) Sensitivities assume incremental 2021E margin (expansion phased in linearly over projection period) and/or incremental annual revenue growth in each year of projection period. Not pro forma for divestitures of Chasing Fireflies and TravelSmith. 2016-2021E revenue CAGR is 3.9% pro forma. Future share price assumes constant comparable EV / NTM EBITDA multiple of 8.3x. 13 (2) (3) (200bps) ($19.61)($17.15)($14.60)($11.94)($9.19) (100bps) ($12.96)($10.18)($7.30)($4.30)($1.19) – ($6.31)($3.22)$58.94+$3.34+$6.77 100bps +$0.34+$3.75+$7.26+$10.87+$14.62 +200bps +$6.94+$10.60+$14.40+$18.32+$22.38 (200bps) (28.4%) (24.5%) (20.4%) (16.2%) (11.8%) (100bps) (19.2%) (14.8%) (10.2%) (5.5%) (0.5%) – (9.9%) (5.1%) $417 +5.3% +10.7% +100bps (0.6%) +4.7% +10.2% +16.0% +22.0% +200bps +8.6% +14.4% 20.4% +26.7% +33.2%
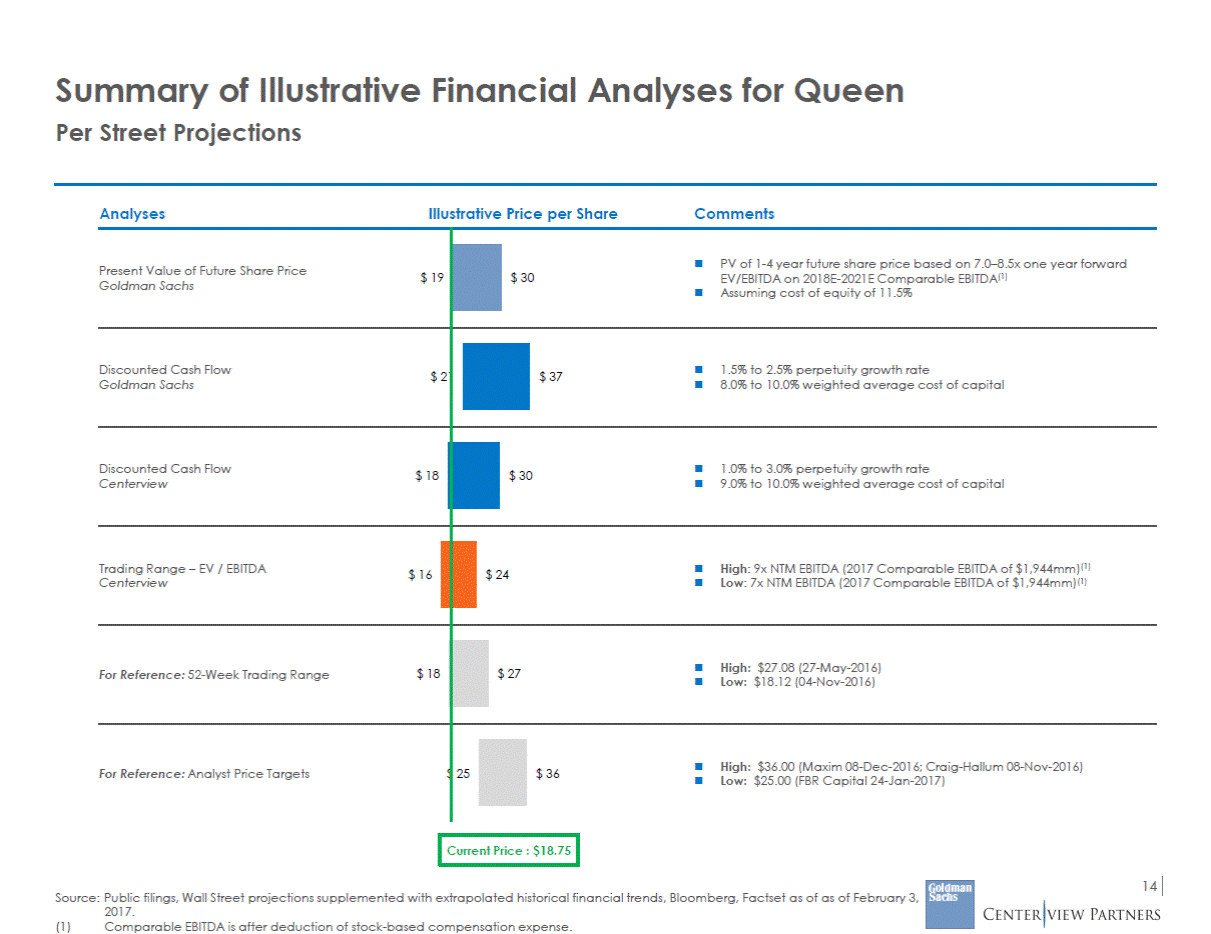
Summary of Illustrative Financial Analyses for Queen Per Street Projections Analyses Illustrative Price per Share Comments $ 30 EV/EBITDA on 2018E-2021E Comparable EBITDA(1) 1.5% to 2.5% perpetuity growth rate 21 $ 37 9.0% to 10.0% weighted average cost of capital Low: 7x NTM EBITDA (2017 Comparable EBITDA of $1,944mm)(1) Low: $18.12 (04-Nov-2016) Low: $25.00 (FBR Capital 24-Jan-2017) 14 Source: Public filings, Wall Street projections supplemented with extrapolated historical financial trends, Bloomberg, Factset as of as of February 3, 2017. (1) Comparable EBITDA is after deduction of stock-based compensation expense. Current Price : $18.75 Present Value of Future Share Price Goldman Sachs$ 19 PV of 1-4 year future share price based on 7.0–8.5x one year forward Assuming cost of equity of 11.5% Discounted Cash Flow$ Goldman Sachs 8.0% to 10.0% weighted average cost of capital Discounted Cash Flow$ 18 Centerview $ 301.0% to 3.0% perpetuity growth rate Trading Range – EV / EBITDA$ 16 Centerview $ 24High: 9x NTM EBITDA (2017 Comparable EBITDA of $1,944mm)(1) For Reference: 52-Week Trading Range$ 18 $ 27High: $27.08 (27-May-2016) For Reference: Analyst Price Targets$ 25$ 36High: $36.00 (Maxim 08-Dec-2016; Craig-Hallum 08-Nov-2016)
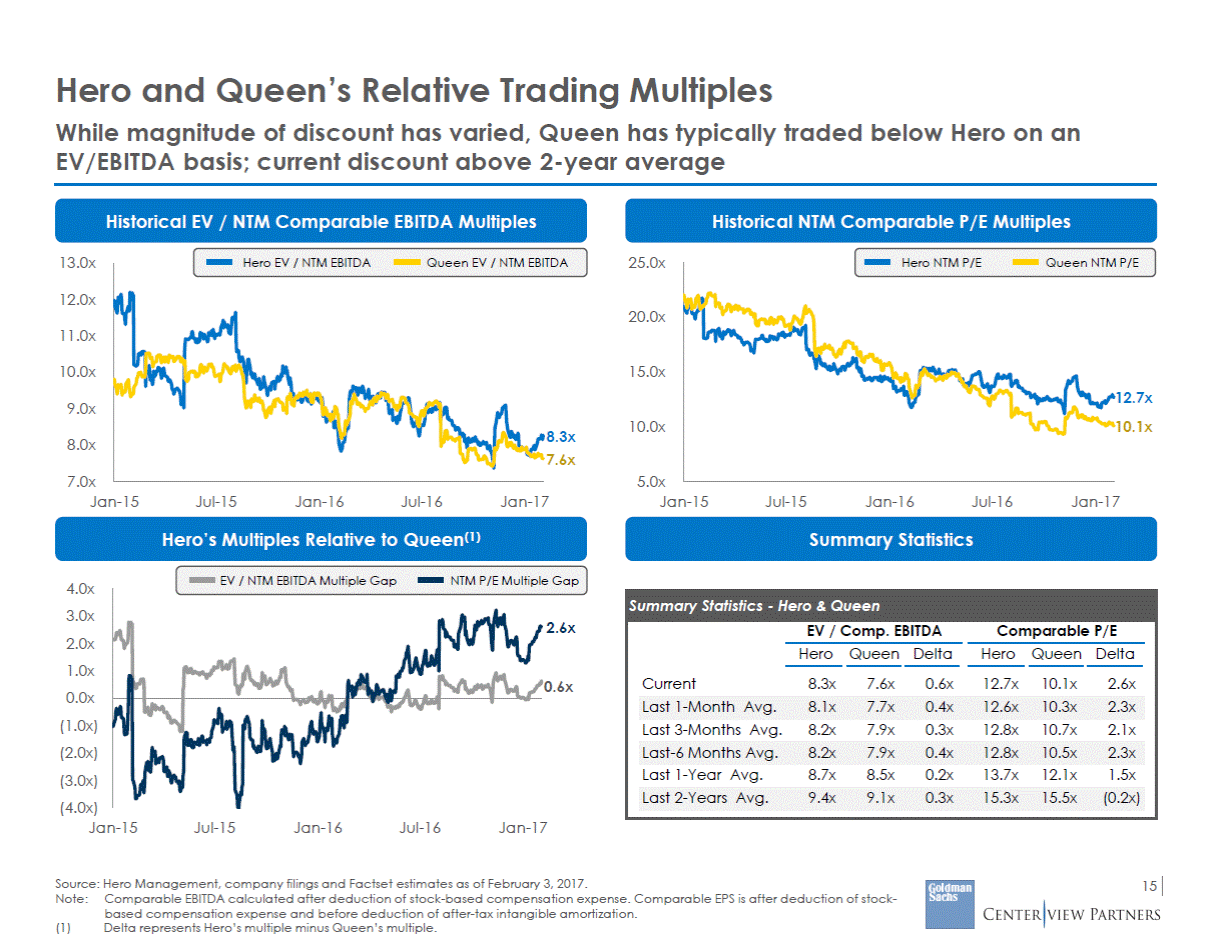
Hero and Queen’s Relative Trading Multiples While magnitude of discount has varied, Queen has typically traded below Hero on an EV/EBITDA basis; current discount above 2-year average Historical EV / NTM Comparable EBITDA Multiples Historical NTM Comparable P/E Multiples 13.0x 25.0x Hero EV / NTM EBITDA Queen EV / NTM EBITDA Hero NTM P/E Queen NTM P/E 12.0x 20.0x 11.0x 10.0x 15.0x 12.7x 10.1x 9.0x 10.0x 8.3x 7.6x 8.0x 5.0x 7.0x Jan-15 Jul-15 Jan-16 Jul-16 Jan-17 Jan-15 Jul-15 Jan-16 Jul-16 Jan-17 Hero’s Multiples Relative to Queen(1) Summary Statistics EV / NTM EBITDA Multiple Gap NTM P/E Multiple Gap 4.0x 3.0x 2.0x 1.0x 0.0x (1.0x) (2.0x) (3.0x) (4.0x) 2.6x 0.6x Jan-15 Jul-15 Jan-16 Jul-16 Jan-17 Source: Hero Management, company filings and Factset estimates as of February 3, 2017. Note:Comparable EBITDA calculated after deduction of stock-based compensation expense. Comparable EPS is after deduction of stock-based compensation expense and before deduction of after-tax intangible amortization. 15 (1) Delta represents Hero’s multiple minus Queen’s multiple. Summary Statistics - Hero & Queen EV / Comp. EBITDA Comparable P/E Hero Queen Delta Hero Queen Delta Current 8.3x 7.6x 0.6x 12.7x 10.1x 2.6x Last 3-Months Avg. 8.2x 7.9x 0.3x 12.8x 10.7x 2.1x Last 1-Year Avg. 8.7x 8.5x 0.2x 13.7x 12.1x 1.5x Last 2-Years Avg. 9.4x 9.1x 0.3x 15.3x 15.5x (0.2x) Last-6 Months Avg. 8.2x 7.9x 0.4x 12.8x 10.5x 2.3x Last 1-Month Avg. 8.1x 7.7x 0.4x 12.6x 10.3x 2.3x
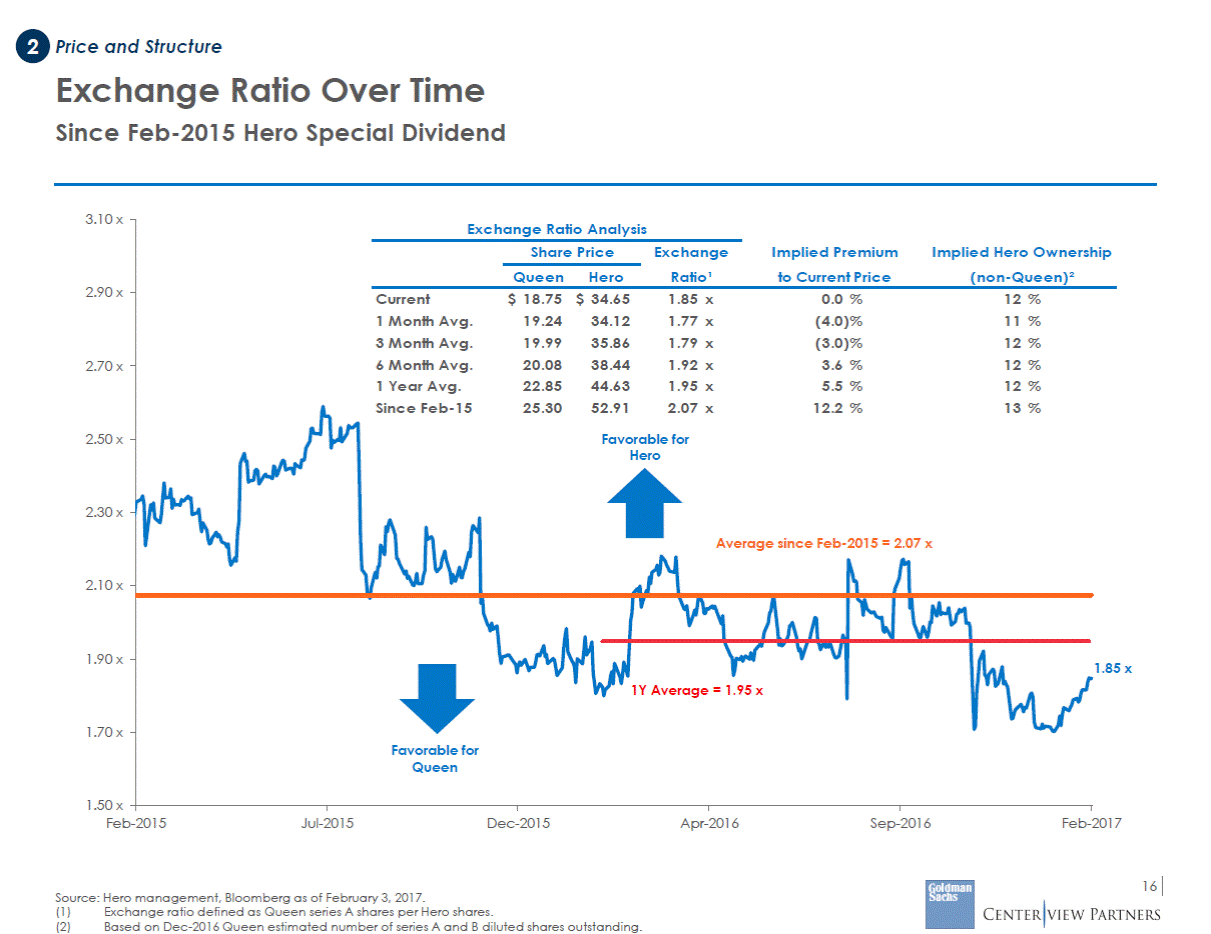
2 Price and Structure Exchange Ratio Over Time Since Feb-2015 Hero Special Dividend 3.10 x hip 2.90 x 2.70 x 2.50 x 2.30 x 2.10 x 1.90 x 1.85 x 1.70 x 1.50 x Feb-2015 Jul-2015 Dec-2015 Apr-2016 Sep-2016 Feb-2017 16 Source: Hero management, Bloomberg as of February 3, 2017. (1) (2) Exchange ratio defined as Queen series A shares per Hero shares. Based on Dec-2016 Queen estimated number of series A and B diluted shares outstanding. Exchange Ratio Analysis Share Price Exchange Implied Premium Implied Hero Owners Queen Hero Ratio¹ to Current Price (non-Queen)² Current $ 18.75 $ 34.65 1.85 x 0.0 % 12 % 1 Month Avg. 19.24 34.12 1.77 x (4.0)% 11 % 3 Month Avg. 19.99 35.86 1.79 x (3.0)% 12 % 6 Month Avg. 20.08 38.44 1.92 x 3.6 % 12 % 1 Year Avg. 22.85 44.63 1.95 x 5.5 % 12 % Since Feb-15 25.30 52.91 2.07 x 12.2 % 13 % Favorable for Hero Average since Feb-2015 = 2.07 x 1Y Average = 1.95 x Favorable for Queen
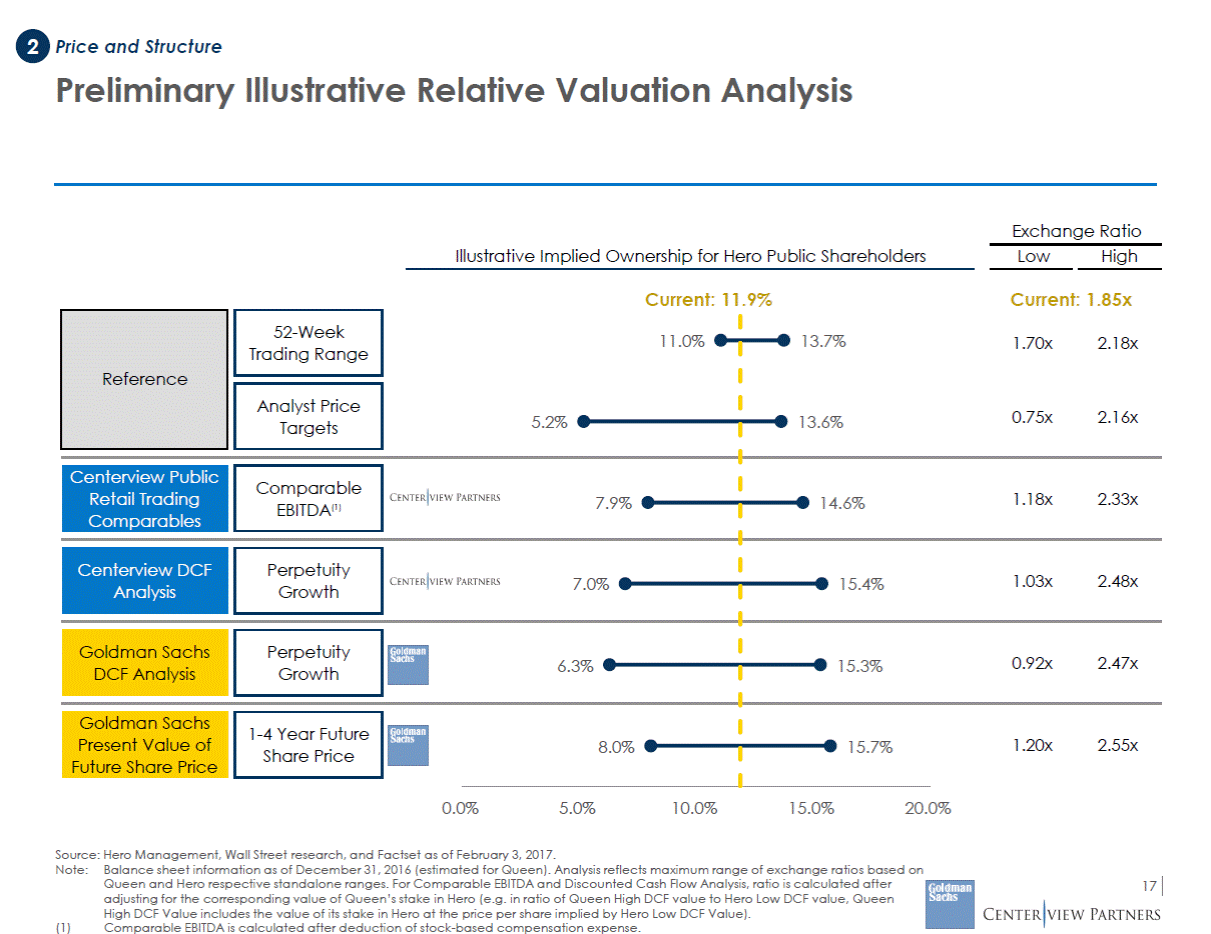
2 Price and Structure Preliminary Illustrative Relative Valuation Analysis Exchange Ratio Illustrative Implied Ownership for Hero Public Shareholders Low High Current: 11.9% Current: 1.85x 14.6% Comparables 0.0% 5.0% 10.0% 15.0% 20.0% Source: Hero Management, Wall Street research, and Factset as of February 3, 2017. Note:Balance sheet information as of December 31, 2016 (estimated for Queen). Analysis reflects maximum range of exchange ratios based on Queen and Hero respective standalone ranges. For Comparable EBITDA and Discounted Cash Flow Analysis, ratio is calculated after adjusting for the corresponding value of Queen’s stake in Hero (e.g. in ratio of Queen High DCF value to Hero Low DCF value, Queen High DCF Value includes the value of its stake in Hero at the price per share implied by Hero Low DCF Value). 17 (1) Comparable EBITDA is calculated after deduction of stock-based compensation expense. 5.2% 11.0% 13.7%1.70x2.18x 13.6%0.75x2.16x 7.9% 1.18x2.33x 7.0% 15.4%1.03x2.48x 6.3% 15.3%0.92x2.47x 8.0% 15.7% 1.20x2.55x Goldman Sachs Present Value of Future Share Price 1-4 Year Future Share Price Goldman Sachs DCF Analysis Perpetuity Growth Centerview DCF Analysis Perpetuity Growth Centerview Public Retail Trading Comparable EBITDA (1) Analyst Price Targets 52-Week Trading Range Reference
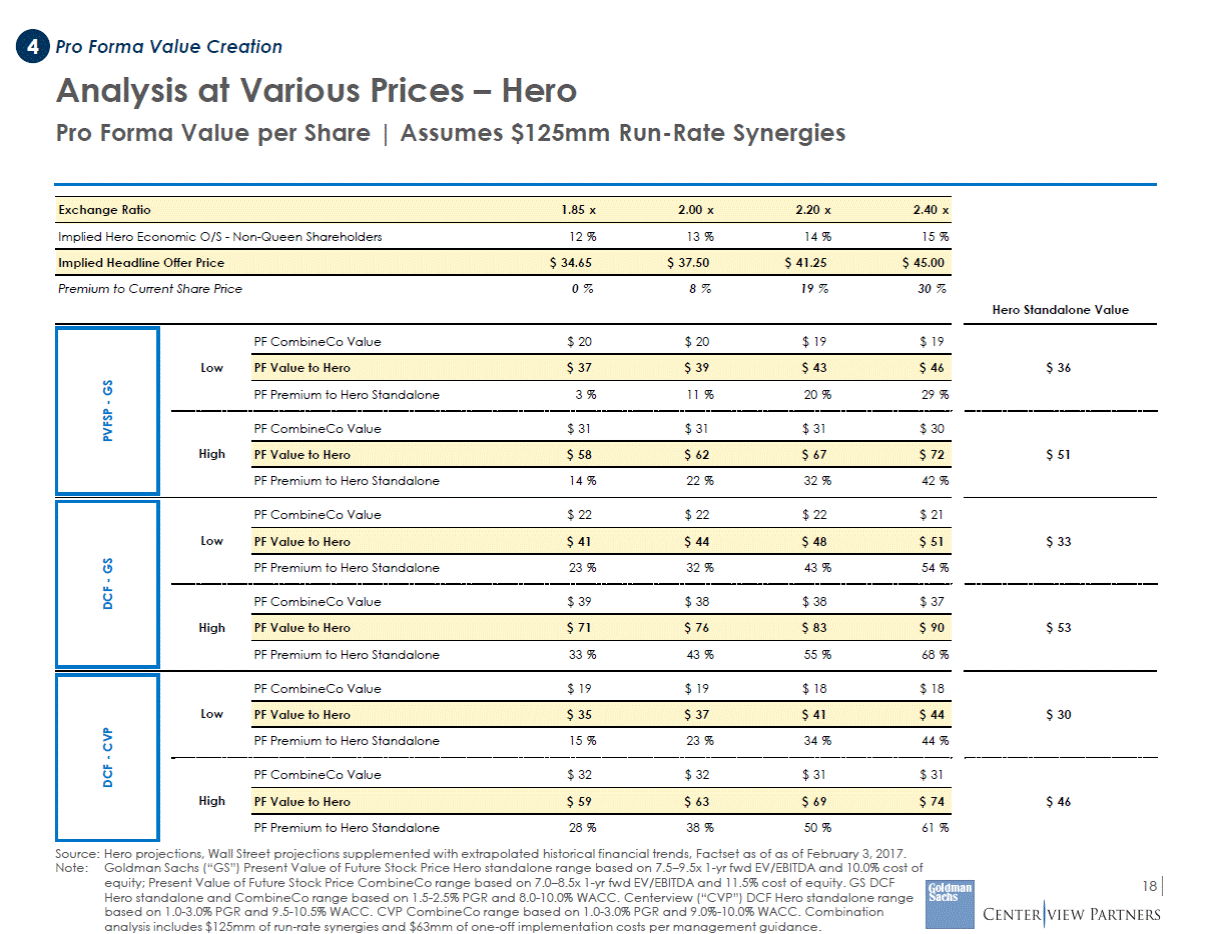
4 Pro Forma Value Creation Analysis at Various Prices – Hero Pro Forma Value per Share | Assumes $125mm Run-Rate Synergies Implied Hero Economic O/S - Non-Queen Shareholders 12 % 13 % 14 % 15 % Premium to Current Share Price 0 % 8 % 19 % 30 % Hero Standalone Value PF CombineCo Value $ 20 $ 20 $ 19 $ 19 Low $ 36 PF Premium to Hero Standalone 3 % 11 % 20 % 29 % PF CombineCo Value $ 31 $ 31 $ 31 $ 30 High $ 51 PF Premium to Hero Standalone 14 % 22 % 32 % 42 % $ 33 $ 53 $ 30 $ 46 Source: Hero projections, Wall Street projections supplemented with extrapolated historical financial trends, Factset as of as of February 3, 2017. Note:Goldman Sachs (“GS”) Present Value of Future Stock Price Hero standalone range based on 7.5–9.5x 1-yr fwd EV/EBITDA and 10.0% cost of equity; Present Value of Future Stock Price CombineCo range based on 7.0–8.5x 1-yr fwd EV/EBITDA and 11.5% cost of equity. GS DCF Hero standalone and CombineCo range based on 1.5-2.5% PGR and 8.0-10.0% WACC. Centerview (“CVP”) DCF Hero standalone range based on 1.0-3.0% PGR and 9.5-10.5% WACC. CVP CombineCo range based on 1.0-3.0% PGR and 9.0%-10.0% WACC. Combination analysis includes $125mm of run-rate synergies and $63mm of one-off implementation costs per management guidance. 18 PVFSP - GS DCF - GS PF CombineCo Value$ 22$ 22$ 22$ 21 Low PF Premium to Hero Standalone23 %32 %43 %54 % PF CombineCo Value$ 39$ 38$ 38$ 37 High PF Premium to Hero Standalone33 %43 %55 %68 % DCF - CVP PF CombineCo Value$ 19$ 19$ 18$ 18 Low PF Premium to Hero Standalone15 %23 %34 %44 % PF CombineCo Value$ 32$ 32$ 31$ 31 High PF Premium to Hero Standalone28 %38 %50 %61 % PF Value to Hero$ 59$ 63$ 69$ 74 PF Value to Hero$ 35$ 37$ 41$ 44 PF Value to Hero$ 71$ 76$ 83$ 90 PF Value to Hero$ 41$ 44$ 48$ 51 PF Value to Hero$ 58$ 62$ 67$ 72 PF Value to Hero$ 37$ 39$ 43$ 46 Implied Headline Offer Price$ 34.65$ 37.50$ 41.25$ 45.00 Exchange Ratio1.85 x2.00 x2.20 x2.40 x
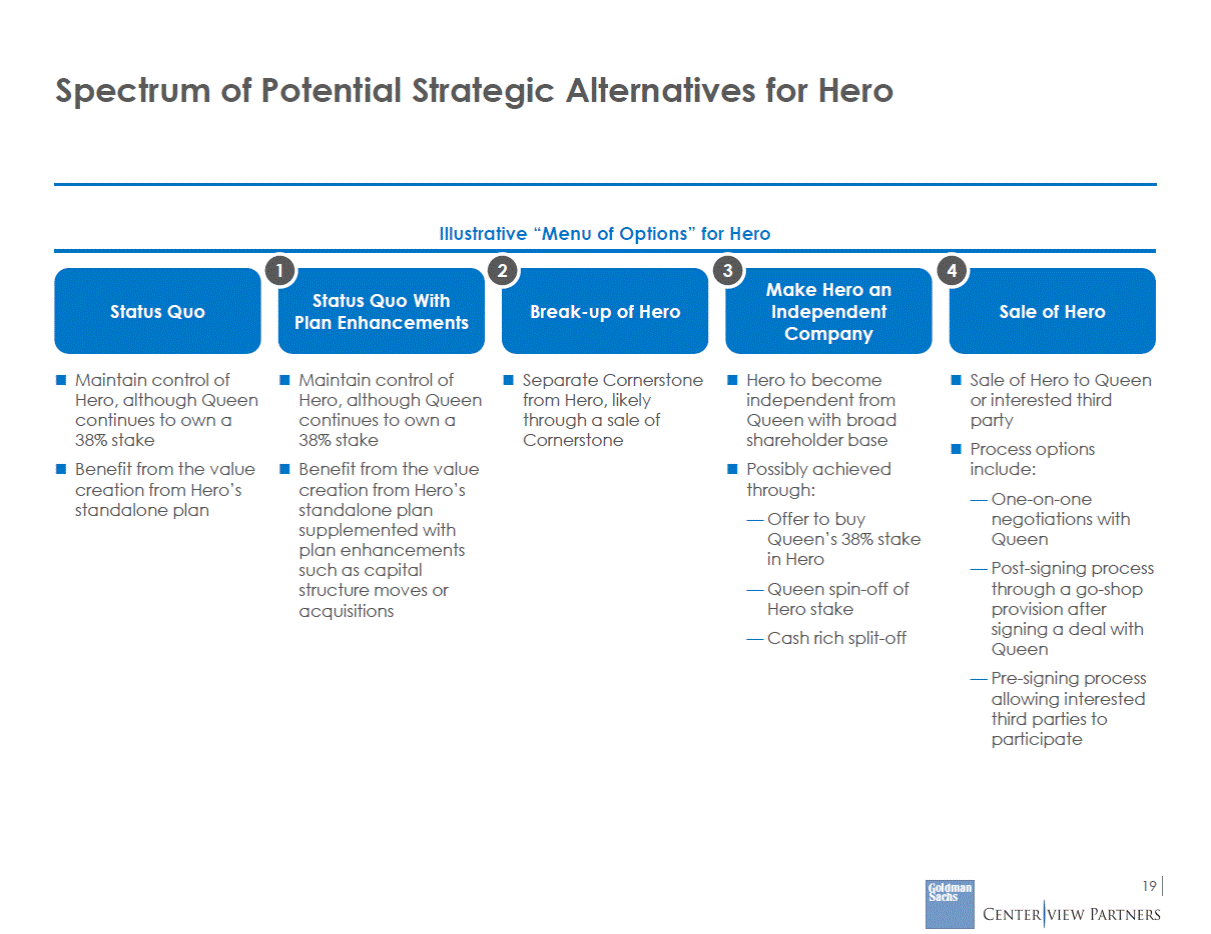
Spectrum of Potential Strategic Alternatives for Hero Illustrative “Menu of Options” for Hero 1 2 3 4 Make Hero an Independent Company Status Quo With Plan Enhancements Status Quo Break-up of Hero Sale of Hero Maintain control of Hero, although Queen continues to own a 38% stake Benefit from the value creation from Hero’s standalone plan Maintain control of Hero, although Queen continues to own a 38% stake Benefit from the value creation from Hero’s standalone plan supplemented with plan enhancements such as capital structure moves or acquisitions Separate Cornerstone from Hero, likely through a sale of Cornerstone Hero to become independent from Queen with broad shareholder base Possibly achieved through: — Offer to buy Queen’s 38% stake in Hero — Queen spin-off of Hero stake — Cash rich split-off Sale of Hero to Queen or interested third party Process options include: — One-on-one negotiations with Queen — Post-signing process through a go-shop provision after signing a deal with Queen — Pre-signing process allowing interested third parties to participate 19
