--CONFIDENTIAL --Disclaimer (Centerview Partners) This presentation has been prepared by Centerview Partners LLC (“Centerview”) for use solely by the Special Committee of the Board of Directors of HSN, Inc. (“Hero” or the “Company”) in connection with its evaluation of a proposed transaction involving the Company and for no other purpose. The information contained herein is based upon information supplied by Hero and publicly available information, and portions of the information contained herein may be based upon statements, estimates and forecasts provided by the Company. Centerview has relied upon the accuracy and completeness of the foregoing information, and have not assumed any responsibility for any independent verification of such information or for any independent evaluation or appraisal of any of the assets or liabilities (contingent or otherwise) of the Company or any other entity, or concerning the solvency or fair value of the Company or any other entity. With respect to financial forecasts, including with respect to estimates of potential synergies, Centerview has assumed that such forecasts have been reasonably prepared on bases reflecting the best currently available estimates and judgments of the management of the Company as to its financial performances, and at your direction Centerview has relied upon such forecasts, as provided by the Company’s management, with respect to the Company, including as to expected synergies. Centerview assumes no responsibility for and expresses no view as to such forecasts or the assumptions on which they are based. The information set forth herein is based upon economic, monetary, market and other conditions as in effect on, and the information made available to us as of, the date hereof, unless indicated otherwise and Centerview assumes no obligation to update or otherwise revise these materials. The financial analysis in this presentation is complex and is not necessarily susceptible to a partial analysis or summary description. In performing this financial analysis, Centerview has considered the results of its analysis as a whole and did not necessarily attribute a particular weight to any particular portion of the analysis considered. Furthermore, selecting any portion of Centerview’s analysis, without considering the analysis as a whole, would create an incomplete view of the process underlying its financial analysis. Centerview may have deemed various assumptions more or less probable than other assumptions, so the reference ranges resulting from any particular portion of the analysis described above should not be taken to be Centerview’s view of the actual value of the Company. These materials and the information contained herein are confidential, were not prepared with a view toward public disclosure, and may not be disclosed publicly or made available to third parties without the prior written consent of Centerview. These materials and any other advice, written or oral, rendered by Centerview are intended solely for the benefit and use of the Special Committee of the Board of Directors of the Company (in its capacity as such) in its consideration of the proposed transaction, and are not for the benefit of, and do not convey any rights or remedies for any holder of securities of the Company or any other person. Centerview will not be responsible for and has not provided any tax, accounting, actuarial, legal or other specialist advice. These materials are not intended to provide the sole basis for evaluating the proposed transaction, and this presentation does not represent a fairness opinion, recommendation, valuation or opinion of any kind, and is necessarily incomplete and should be viewed solely in conjunction with the oral presentation provided by Centerview. 1
--CONFIDENTIAL --Disclaimer (Goldman Sachs) These materials have been prepared and are provided by Goldman Sachs on a confidential basis solely for the information and assistance of the Special Committee of the Board of Directors (the "Special Committee") of Hero (the "Company") in connection with its consideration of the matters referred to herein. These materials and Goldman Sachs’ presentation relating to these materials (the “Confidential Information”) may not be disclosed to any third party or circulated or referred to publicly or used for or relied upon for any other purpose without the prior written consent of Goldman Sachs. The Confidential Information was not prepared with a view to public disclosure or to conform to any disclosure standards under any state, federal or international securities laws or other laws, rules or regulations, and Goldman Sachs does not take any responsibility for the use of the Confidential Information by persons other than those set forth above. Notwithstanding anything in this Confidential Information to the contrary, the Company may disclose to any person the US federal income and state income tax treatment and tax structure of any transaction described herein and all materials of any kind (including tax opinions and other tax analyses) that are provided to the Company relating to such tax treatment and tax structure, without Goldman Sachs imposing any limitation of any kind. The Confidential Information has been prepared by the Investment Banking Division of Goldman Sachs and is not a product of its research department. Goldman Sachs and its affiliates are engaged in advisory, underwriting and financing, principal investing, sales and trading, research, investment management and other financial and non-financial activities and services for various persons and entities. Goldman Sachs and its affiliates and employees, and funds or other entities they manage or in which they invest or have other economic interests or with which they co-invest, may at any time purchase, sell, hold or vote long or short positions and investments in securities, derivatives, loans, commodities, currencies, credit default swaps and other financial instruments of the Company, any other party to any transaction and any of their respective affiliates or any currency or commodity that may be involved in any transaction. Goldman Sachs’ investment banking division maintains regular, ordinary course client service dialogues with clients and potential clients to review events, opportunities, and conditions in particular sectors and industries and, in that connection, Goldman Sachs may make reference to the Company, but Goldman Sachs will not disclose any confidential information received from the Company. The Confidential Information has been prepared based on historical financial information, forecasts and other information obtained by Goldman Sachs from publicly available sources, the management of the Company or other sources (approved for our use by the Company in the case of information from management and non-public information). In preparing the Confidential Information, Goldman Sachs has relied upon and assumed, without assuming any responsibility for independent verification, the accuracy and completeness of all of the financial, legal, regulatory, tax, accounting and other information provided to, discussed with or reviewed by us, and Goldman Sachs does not assume any liability for any such information. Goldman Sachs does not provide accounting, tax, legal or regulatory advice. Goldman Sachs has not made an independent evaluation or appraisal of the assets and liabilities (including any contingent, derivative or other off-balance sheet assets and liabilities) of the Company or any other party to any transaction or any of their respective affiliates and has no obligation to evaluate the solvency of the Company or any other party to any transaction under any state or federal laws relating to bankruptcy, insolvency or similar matters. The analyses contained in the Confidential Information do not purport to be appraisals nor do they necessarily reflect the prices at which businesses or securities actually may be sold or purchased. Goldman Sachs’ role in any due diligence review is limited solely to performing such a review as it shall deem necessary to support its own advice and analysis and shall not be on behalf of the Company. Analyses based upon forecasts of future results are not necessarily indicative of actual future results, which may be significantly more or less favorable than suggested by these analyses, and Goldman Sachs does not assume responsibility if future results are materially different from those forecast. The Confidential Information does not address the underlying business decision of the Company to engage in any transaction, or the relative merits of any transaction or strategic alternative referred to herein as compared to any other transaction or alternative that may be available to the Company. The Confidential Information is necessarily based on economic, monetary, market and other conditions as in effect on, and the information made available to Goldman Sachs as of, the date of such Confidential Information and Goldman Sachs assumes no responsibility for updating or revising the Confidential Information based on circumstances, developments or events occurring after such date. The Confidential Information does not constitute any opinion, nor does the Confidential Information constitute a recommendation to the Special Committee, any security holder of the Company or any other person as to how to vote or act with respect to any transaction or any other matter. The Confidential Information, including this disclaimer, is subject to, and governed by, any written agreement between the Company, the Board and/or any committee thereof, on the one hand, and Goldman Sachs, on the other hand. 2
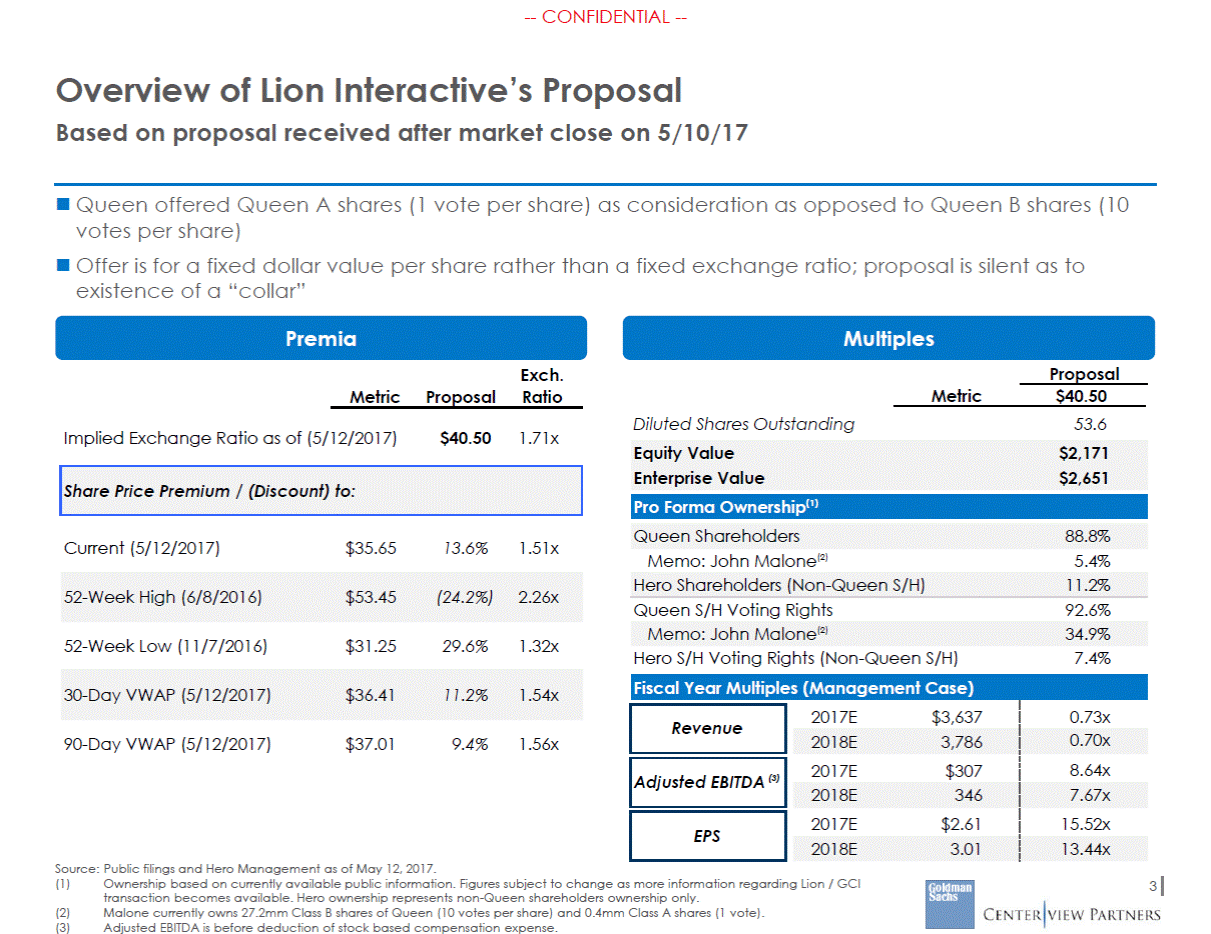
--CONFIDENTIAL --Overview of Lion Interactive’s Proposal Based on proposal received after market close on 5/10/17 Queen offered Queen A shares (1 vote per share) as consideration as opposed to Queen B shares (10 votes per share) Offer is for a fixed dollar value per share rather than a fixed exchange ratio; proposal is silent as to existence of a “collar” Premia Multiples Exch. Ratio Proposal Metric $40.50 Metric Proposal Diluted Shares Outstanding 53.6 Implied Exchange Ratio as of (5/12/2017) $40.50 1.71x Current (5/12/2017) $35.65 13.6% 1.51x Memo: John Malone(2) 5.4% Queen S/H Voting Rights 92.6% 52-Week Low (11/7/2016) $31.25 29.6% 1.32x Hero S/H Voting Rights (Non-Queen S/H) 7.4% 90-Day VWAP (5/12/2017) $37.01 9.4% 1.56x Source: Public filings and Hero Management as of May 12, 2017. (1) Ownership based on currently available public information. Figures subject to change as more information regarding Lion / GCI transaction becomes available. Hero ownership represents non-Queen shareholders ownership only. Malone currently owns 27.2mm Class B shares of Queen (10 votes per share) and 0.4mm Class A shares (1 vote). Adjusted EBITDA is before deduction of stock based compensation expense. 3 (2) (3) Fiscal Year Multiples (Management Case) 0.73x Revenue 2017E$3,637 2018E3,786 0.70x 2017E$307 8.64x Adjusted EBITDA (3) 2018E346 7.67x EPS 2017E$2.61 15.52x 2018E3.01 13.44x 30-Day VWAP (5/12/2017)$36.4111.2%1.54x Memo: John Malone(2)34.9% 52-Week High (6/8/2016)$53.45(24.2%)2.26x Hero Shareholders (Non-Queen S/H)11.2% Queen Shareholders88.8% Pro Forma Ownership(1) Share Price Premium / (Discount) to: Equity Value$2,171 Enterprise Value$2,651
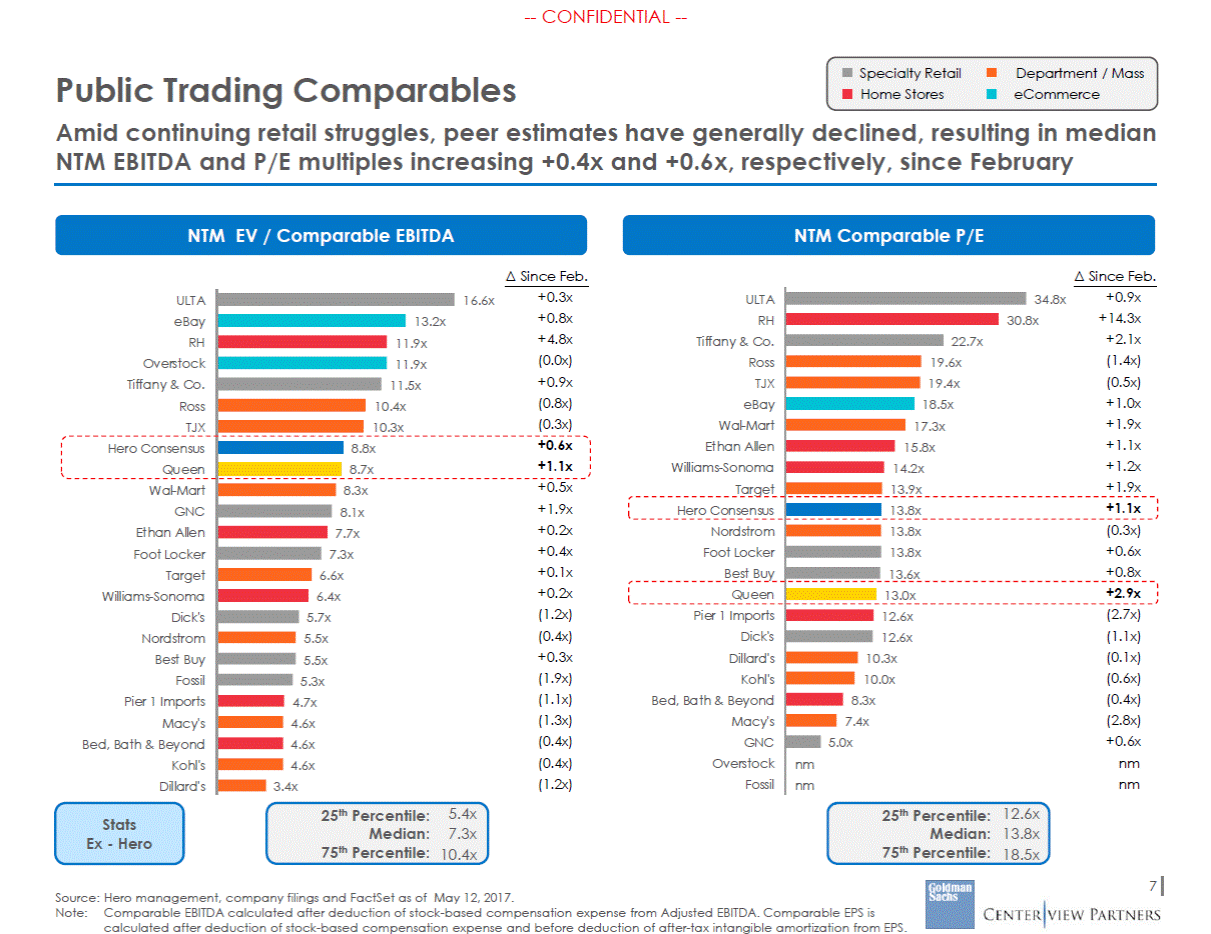
--CONFIDENTIAL --Year-to-Date Share Price Performance and Exchange Ratio Development Hero and Queen 150% 3.00 x Hero announces 1Q17 140% 2.80 x 130% 2.60 x 120% 2.40 x $ 23.67 110% 2.20 x $ 35.65 100% 2.00 x 90% 1.80 x Current Offer: 1.71x 1.60 x 80% 1.51 x 70% 1.40 x in U.S. gives confidence 60% 1.20 x Queen: 11.4% 50% 1.00 x 1-Jan-2017 17-Jan-2017 2-Feb-2017 18-Feb-2017 6-Mar-201722-Mar-20177-Apr-2017 23-Apr-2017 9-May-2017 Hero Queen Exchange Ratio 4 Source: Bloomberg and IBES as of May 12, 2017. Note: Exchange ratio defined as Queen series A shares per Hero shares. (1) Mindy Grossman’s announcement occurred after close on 26-Apr-2017 and therefore the stock price reaction is shown for 27-Apr-2017. Indexed Share Price Performance (%) 22-Feb-2017 Hero announces 4Q16 earnings, beating consensus on top and bottom line Hero: 7.8% Queen: 4.2% 16-Mar-2017 Wunderlich Securities reduces Hero EBITDA estimates Hero: (0.8)% Queen: 1.2% 26-Apr-20171 Mindy Grossman steps down as CEO of HSN Hero: 1.4% Queen: 1.4% 03-May-2017 earnings, missing revenue estimates but beating EPS estimates Hero: (4.6)% Queen: (1.8)% YTDStock ChangePrice Hero4 % Queen18 % 09-Feb-2017 Hero Special Commmitee meeting with Goldman Sachs and Centerview 28-Feb-2017 Queen reports 4Q16 EPS in-line with estimates, but soft revenue growth in U.S. and zulily Hero: (6.9)% Queen: (5.4)% 04-Apr-2017 Queen announces conversion to an asset-based stock Hero: 1.5% Queen: 2.3% 09-May-2017 Queen reports 1Q17: significant improvement on '17E performance Hero: 1.8%
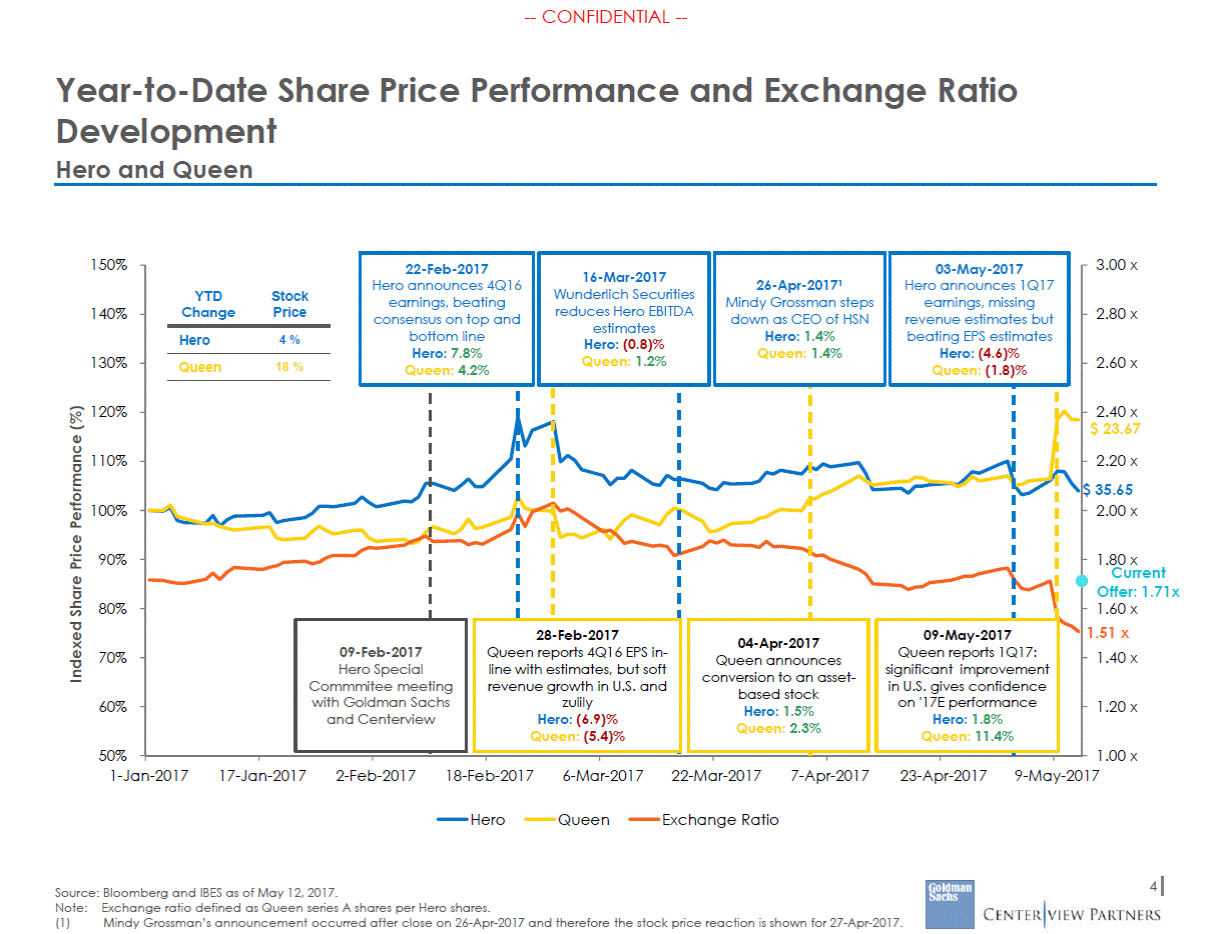
--CONFIDENTIAL --Hero Recent Business Performance Update Business Update Evolution of Estimates Since Feb. Committee Meeting On April 26, 2017, CEO Mindy Grossman, announced her resignation, effective May 24 —Also announced preliminary 1Q17 results —Office of the Chief Executive, consisting of Rod R. Little, William C. Brand and Judy A. Schmeling, to run Company until full-time CEO replacement identified On May 3, 2017, Hero reported mixed 1Q results with net sales down YoY and below consensus estimates —Difficult retail environment —Customer acquisition challenges —Stock dropped 5% day of release Analysts reduced estimates for Hero, noting: —Retail environment a significant headwind for top line growth —Excess / aged inventory could hurt gross profit in near-term —$10mm expenses related to supply chain disruption in 2017 —Expected cost savings being reinvested into marketing and digital capabilities 2017E 2018E (1.0%) (2.4%) $3.7 $3.6 $3.6 $3.5 2/3/17 5/12/17 2/3/17 5/12/17 (8.1%) (8.6%) $333 $306 $304 $281 2/3/17 5/12/17 2/3/17 5/12/17 (9.1%) (5.4%) $2.70 $2.97 $2.81 $2.45 2/3/17 5/12/17 2/3/17 5/12/17 5 Source: Wall Street Research and Factset as of May 12, 2017. Adj. EBITDA ($mm) Revenue ($bn) EPS
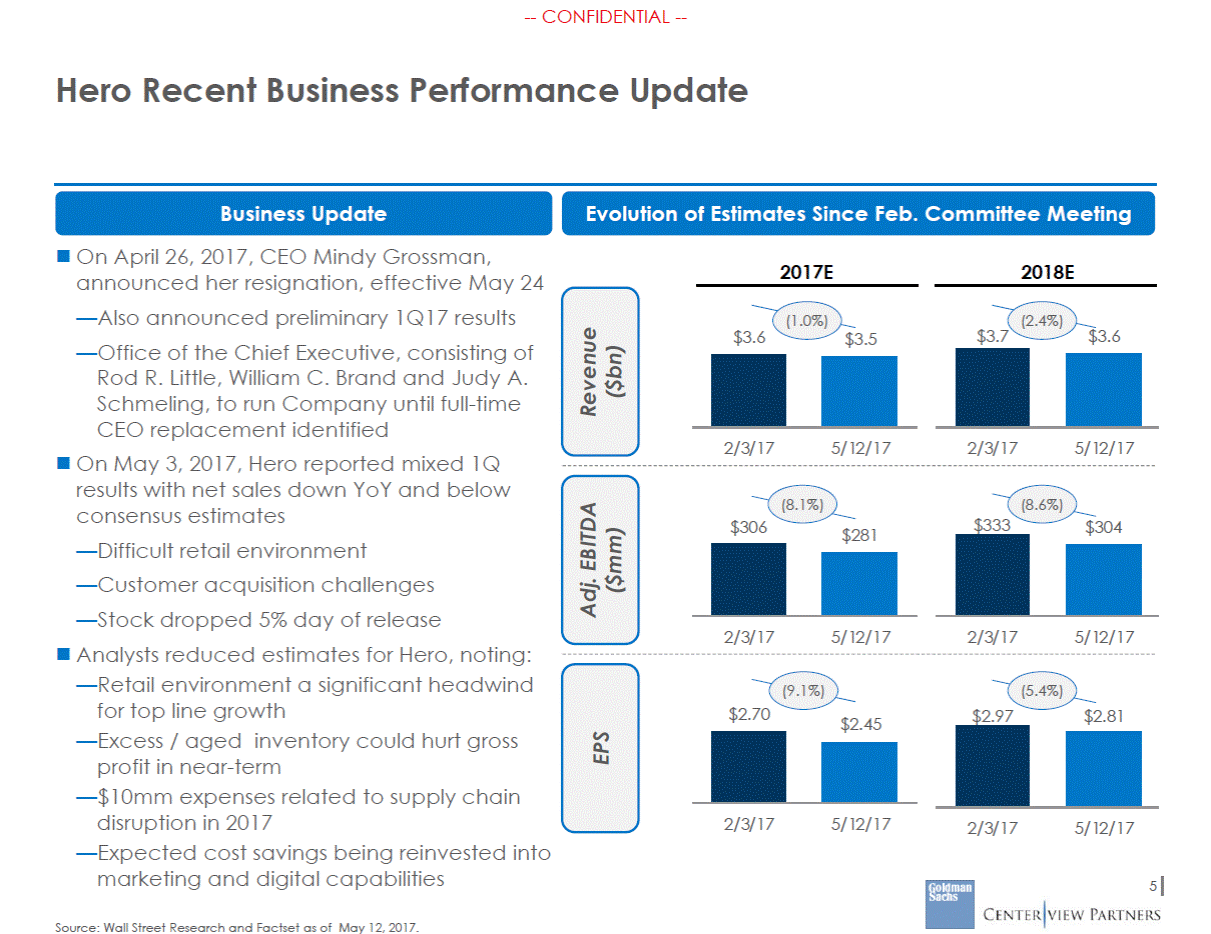
--CONFIDENTIAL --Queen Recent Business Performance Update Business Update On April 4, 2017, Lion Interactive announced agreement for Lion Ventures to acquire GCI and split-off combined company from Lion Interactive/Queen (would result in Queen becoming an asset-based stock) —Transaction included announcement of reattribution of $750mm assets and liabilities to Queen to facilitate separation On May 9, 2017, Queen reported better than expected 1Q results —U.S. revenues declined (3%) vs. the (5%) suggested by management in early March —International revenues were generally in line with consensus; 10% YoY increase in EBITDA margin —zulily sales grew ~1% YoY but were below Street forecasts Results well-received by market; increased confidence in outlook for U.S. business —Stock up 11% on day —Estimates increased (down since February) Evolution of Estimates Since Feb. Committee Meeting 2017E 2018E (3.4%) (4.7%) $11.2 $10.7 $10.7 $10.3 2/3/17 5/12/17 2/3/17 5/12/17 (3.8%) (5.2%) $2.1 $2.0 $2.0 $1.9 2/3/17 5/12/17 2/3/17 5/12/17 (4.7%) (7.8%) $2.37 $2.19 $1.97 $1.87 2/3/17 5/12/17 2/3/17 5/12/17 6 Source: Wall Street Research and Factset as of May 12, 2017. Adj. EBITDA ($bn) Revenue ($bn) EPS
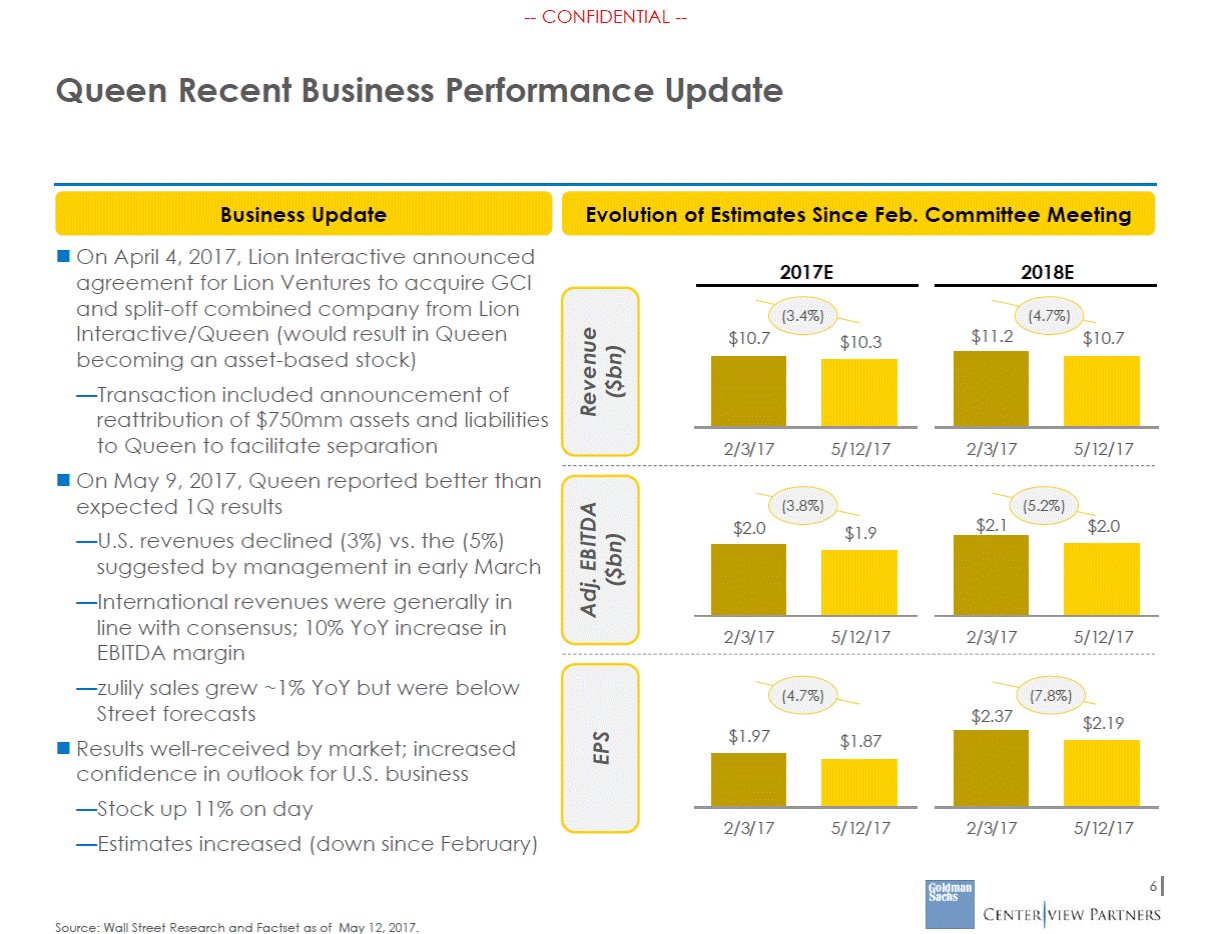
--CONFIDENTIAL --Specialty Retail Home Stores Department / Mass eCommerce Public Trading Comparables Amid continuing retail struggles, peer estimates have generally declined, resulting in median NTM EBITDA and P/E multiples increasing +0.4x and +0.6x, respectively, since February NTM EV / Comparable EBITDA NTM Comparable P/E Since Feb. Since Feb. +0.9x ULT A RH Tiffany & Co. Ross TJX eBay Wal-Mart Et han Allen Williams-Sonoma Target 34.8x 5.4x 7.3x 10.4x 12.6x 13.8x 18.5x 25th Percentile: Median: 75th Percentile: 25th Percentile: Median: 75th Percentile: Stats Ex - Hero 7 Source: Hero management, company filings and FactSet as of May 12, 2017. Note:Comparable EBITDA calculated after deduction of stock-based compensation expense from Adjusted EBITDA. Comparable EPS is calculated after deduction of stock-based compensation expense and before deduction of after-tax intangible amortization from EPS. 30.8x +14.3x 22.7x +2.1x 19.6x (1.4x) 19.4x (0.5x) 18.5x +1.0x 17.3x +1.9x 15.8x +1.1x 14.2x +1.2x 13.9x +1.9x Hero Consensus Nord strom Foot Locker Best Buy 13.8x +1.1x 13.8x (0.3x) 13.8x +0.6x 13.6x +0.8x Queen Pier 1 Imports Dick's Dillard's Kohl's Bed, Ba th & Beyond Macy's GNC Overstock Fossil 13.0x +2.9x 12.6x (2.7x) 12.6x (1.1x) 10.3x (0.1x) 10.0x (0.6x) 8.3x (0.4x) 7.4x (2.8x) 5.0x +0.6x nm nm nm nm ULT A eBay RH Overstock Tiffany & Co. Ross TJX 16.6x +0.3x 13.2x +0.8x 11.9x +4.8x 11.9x (0.0x) 11.5x +0.9x 10.4x (0.8x) 10.3x (0.3x) Hero Consensus Queen 8.8x +0.6x 8.7x +1.1x Wal-Mart GNC Et han Allen Foot Locker Target Williams-Sonoma Dick's Nord strom Best Buy Fossil Pier 1 Imports Macy's Bed, Ba th & Beyond Kohl's Dillard's 8.3x +0.5x 8.1x +1.9x 7.7x +0.2x 7.3x +0.4x 6.6x +0.1x 6.4x +0.2x 5.7x (1.2x) 5.5x (0.4x) 5.5x +0.3x 5.3x (1.9x) 4.7x (1.1x) 4.6x (1.3x) 4.6x (0.4x) 4.6x (0.4x) 3.4x (1.2x)
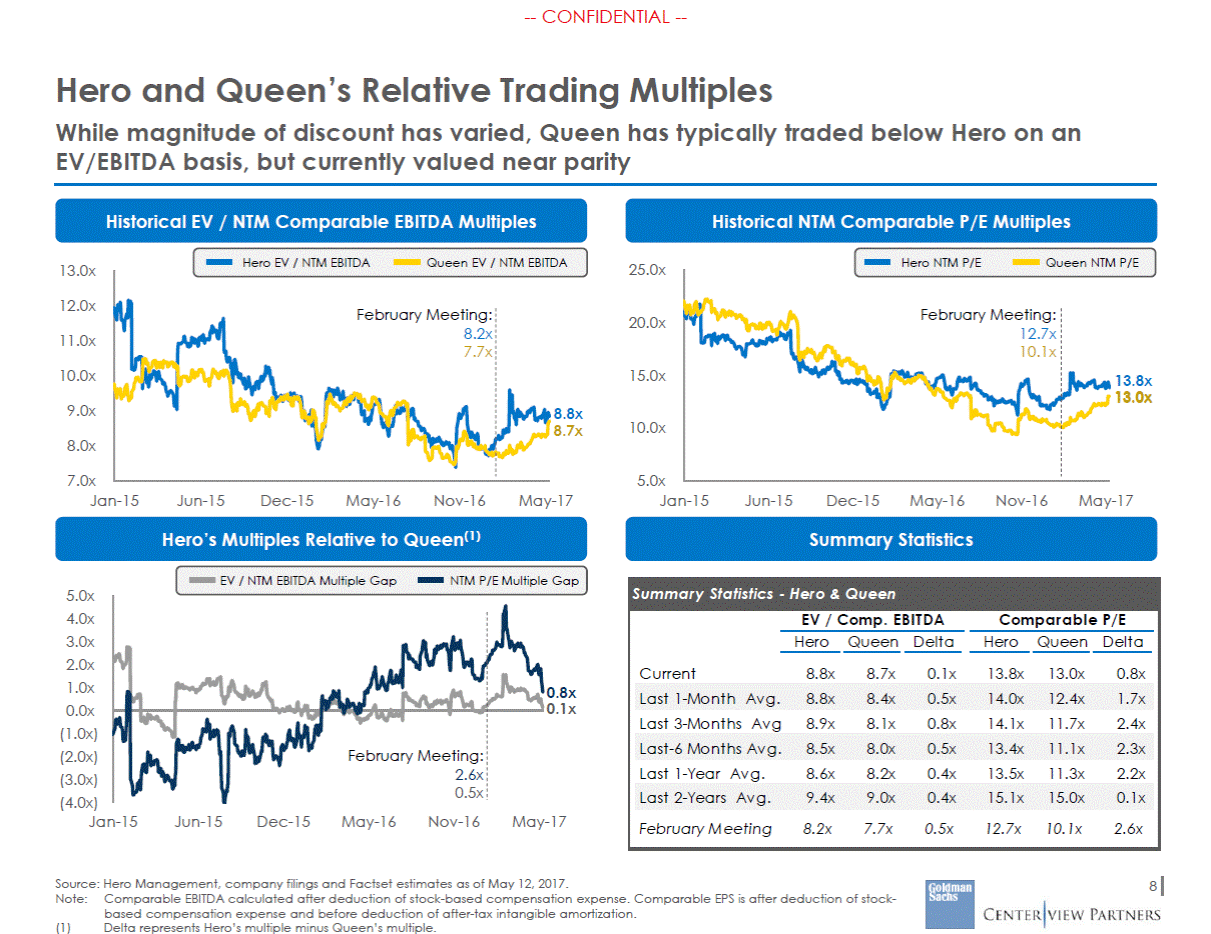
--CONFIDENTIAL --Hero and Queen’s Relative Trading Multiples While magnitude of discount has varied, Queen has typically traded below Hero on an EV/EBITDA basis, but currently valued near parity Historical EV / NTM Comparable EBITDA Multiples Historical NTM Comparable P/E Multiples Hero EV / NTM EBITDA Queen EV / NTM EBITDA Hero NTM P/E Queen NTM P/E 13.0x 25.0x 12.0x 20.0x 11.0x 10.0x 15.0x 13.8x 13.0x 9.0x 8.8x 8.7x 10.0x 8.0x 7.0x 5.0x Jan-15 Jun-15 Dec-15 May-16 Nov-16 May-17 Jan-15 Jun-15 Dec-15 May-16 Nov-16 May-17 Hero’s Multiples Relative to Queen(1) Summary Statistics EV / NTM EBITDA Multiple Gap NTM P/E Multiple Gap 5.0x 4.0x 3.0x 2.0x 1.0x 0.0x (1.0x) (2.0x) (3.0x) (4.0x) 0.8x 0.1x Jan-15 Jun-15 Dec-15 May-16 Nov-16 May-17 Source: Hero Management, company filings and Factset estimates as of May 12, 2017. Note:Comparable EBITDA calculated after deduction of stock-based compensation expense. Comparable EPS is after deduction of stock-based compensation expense and before deduction of after-tax intangible amortization. 8 (1) Delta represents Hero’s multiple minus Queen’s multiple. February Meeting: 2.6x 0.5x Summary Statistics - Hero & Queen EV / Comp. EBITDA Comparable P/E Hero Queen Delta Hero Queen Delta Current 8.8x 8.7x 0.1x 13.8x 13.0x 0.8x Last 3-Months Avg 8.9x 8.1x 0.8x 14.1x 11.7x 2.4x Last 1-Year Avg. 8.6x 8.2x 0.4x 13.5x 11.3x 2.2x February M eeting 8.2x 7.7x 0.5x 12.7x 10.1x 2.6x Last 2-Years Avg. 9.4x 9.0x 0.4x 15.1x 15.0x 0.1x Last-6 Months Avg. 8.5x 8.0x 0.5x 13.4x 11.1x 2.3x Last 1-Month Avg. 8.8x 8.4x 0.5x 14.0x 12.4x 1.7x February Meeting: 12.7x 10.1x February Meeting: 8.2x 7.7x
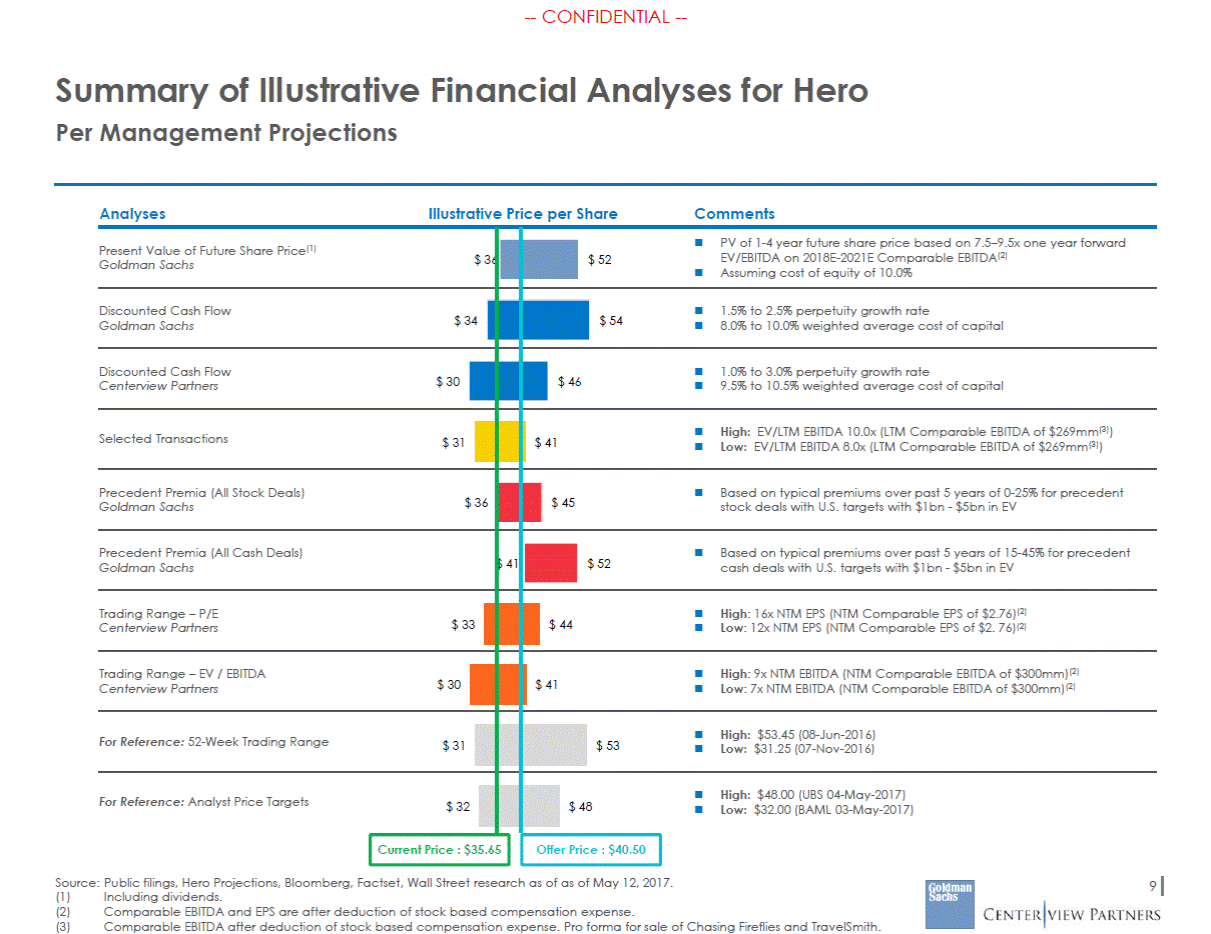
--CONFIDENTIAL --Summary of Illustrative Financial Analyses for Hero Per Management Projections Analyses Illustrative Price per Share Comments EV/EBITDA on 2018E-2021E Comparable EBITDA(2) $ 52 $ 54 8.0% to 10.0% weighted average cost of capital $ 46 9.5% to 10.5% weighted average cost of capital $ 45 stock deals with U.S. targets with $1bn - $5bn in EV $ 52 cash deals with U.S. targets with $1bn - $5bn in EV $ 44 Low: 12x NTM EPS (NTM Comparable EPS of $2. 76)(2) $ 41 Low: 7x NTM EBITDA (NTM Comparable EBITDA of $300mm)(2) $ 53 Low: $31.25 (07-Nov-2016) $ 48 Low: $32.00 (BAML 03-May-2017) Current Price : $35.65 Offer Price : $40.50 Source: Public filings, Hero Projections, Bloomberg, Factset, Wall Street research as of as of May 12, 2017. 9 (1) (2) (3) Including dividends. Comparable EBITDA and EPS are after deduction of stock based compensation expense. Comparable EBITDA after deduction of stock based compensation expense. Pro forma for sale of Chasing Fireflies and TravelSmith. Present Value of Future Share Price(1) Goldman Sachs$ 36 PV of 1-4 year future share price based on 7.5–9.5x one year forward Assuming cost of equity of 10.0% Discounted Cash Flow Goldman Sachs$ 34 1.5% to 2.5% perpetuity growth rate Discounted Cash Flow Centerview Partners$ 30 1.0% to 3.0% perpetuity growth rate High: EV/LTM EBITDA 10.0x (LTM Comparable EBITDA of $269mm(3)) $ 41 Low: EV/LTM EBITDA 8.0x (LTM Comparable EBITDA of $269mm(3)) Selected Transactions$ 31 Precedent Premia (All Stock Deals) Goldman Sachs$ 36 Based on typical premiums over past 5 years of 0-25% for precedent Precedent Premia (All Cash Deals) Goldman Sachs $ 41 Based on typical premiums over past 5 years of 15-45% for precedent Trading Range – P/E Centerview Partners$ 33 High: 16x NTM EPS (NTM Comparable EPS of $2.76)(2) Trading Range – EV / EBITDA Centerview Partners$ 30 High: 9x NTM EBITDA (NTM Comparable EBITDA of $300mm)(2) For Reference: 52-Week Trading Range$ 31 High: $53.45 (08-Jun-2016) For Reference: Analyst Price Targets$ 32 High: $48.00 (UBS 04-May-2017)
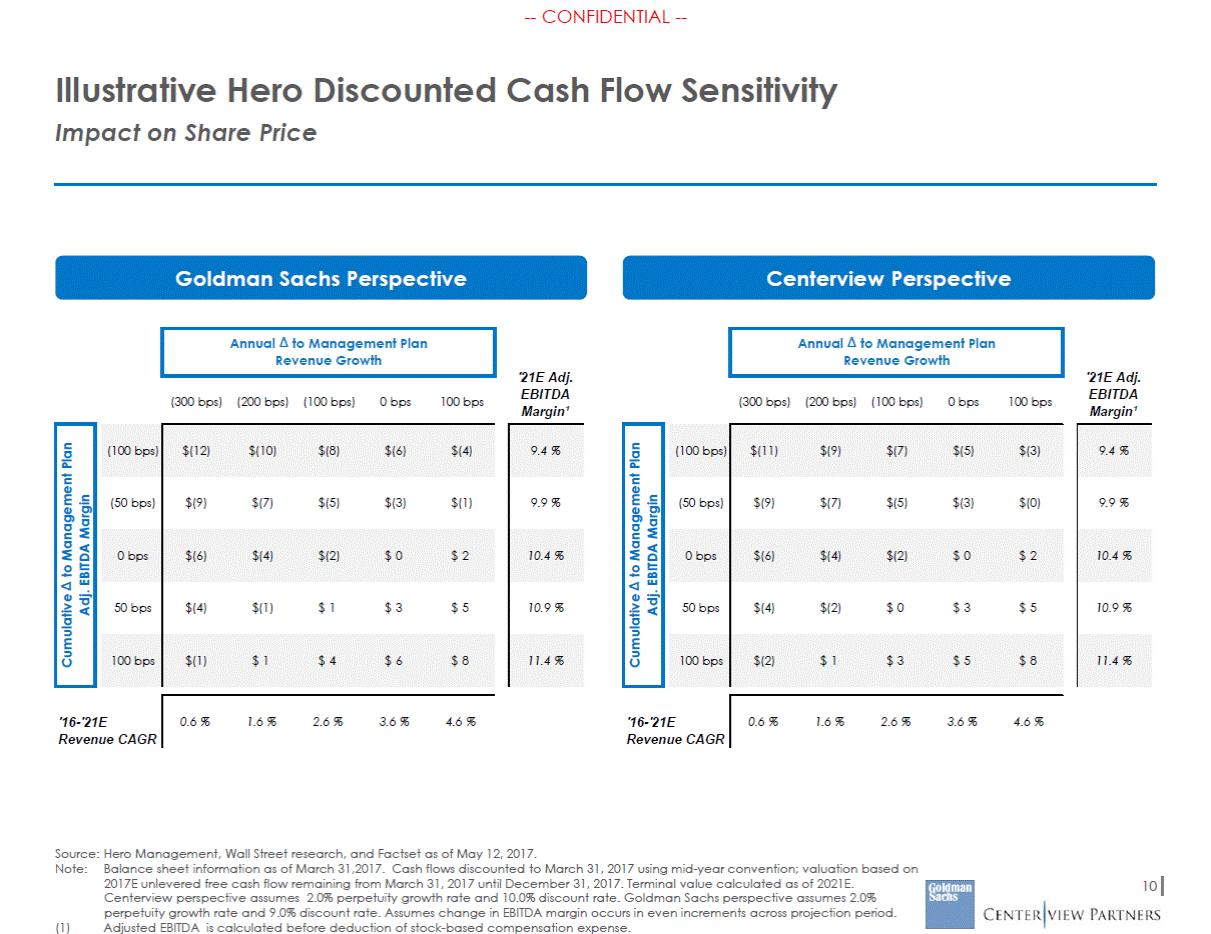
--CONFIDENTIAL --Illustrative Hero Discounted Impact on Share Price Cash Flow Sensitivity Goldman Sachs Perspective Centerview Perspective '21E Adj. EBITDA Margin¹ '21E Adj. EBITDA Margin¹ (300 bps) (200 bps) (100 bps) 0 bps 100 bps (300 bps) (200 bps) (100 bps) 0 bps 100 bps '16-'21E Revenue CAGR '16-'21E Revenue CAGR Source: Hero Management, Wall Street research, and Factset as of May 12, 2017. Note:Balance sheet information as of March 31,2017. Cash flows discounted to March 31, 2017 using mid-year convention; valuation based on 2017E unlevered free cash flow remaining from March 31, 2017 until December 31, 2017. Terminal value calculated as of 2021E. Centerview perspective assumes 2.0% perpetuity growth rate and 10.0% discount rate. Goldman Sachs perspective assumes 2.0% perpetuity growth rate and 9.0% discount rate. Assumes change in EBITDA margin occurs in even increments across projection period. 10 (1) Adjusted EBITDA is calculated before deduction of stock-based compensation expense. 0.6 %1.6 %2.6 %3.6 %4.6 % 0.6 %1.6 %2.6 %3.6 %4.6 % 9.4 % 9.9 % 10.4 % 10.9 % 11.4 % Cumulative to Management Plan Adj. EBITDA Margin (100 bps) $(11) $(9) $(7) $(5) $(3) (50 bps) $(9) $(7) $(5) $(3) $(0) 0 bps $(6) $(4) $(2) $ 0 $ 2 50 bps $(4) $(2) $ 0 $ 3 $ 5 100 bps $(2) $ 1 $ 3 $ 5 $ 8 9.4 % 9.9 % 10.4 % 10.9 % 11.4 % Cumulative to Management Plan Adj. EBITDA Margin (100 bps) $(12) $(10) $(8) $(6) $(4) (50 bps) $(9) $(7) $(5) $(3) $(1) 0 bps $(6) $(4) $(2) $ 0 $ 2 50 bps $(4) $(1) $ 1 $ 3 $ 5 100 bps $(1) $ 1 $ 4 $ 6 $ 8 Annual to Management Plan Revenue Growth Annual to Management Plan Revenue Growth
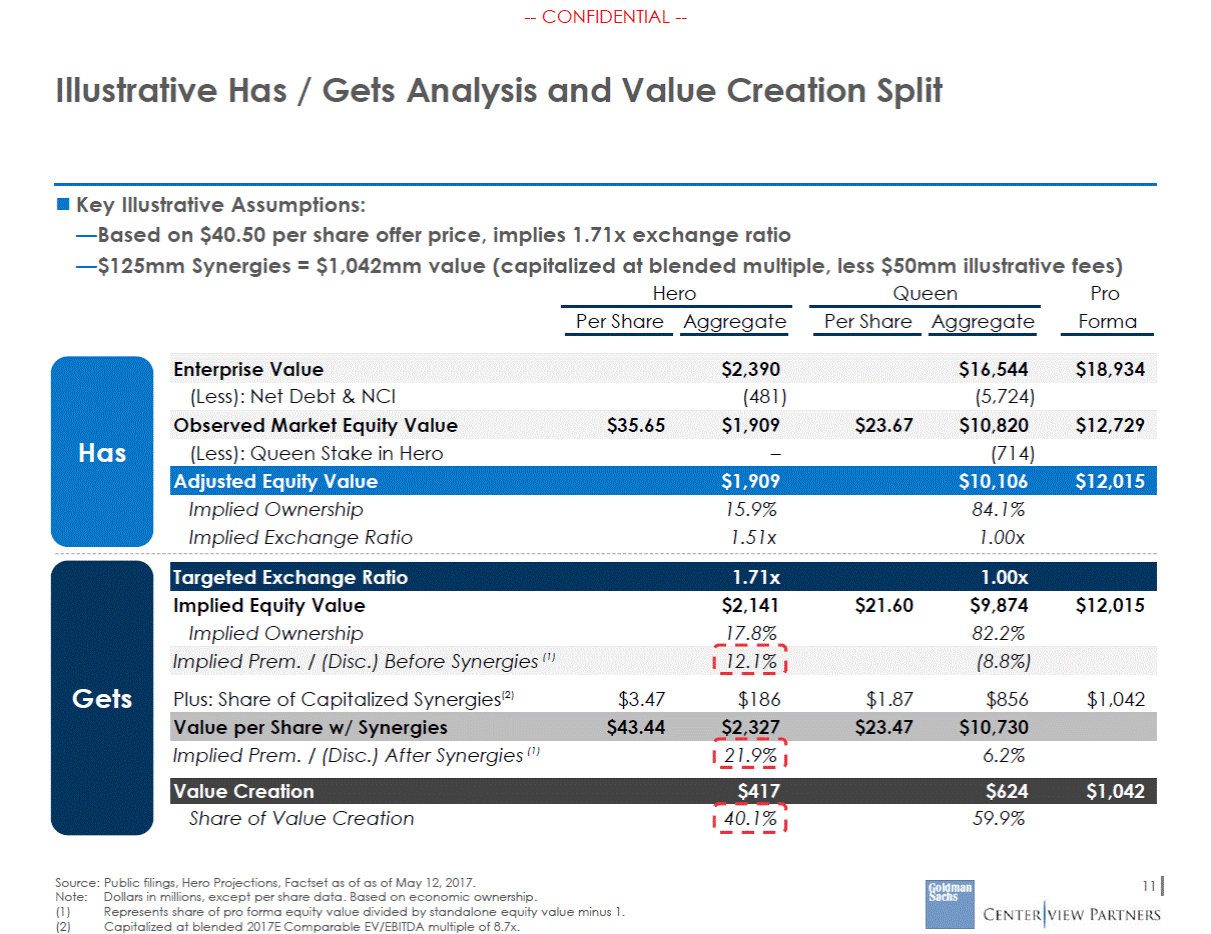
--CONFIDENTIAL --Illustrative Has / Gets Analysis and Value Creation Split Key Illustrative Assumptions: —Based on $40.50 per share offer price, implies 1.71x exchange ratio —$125mm Synergies = $1,042mm value (capitalized at blended multiple, less $50mm illustrative fees) Hero Queen Pro Forma Per Share Aggregate Per Share Aggregate (Less): Net Debt & NCI (481) (5,724) Has (Less): Queen Stake in Hero – (714) Implied Ownership Implied Exchange Ratio 15.9% 1.51x 84.1% 1.00x Implied Equity Value Implied Ownership $2,141 17.8% $21.60 $9,874 82.2% $12,015 Gets Plus: Share of Capitalized Synergies(2) $3.47 $186 $1.87 $856 $1,042 Implied Prem. / (Disc.) After Synergies (1) 21.9% 6.2% Share of Value Creation 40.1% 59.9% Source: Public filings, Hero Projections, Factset as of as of May 12, 2017. 11 Note: (1) (2) Dollars in millions, except per share data. Based on economic ownership. Represents share of pro forma equity value divided by standalone equity value minus 1. Capitalized at blended 2017E Comparable EV/EBITDA multiple of 8.7x. Value Creation $417 $624 $1,042 Value per Share w/ Synergies $43.44 $2,327 $23.47 $10,730 Implied Prem. / (Disc.) Before Synergies (1) 12.1% (8.8%) Targeted Exchange Ratio 1.71x 1.00x Adjusted Equity Value $1,909 $10,106 $12,015 Observed Market Equity Value $35.65 $1,909 $23.67 $10,820 $12,729 Enterprise Value $2,390 $16,544 $18,934
--CONFIDENTIAL --Illustrative Has / Gets Analysis and Value Creation Split Sensitivity At various headline premiums and synergy values Assumes Hero/Queen both trading at intrinsic value Hero Shareholders (Including Queen) Share of Value Creation Run-rate Synergies Blended Multiple (1) Net Capitalized Synergies(2) $86 8.7x $700 $100 8.7x $823 $125 8.7x $1,042 $140 8.7x $1,173 $150 8.7x $1,260 Offer Price Headline Premium Implied Ownership Exchange Ratio Hero Pro Forma Share of Value Creation Source: Public filings, Hero Projections, Factset as of as of May 12, 2017. 12 Note: (1) (2) Dollars in millions, except per share data. Capitalized at blended 2017E Comparable EV/EBITDA multiple of 8.7x. Net of $50mm of illustrative transaction fees. $35.65 – 15.9% 1.51x 16% 16% 16% 16% 16% 40.50 13.6% 17.8% 1.71x 51% 46% 40% 38% 36% 41.00 15.0% 18.0% 1.73x 55% 49% 43% 40% 38% 41.89 17.5% 18.4% 1.77x 61% 55% 47% 44% 42% 42.78 20.0% 18.7% 1.81x 67% 60% 51% 48% 46% 43.67 22.5% 19.1% 1.85x 73% 65% 56% 52% 49% 44.56 25.0% 19.4% 1.88x 80% 71% 60% 55% 53%
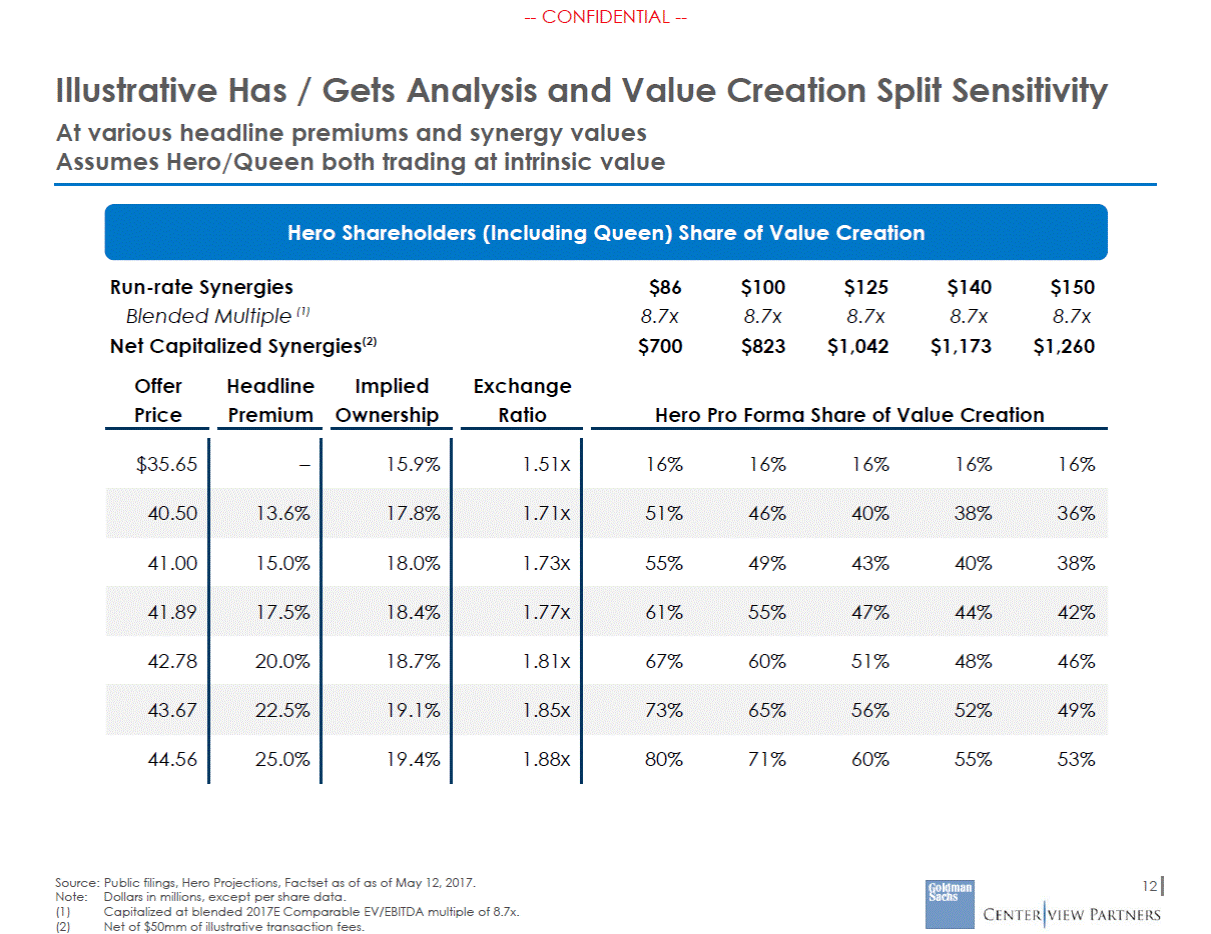
--CONFIDENTIAL --Transaction Parameters at Various Synergy Levels Required for Hero Shareholders to Receive 50% of Synergies Capitalized Value of Exchange to Non-Queen Synergies Price Premium to Hero Source: Hero Management, company filings and market Data as of May 12, 2017. Note:Dollars in millions. Pro forma ownership to all hero shareholders incl. Queen based on Queen diluted share count as of March 31, 2017. 13 (1) Assumes synergies are capitalized at the blended NTM EV/EBITDA multiple of 8.7x, net of $50mm fees. $700mm of net capitalized synergies implies run rate synergies of $94mm if capitalized at Queen’s NTM EV/EBITDA of 8.0x. Run-RateNetHeadlineHeadlinePer ShareImpliedPF Ownership PF Ownership Synergies¹PremiumRatioHero $ 86$ 700 $ 100$ 823 $ 125$ 1,042 $ 140$ 1,173 $ 150$ 1,260 $ 40.3713.2 %$ 4.721.71 x17.8 %11.1 % $ 41.3315.9 %$ 5.681.75 x18.1 %11.4 % $ 42.5219.3 %$ 6.871.80 x18.6 %11.7 % $ 43.4922.0 %$ 7.841.84 x19.0 %11.9 % $ 43.8523.0 %$ 8.201.85 x19.1 %12.0 %
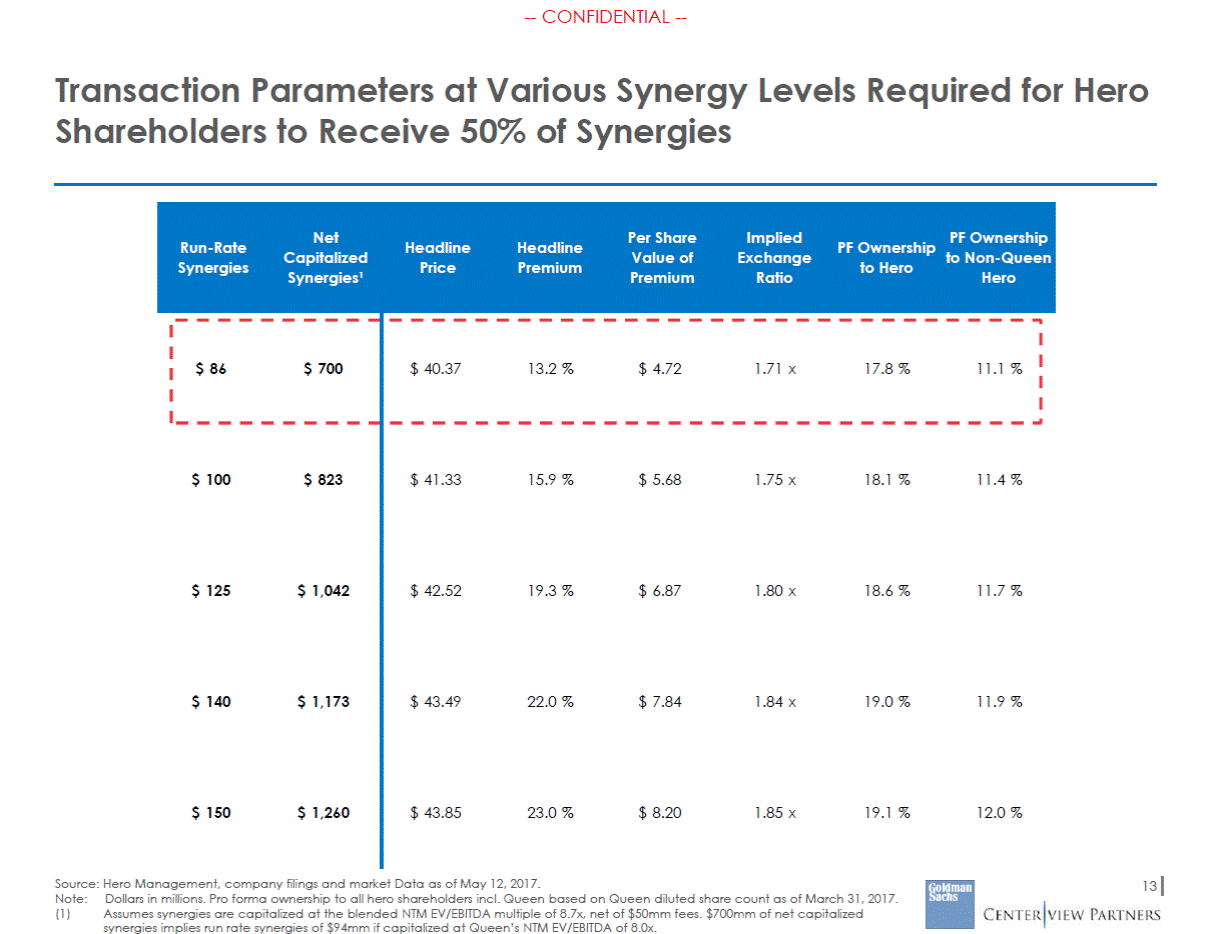
--CONFIDENTIAL --Illustrative Has / Gets Analysis and Value Creation Split Sensitivity At various headline premiums and Hero/Queen intrinsic values Assumes Hero base case synergies of $125mm capitalized at blended multiple of 8.7x Current Proposal – $40.50 15% Premium – $41.00 Queen Val. Prem/(Disc.) to Current Hero Val. Prem/(Disc.) to Current Queen Val. Prem/(Disc.) to Current Hero Val. Prem/(Disc.) to Current (5%) (5%) – 5% – 5% 17.5% Premium – $41.89 20.0% Premium – $42.78 Queen Val. Prem/(Disc.) to Current Hero Val. Prem/(Disc.) to Current Queen Val. Prem/(Disc.) to Current Hero Val. Prem/(Disc.) to Current (5%) (5%) – 5% – 5% 14 Source: Public filings, Hero Projections, Factset as of as of May 12, 2017. (5%) 48%40%32% – 59%51%43% 5% 71%62%54% (5%) 44%36%28% – 55%47%39% 5% 66%58%49% (5%) 40%32%24% – 51%43%34% 5% 62%53%45% (5%) 38%30%22% – 48%40%32% 5% 59%50%42%
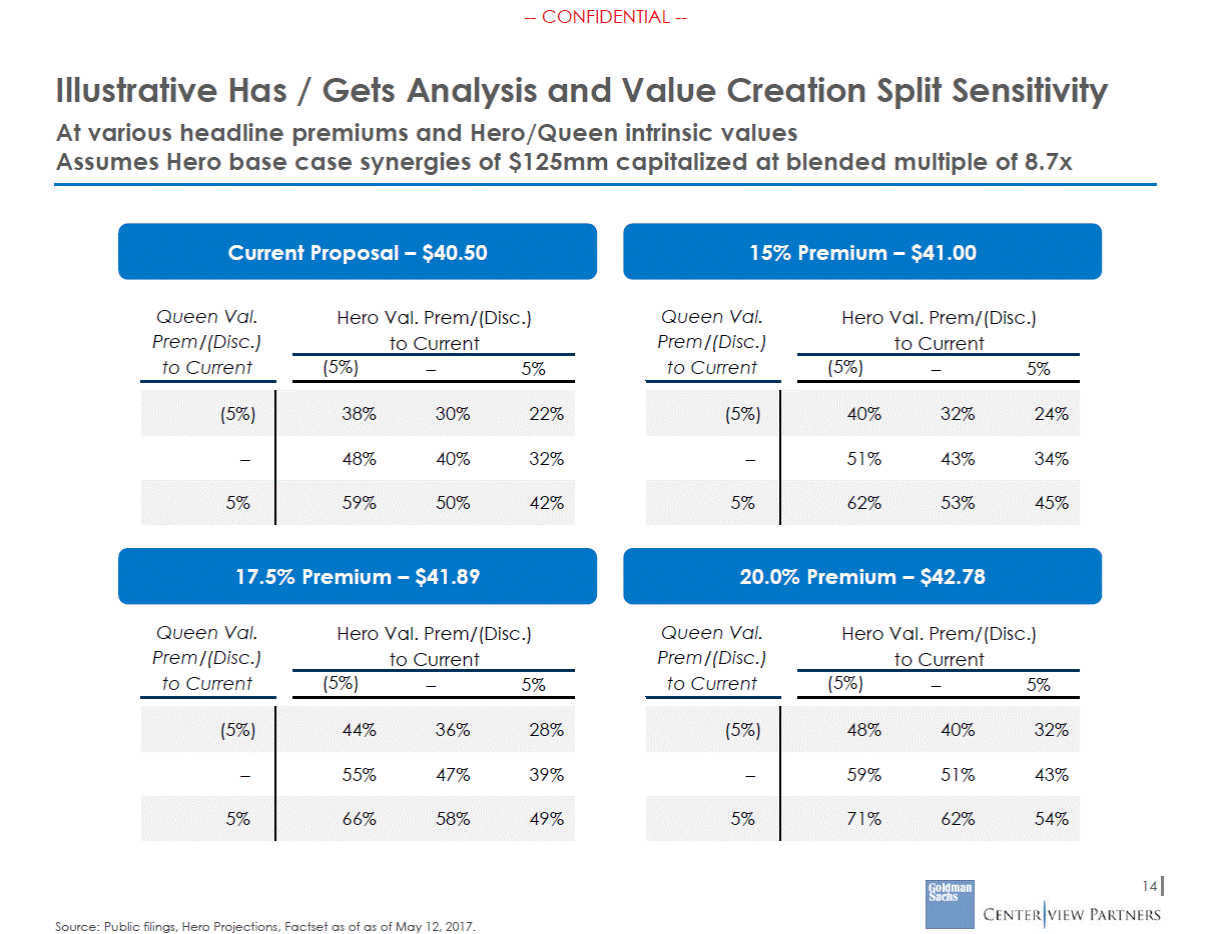
--CONFIDENTIAL --Structural Transaction Alternatives Given Queen’s Announced Tracking Stock to Asset Stock Conversion components of the merger agreement Queen’s stock price is below a certain price threshold at the measurement date 15 Tracking Stock Deal With No Deal Protections Hero to enter into a transaction before the Queen split-off is complete with no guarantee regarding future legal separation of Queen and Ventures Hero shareholders would receive Queen tracking stock in the merger; tracking stock would subsequently become an asset-based stock assuming successful completion of the Ventures split-off Some risk that Hero shareholders would continue to own tracking stock indefinitely if the Ventures split-off is not completed; also implies that Hero would have no influence on details of the Ventures split-off and asset/liability reattribution between Queen and Ventures Closing Conditioned on Split-Off Alternatively, closing of merger between Hero and Queen could be conditioned on successful completion of the Ventures split-off such that Hero shareholders would never receive tracking stock Provisions protecting Hero, such as a break-up fee and detailed terms of the Venture split-off, could be important May significantly delay closing of Hero transaction Given Hero’s shareholders will only receive minority stake in pro forma Queen and long lead time to close Ventures split-off relative to Hero, it is unlikely that Queen would agree to this closing condition Contingent Incremental Consideration Hero to receive contingent incremental consideration per share, either in the form of cash or stock, under certain circumstances. Two potential situations where contingent consideration could be used: — If Ventures split-off transaction is terminated or does not close by a certain date — If Queen stock (tracking or asset-based) trades below a certain price threshold at a future date (e.g., 12 months post-closing) Hero could propose a stock-settled CVR where Hero shareholders receive additional Queen shares (or cash) if — This would be used in response to Greg Maffei’s assertion that Queen’s stock price has further upside once it becomes asset-based stock Contingent securities such as CVRs are complex to negotiate and discounted by the market, and might represent more of a negotiating tactic rather than a final deal term
--CONFIDENTIAL --Next Steps Advisors to call Lion CEO as soon as possible to convey Committee’s response Message to include: —Proposal is inadequate and not a basis for discussion —Synergy opportunity is greater than $750mm and Hero expects to be compensated accordingly —Hero shareholders require a fixed exchange ratio framework rather than fixed price —Hero shareholders must be compensated for uncertainty related to GCI-Lion transaction —Committee requires clarity on value implications of asset/liability reattribution associated with GCI-Lion transaction Formulate a Response to Lion Refinements/updates to management plan, if appropriate, in light of recent trends and performance against key strategic initiatives Updated thorough analysis of the potential synergy opportunity in a combination, including incorporating input from Queen management, if/when made available —Include revenue synergies and capex synergies Updated strategic, financial and operational benefits of a potential combination with Queen as new information becomes available —Update pro forma financial profile and future share price analysis Likelihood and timing of GCI-Lion transaction closing (based on current trading levels) Potential value differential from receiving tracking stock vs. asset-based stock Capital structure and cash flow implications of Lion Interactive exchangeable debentures Additional Areas for Diligence 16
Appendix
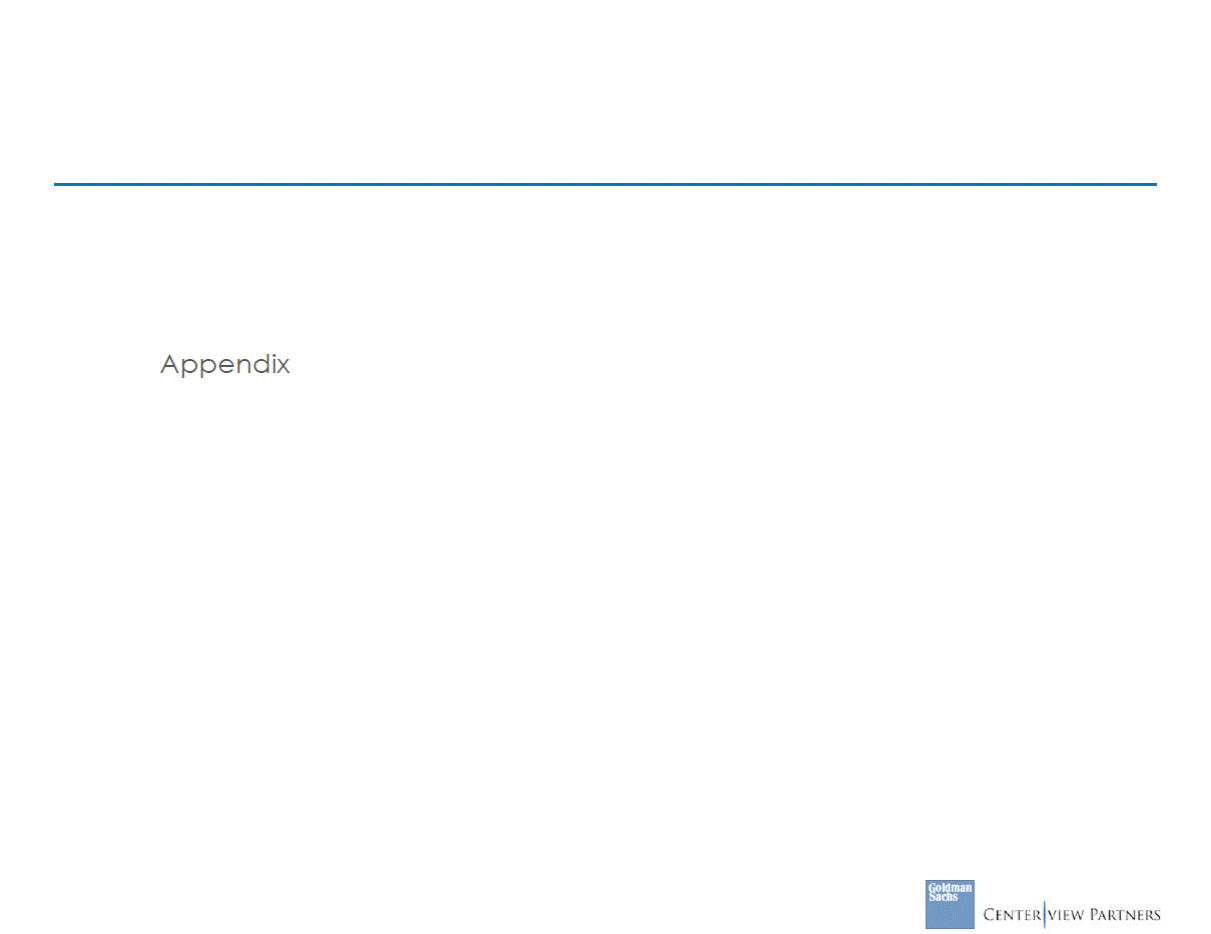
--CONFIDENTIAL --Illustrative Last 2 Years Exchange Ratio Over Time 3.10 x hip 2.90 x 2.70 x 2.50 x 2.30 x 2.10 x 1.90 x Current Offer: 1.71x 1.70 x 1.51 x 1.50 x May-2015 Aug-2015 Nov-2015 Feb-2016 May-2016 Aug-2016 Nov-2016 Feb-2017 May-2017 18 Source: Company filings, Bloomberg as of May 12, 2017. (1) (2) Exchange ratio defined as Queen series A shares per Hero shares. Based on April 30, 2017 Queen number of series A and B shares outstanding. Exchange Ratio Analysis Share Price Exchange Implied Premium Implied Hero Owners Queen Hero Ratio¹ to Current Price (non-Queen)² Current $ 23.67 $ 35.65 1.51 x 0 % 10 % 1 Month Avg. 21.65 36.33 1.68 x 12 % 10 % 3 Month Avg. 20.37 36.79 1.81 x 20 % 11 % 6 Month Avg. 20.19 36.35 1.80 x 20 % 11 % 1 Year Avg. 21.45 40.68 1.90 x 26 % 12 % 2 Year Avg. 24.20 49.21 2.02 x 34 % 12 % Favorable for Hero 2Y Average = 2.02 x 1Y Average = 1.90 x Favorable for Queen
--CONFIDENTIAL --Overview of Hero Standalone Plan Projections reflect a return to historical levels of growth and margin improvements driven by in-process initiatives Projections imply a return to historical levels of growth (prior to challenging 2016) —Top-line initiatives include improvements to TV distribution and viewer experience (e.g., one-click remote-buying), product pricing and expanding digital capabilities, etc. A number of in-process initiatives expected to drive margins above historical levels —Initiatives include supply chain efficiencies (tailwind from resolution of Piney Flats issues and automation), merchandising initiatives, etc. The Projections reflect a number of positive developments in December and January: —Resolution of Piney Flats issues; increased confidence in ability to drive margin improvement led by new Chief Merchandising Officer; clarified view of trends in business mix —Broker estimates do not reflect these developments and as a result lag the Projections —Resulted in stronger outlook for 2017 relative to Plan shared with Board in December Relative to Queen, Hero top-line growth is in-line but EBITDA growth and margin expansion are higher due to a low 2016 EBITDA base and the initiatives discussed above 19
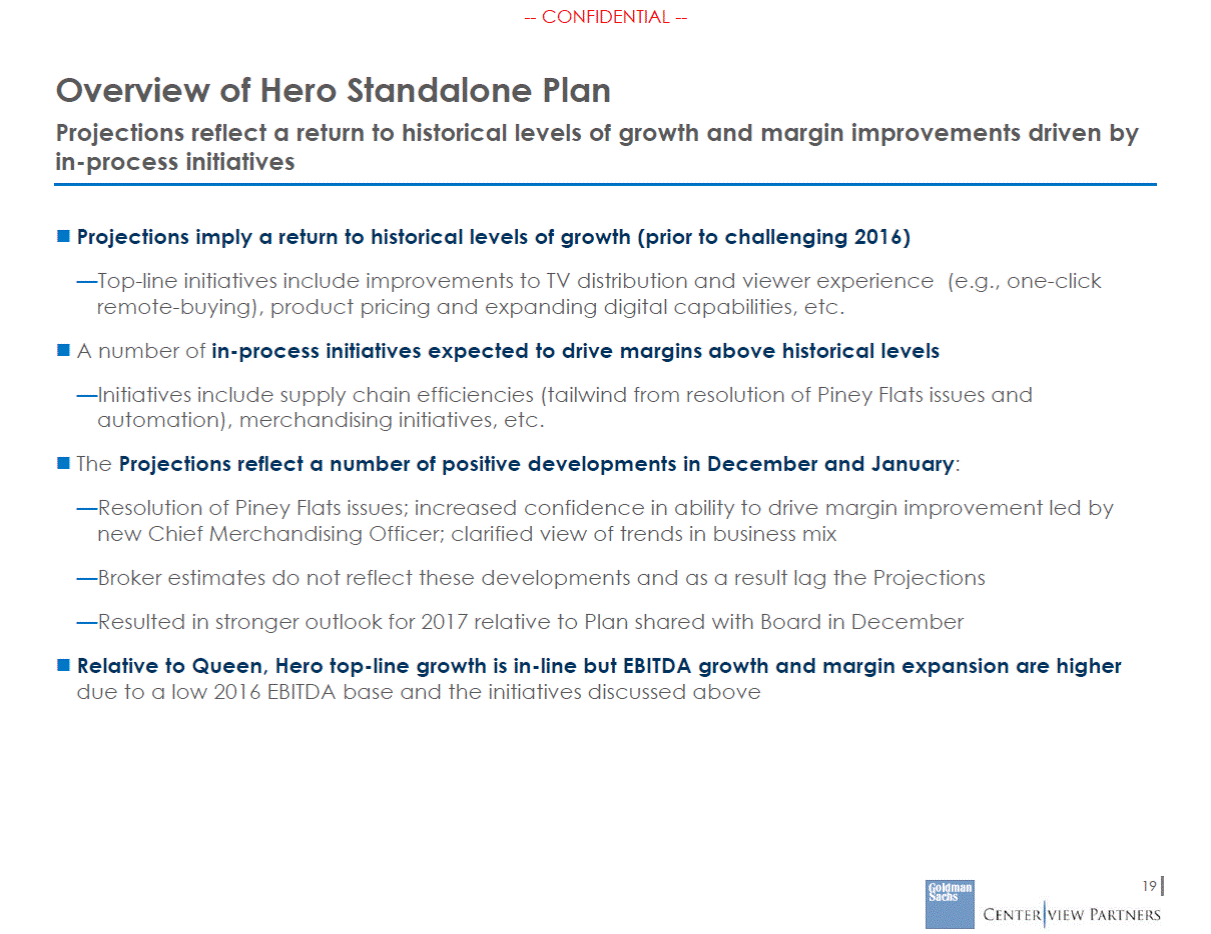
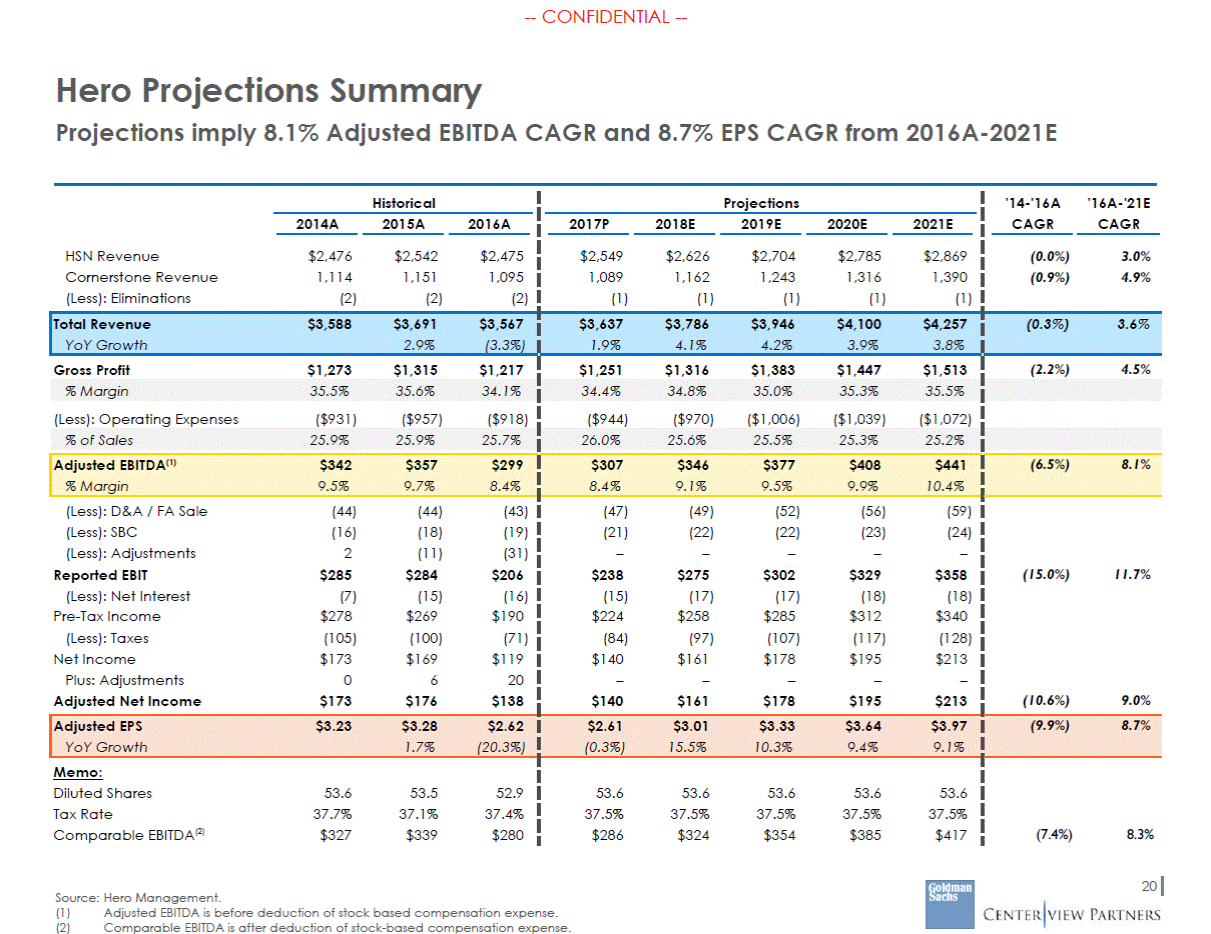
CONFIDENTIAL --Hero Projections Summary Projections imply 8.1% Adjusted EBITDA CAGR and 8.7% EPS CAGR from 2016A-2021E 20 Source: Hero Management. (1) (2) Adjusted EBITDA is before deduction of stock based compensation expense. Comparable EBITDA is after deduction of stock-based compensation expense. Historical 2014A2015A2016A HSN Revenue$2,476$2,542$2,475 Cornerstone Revenue1,1141,1511,095 (Less): Eliminations(2)(2)(2) Projections 2017P2018E2019E2020E2021E $2,549$2,626$2,704$2,785$2,869 1,0891,1621,2431,3161,390 (1)(1)(1)(1)(1) '14-'16A'16A-'21E CAGRCAGR (0.0%)3.0% (0.9%)4.9% Total Revenue$3,588$3,691$3,567 YoY Growth2.9%(3.3%) $3,637$3,786$3,946$4,100$4,257 1.9%4.1%4.2%3.9%3.8% (0.3%)3.6% Gross Profit$1,273$1,315$1,217 $1,251$1,316$1,383$1,447$1,513 (2.2%)4.5% % Margin35.5%35.6%34.1% 34.4%34.8%35.0%35.3%35.5% (Less): Operating Expenses($931)($957)($918) ($944)($970)($1,006)($1,039)($1,072) % of Sales25.9%25.9%25.7% 26.0%25.6%25.5%25.3%25.2% Adjusted EBITDA(1)$342$357$299 % Margin9.5%9.7%8.4% $307$346$377$408$441 8.4%9.1%9.5%9.9%10.4% (6.5%)8.1% (Less): D&A / FA Sale (44) (44) (43) (Less): SBC (16) (18) (19) (Less): Adjustments 2 (11) (31) Reported EBIT$285$284$206 (Less): Net Interest(7) (15)(16) Pre-Tax Income$278$269$190 (Less): Taxes (105) (100)(71) Net Income$173$169$119 Plus: Adjustments 0 6 20 Adjusted Net Income$173$176$138 (47)(49)(52)(56)(59) (21)(22)(22)(23)(24) ––––– $238$275$302$329$358 (15)(17)(17)(18)(18) $224$258$285$312$340 (84) (97) (107) (117)(128) $140$161$178$195$213 ––––– $140$161$178$195$213 (15.0%)11.7% (10.6%)9.0% Adjusted EPS$3.23$3.28$2.62 YoY Growth1.7%(20.3%) $2.61$3.01$3.33$3.64$3.97 (0.3%)15.5%10.3%9.4%9.1% (9.9%)8.7% Memo: Diluted Shares53.653.552.9 Tax Rate37.7%37.1%37.4% Comparable EBITDA(2) $327$339 $280 53.653.653.653.653.6 37.5%37.5%37.5%37.5%37.5% $286$324$354$385$417 (7.4%)8.3%
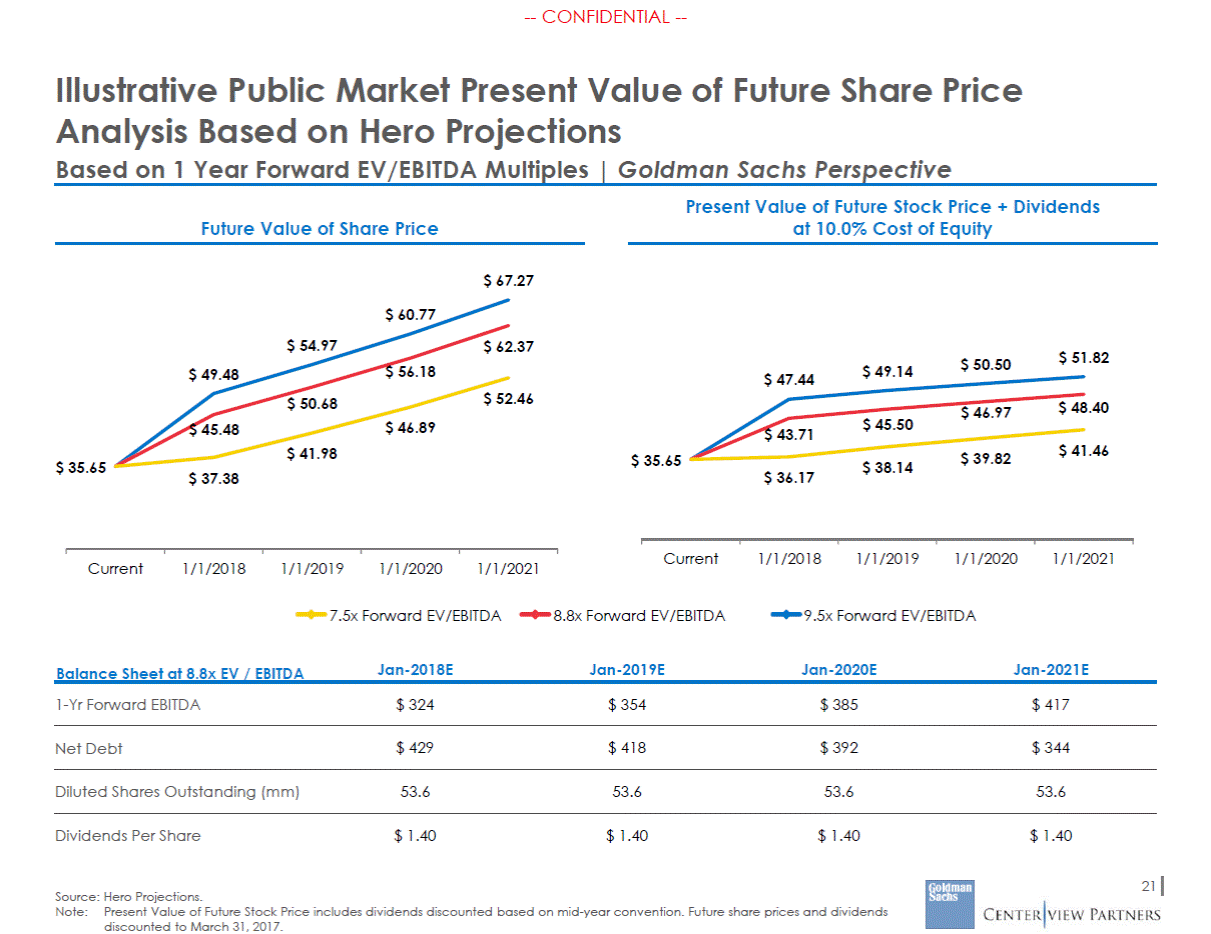
--CONFIDENTIAL --Illustrative Public Market Present Value of Future Share Price Analysis Based on Hero Projections Based on 1 Year Forward EV/EBITDA Multiples | Goldman Sachs Perspective Present Value of Future Stock Price + Dividends at 10.0% Cost of Equity Future Value of Share Price $ 67.27 $ 60.77 $ 54.97 $ 62.37 $ 51.82 $ 50.50 $ 49.14 $ 56.18 $ 49.48 $ 47.44 $ 52.46 $ 50.68 $ 48.40 $ 46.97 $ 45.50 $ 45.48 $ 46.89 $ 43.71 $ 41.46 $ 41.98 $ 39.82 $ 35.65 $ 35.65 $ 38.14 $ 37.38 $ 36.17 Current 1/1/2018 1/1/2019 1/1/2020 1/1/2021 Current 1/1/2018 1/1/2019 1/1/2020 1/1/2021 7.5x Forward EV/EBITDA 8.8x Forward EV/EBITDA 9.5x Forward EV/EBITDA Balance Sheet at 8.8x EV / EBITDA Jan-2018E Jan-2019E Jan-2020E Jan-2021E 1-Yr Forward EBITDA $ 324 $ 354 $ 385 $ 417 Net Debt $ 429 $ 418 $ 392 $ 344 Diluted Shares Outstanding (mm) 53.6 53.6 53.6 53.6 $ 1.40 $ 1.40 $ 1.40 $ 1.40 Dividends Per Share 21 Source: Hero Projections. Note:Present Value of Future Stock Price includes dividends discounted based on mid-year convention. Future share prices and dividends discounted to March 31, 2017.
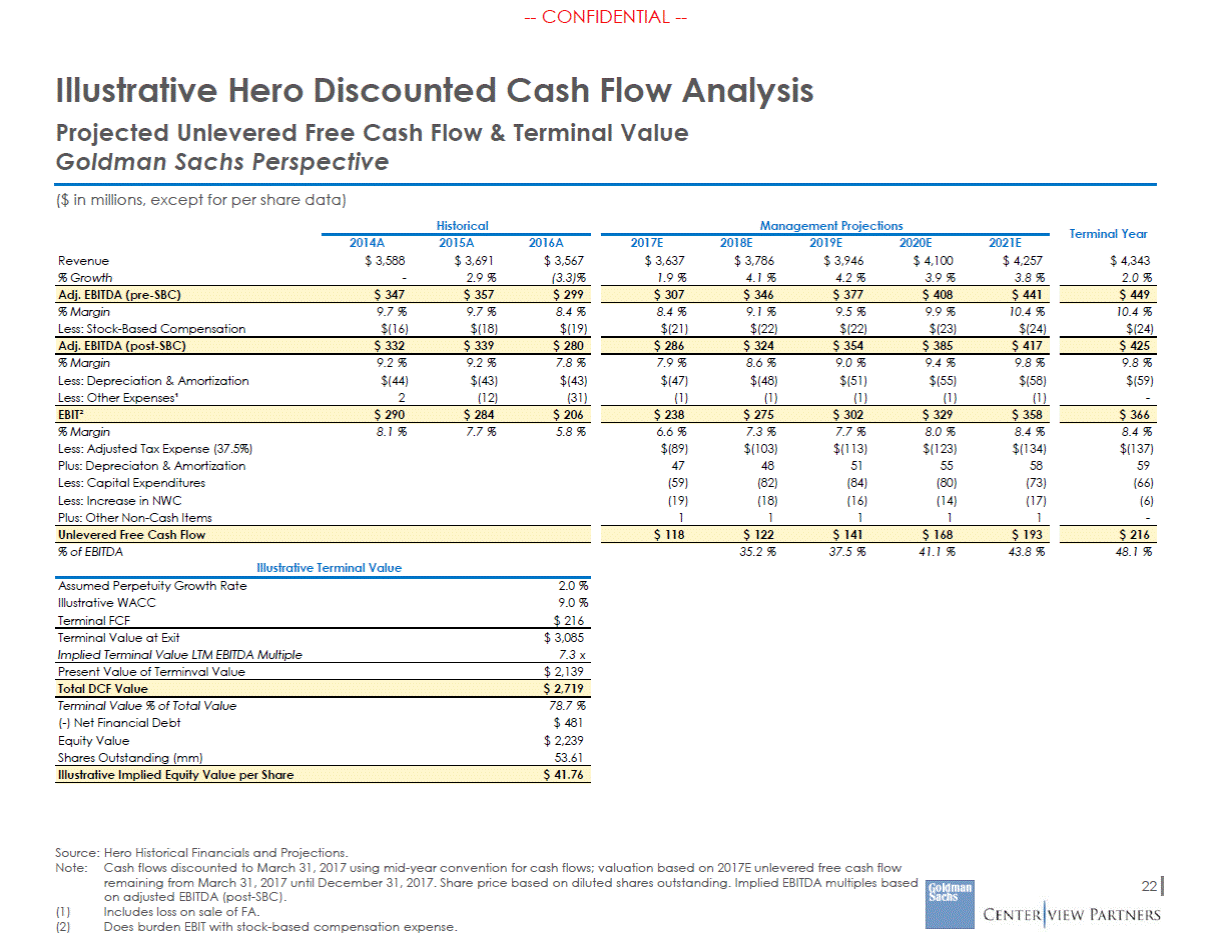
--CONFIDENTIAL --Illustrative Hero Discounted Cash Flow Analysis Projected Unlevered Free Cash Flow & Terminal Value Goldman Sachs Perspective ($ in millions, except for per share data) Historical Management Projections Terminal Year 2014A $ 3,588 - 2015A $ 3,691 2.9 % 2016A $ 3,567 (3.3)% 2017E $ 3,637 1.9 % 2018E $ 3,786 4.1 % 2019E $ 3,946 4.2 % 2020E $ 4,100 3.9 % 2021E $ 4,257 3.8 % Revenue % Growth $ 4,343 2.0 % % Margin Less: Stock-Based Compensation 9.7 % $(16) 9.7 % $(18) 8.4 % $(19) 8.4 % $(21) 9.1 % $(22) 9.5 % $(22) 9.9 % $(23) 10.4 % $(24) 10.4 % $(24) % Margin Less: Depreciation & Amortization Less: Other Expenses¹ 9.2 % $(44) 2 9.2 % $(43) (12) 7.8 % $(43) (31) 7.9 % $(47) (1) 8.6 % $(48) (1) 9.0 % $(51) (1) 9.4 % $(55) (1) 9.8 % $(58) (1) 9.8 % $(59) - % Margin Less: Adjusted Tax Expense (37.5%) Plus: Depreciaton & Amortization Less: Capital Expenditures Less: Increase in NWC Plus: Other Non-Cash Items 8.1 % 7.7 % 5.8 % 6.6 % $(89) 47 (59) (19) 1 7.3 % $(103) 48 (82) (18) 1 7.7 % $(113) 51 (84) (16) 1 8.0 % $(123) 55 (80) (14) 1 8.4 % $(134) 58 (73) (17) 1 8.4 % $(137) 59 (66) (6) - % of EBITDA 35.2 % 37.5 % 41.1 % 43.8 % 48.1 % Illustrative Terminal Value Assumed Perpetuity Growth Rate Illustrative WACC Terminal FCF 2.0 % 9.0 % $ 216 Terminal Value at Exit Implied Terminal Value LTM EBITDA Multiple $ 3,085 7.3 x Present Value of Terminval Value $ 2,139 Terminal Value % of Total Value (-) Net Financial Debt Equity Value Shares Outstanding (mm) 78.7 % $ 481 $ 2,239 53.61 Source: Hero Historical Financials and Projections. Note: Cash flows discounted to March 31, 2017 using mid-year convention for cash flows; valuation based on 2017E unlevered free cash flow remaining from March 31, 2017 until December 31, 2017. Share price based on diluted shares outstanding. Implied EBITDA multiples based on adjusted EBITDA (post-SBC). Includes loss on sale of FA. Does burden EBIT with stock-based compensation expense. 22 (1) (2) Illustrative Implied Equity Value per Share $ 41.76 Total DCF Value $ 2,719 $ 216 $ 118 $ 122 $ 141 $ 168 $ 193 Unlevered Free Cash Flow $ 366 $ 238 $ 275 $ 302 $ 329 $ 358 EBIT² $ 290 $ 284 $ 206 $ 425 $ 286 $ 324 $ 354 $ 385 $ 417 Adj. EBITDA (post-SBC) $ 332 $ 339 $ 280 $ 449 $ 307 $ 346 $ 377 $ 408 $ 441 Adj. EBITDA (pre-SBC) $ 347 $ 357 $ 299
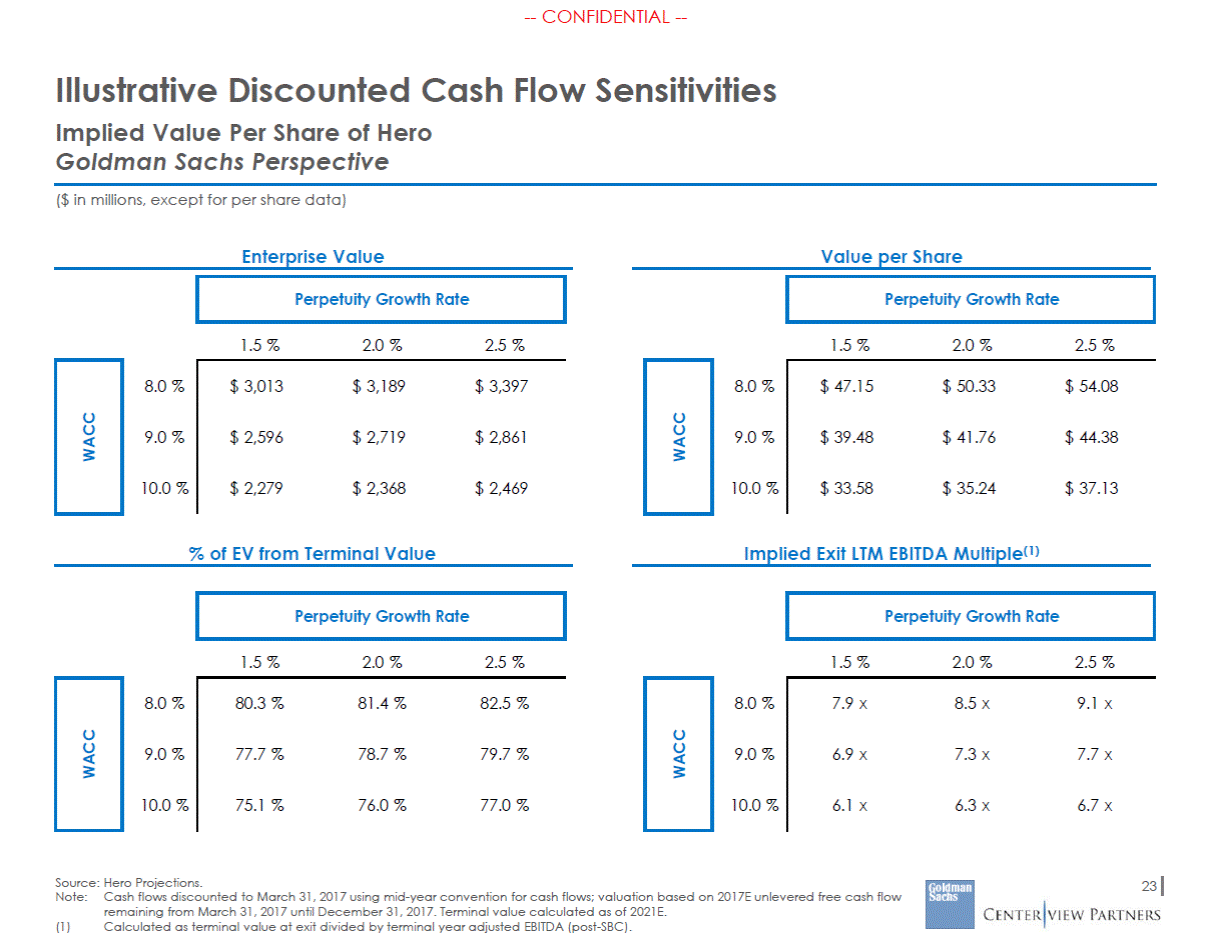
--CONFIDENTIAL --Illustrative Discounted Cash Flow Implied Value Per Share of Hero Goldman Sachs Perspective Sensitivities ($ in millions, except for per share data) Enterprise Value Value per Share 1.5 % 2.0 % 2.5 % 1.5 % 2.0 % 2.5 % 8.0 % 8.0 % 9.0 % 9.0 % 10.0 % 10.0 % Implied Exit LTM EBITDA Multiple(1) % of EV from Terminal Value 1.5 % 2.0 % 2.5 % 1.5 % 2.0 % 2.5 % 8.0 % 8.0 % 9.0 % 9.0 % 10.0 % 10.0 % Source: Hero Projections. Note:Cash flows discounted to March 31, 2017 using mid-year convention for cash flows; valuation based on 2017E unlevered free cash flow remaining from March 31, 2017 until December 31, 2017. Terminal value calculated as of 2021E. 23 (1) Calculated as terminal value at exit divided by terminal year adjusted EBITDA (post-SBC). 7.9 x 8.5 x 9.1 x 6.9 x 7.3 x 7.7 x 6.1 x 6.3 x 6.7 x WACC 80.3 % 81.4 % 82.5 % 77.7 % 78.7 % 79.7 % 75.1 % 76.0 % 77.0 % WACC Perpetuity Growth Rate Perpetuity Growth Rate $ 47.15 $ 50.33 $ 54.08 $ 39.48 $ 41.76 $ 44.38 $ 33.58 $ 35.24 $ 37.13 WACC $ 3,013 $ 3,189 $ 3,397 $ 2,596 $ 2,719 $ 2,861 $ 2,279 $ 2,368 $ 2,469 WACC Perpetuity Growth Rate Perpetuity Growth Rate
--CONFIDENTIAL --Illustrative Hero Discounted Cash Flow Analysis Reflects Hero Management Case Centerview Perspective Hero Standalone Unlevered Free Cash Flows Fiscal Year Ending December 31, 2016A 2017E 2018E 2019E 2020E 2021E Adjusted EBITDA (Less): Stock-Based Compensation Comparable EBITDA(1) (Less): D&A (Less): Loss on Sale of FA Adjusted EBIT (Less): Taxes Plus: D&A (Less): in Net Working Capital (Less): Capital Expenditures Plus: Loss on Sale of FA Unlevered Free Cash Flow YoY Growth $299 (19) $280 (43) (0) $237 $307 (21) $286 (47) (1) $238 (89) 47 (19) (59) 1 $118 $346 (22) $324 (48) (1) $275 (103) 48 (18) (82) 1 $122 3% $377 (22) $354 (51) (1) $302 (113) 51 (16) (84) 1 $141 16% $408 (23) $385 (55) (1) $329 (123) 55 (14) (80) 1 $168 19% $441 (24) $417 (58) (1) $358 (134) 58 (17) (73) 1 $193 15% Enterprise Value ($bn) Perpetuity Growth Rate Implied LTM Exit Multiple Perpetuity Growth Rate Value per Share ($) Perpetuity Growth Rate Discount Rate 1.0% 2.0% 3.0% 1.0% 2.0% 3.0% 1.0% 2.0% 3.0% 9.50% 10.00% 10.50% $2.4 2.2 2.1 $2.6 2.5 2.3 $3.0 2.7 2.6 6.7x 6.4x 6.1x 7.7x 7.3x 6.9x 9.0x 8.4x 7.8x $35.16 32.61 30.34 $39.95 36.81 34.03 $46.17 42.16 38.69 24 Source: Hero Management, Wall Street research, and Factset as of May 12, 2017. Note:Dollars in millions, unless otherwise noted. Assumes mid-year discounting convention. Balance sheet information as of May 12, 2016. (1) Comparable EBITDA is calculated after deduction of stock-based compensation expense .
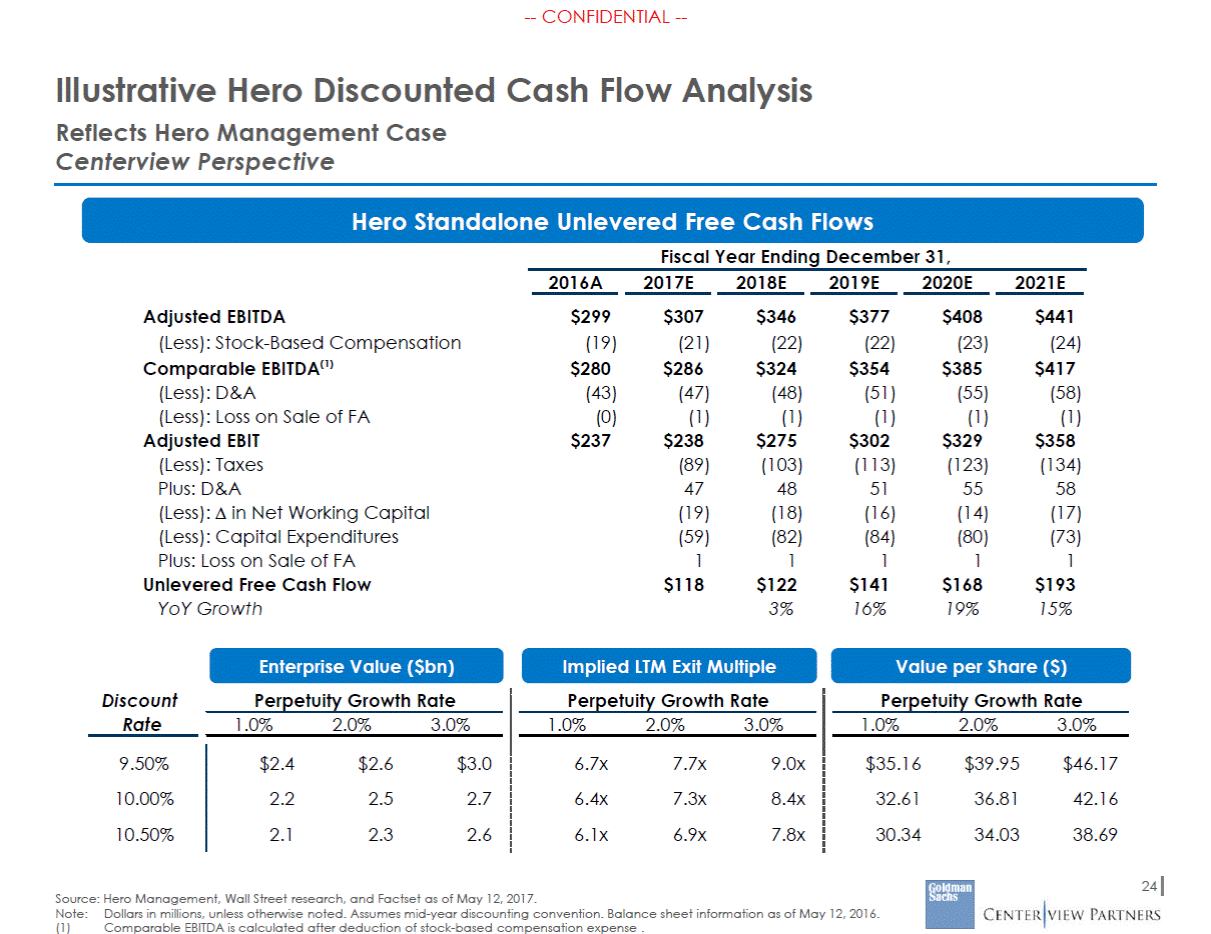
--CONFIDENTIAL --Select Transaction Multiples Specialty Retail Home Stores Department / Mass EV / LTM EBITDA Date Target Acquiror TEV Source: Company filings, Wall Street research. Note: Based on select retail transactions with TEV above $0.5bn since 1/1/2010. Excludes transactions where public information to calculate EV / LTM EBITDA is unavailable: Perry Corp / Barney’s New York, AEA Investors / At Home Group, Avon / Silpada Designs, Bain Capital / Bob’s Discount Furniture, Berkshire Hathaway / Oriental Trading Co., Wal-Mart / Jet.com, Hudson’s Bay / Gilt Groupe, Investor Group / eBay Enterprise , Ahold / Bol.com, Naspers Limited / Markafoni, Amazon.com / Quidsj, Rakuten / Price Minister. 25 25th Percentile7.6x Median9.4x 75th Percentile11.5x Feb-14Zale CorporationSignet Jewelers$1,174 15.6x May-12Cost PlusBed Bath & Beyond682 12.7x Feb-13Office MaxOffice Depot1,789 12.2x Feb-16RonaLowe's2,285 12.1x Oct-16Cabela'sBass Pro Shop5,649 11.8x May-17Kate SpadeCoach2,408 10.4x May-12Charming ShoppesAscena Retail Group830 9.9x Jul-13SaksHudson's Bay2,614 9.8x Sep-13Neiman MarcusCPP / Ares6,000 9.4x Nov-15PetcoCVC, CPP4,600 9.4x Dec-14PetSmartBC Partners; GIC, Others8,722 9.1x Dec-13Nine WestSycamore Partners2,131 8.6x May-15ANN Inc.Ascena Retail Group2,072 8.6x Dec-10Jo-Ann StoresLeonard Green & Partners, L.P1,529 7.3x Nov-12Oriental Trading CoBerkshire Hathaway500 7.1x Nov-12The BrickLeon's Furniture784 7.1x Aug-15BelkSycamore2,867 6.9x Sep-14Bluestem BrandsCapmark Financial Group565 6.3x
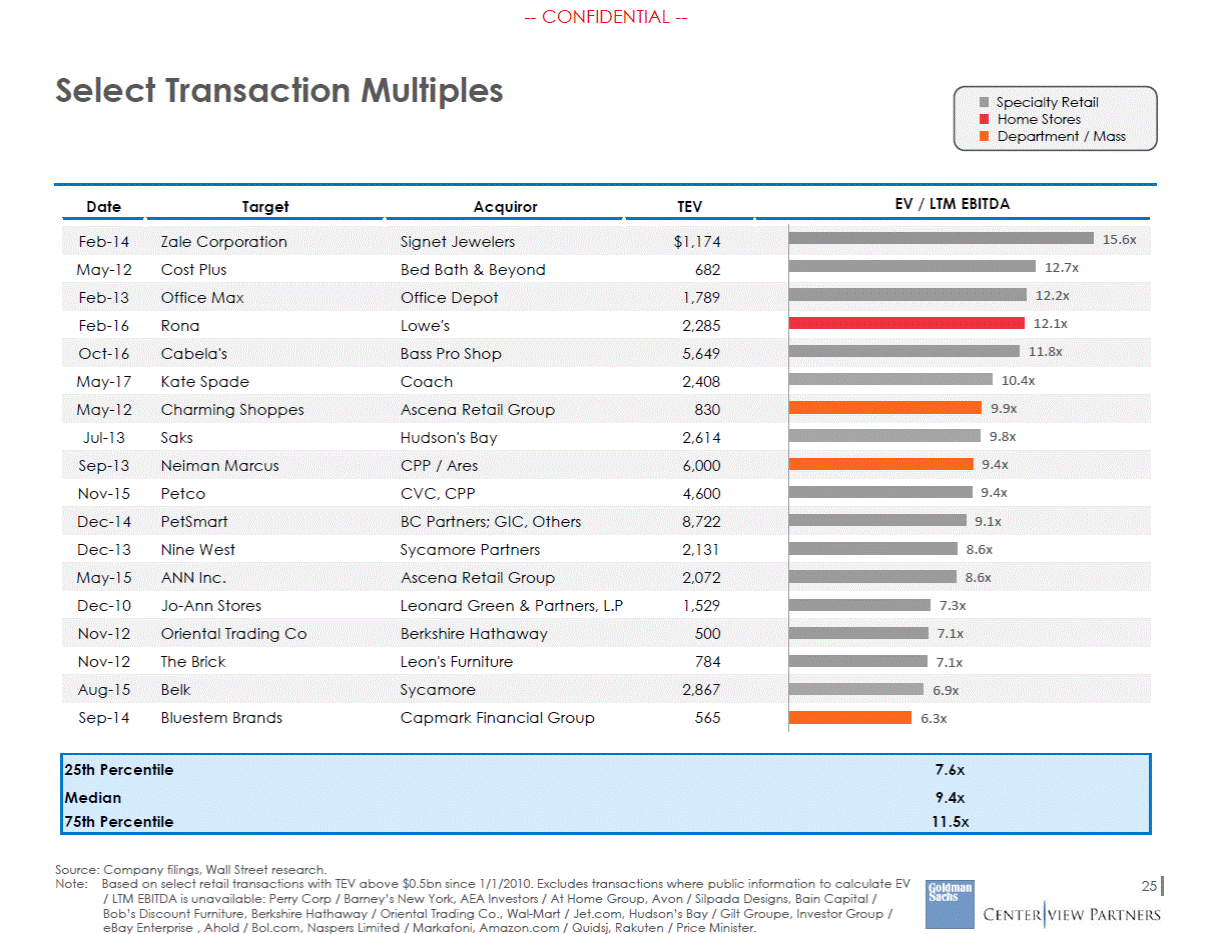
--CONFIDENTIAL --Summary of Illustrative Financial Analyses for Queen Per Street Projections Analyses Illustrative Price per Share Comments $ 32 EV/EBITDA on 2018E-2021E Comparable EBITDA(1) 8.0% to 10.0% weighted average cost of capital 9.0% to 10.0% weighted average cost of capital Low: 7x NTM EBITDA (NTM Comparable EBITDA of $1,905mm)(1) Low: $18.12 (04-Nov-2016) Low: $25.00 (BAML 09-May-2017) Current Price : $23.67 26 Source: Public filings, Wall Street projections supplemented with extrapolated historical financial trends, Bloomberg, Factset as of as of May 12, 2017. (1) Comparable EBITDA is after deduction of stock-based compensation expense. Present Value of Future Share Price$ 17 Goldman Sachs PV of 1-4 year future share price based on 7.0–9.5x one year forward Assuming cost of equity of 11.5% Discounted Cash Flow$ 20 Goldman Sachs $ 34 1.5% to 2.5% perpetuity growth rate Discounted Cash Flow$ 18 Centerview $ 30 1.0% to 3.0% perpetuity growth rate Trading Range – EV / EBITDA$ 17 Centerview $ 25 High: 9x NTM EBITDA (NTM Comparable EBITDA of $1,905mm)(1) For Reference: 52-Week Trading Range$ 18 $ 27 High: $27.08 (27-May-2016) For Reference: Analyst Price Targets$ 25 $ 39 High: $39.00 (Maxim 10-May-2017)
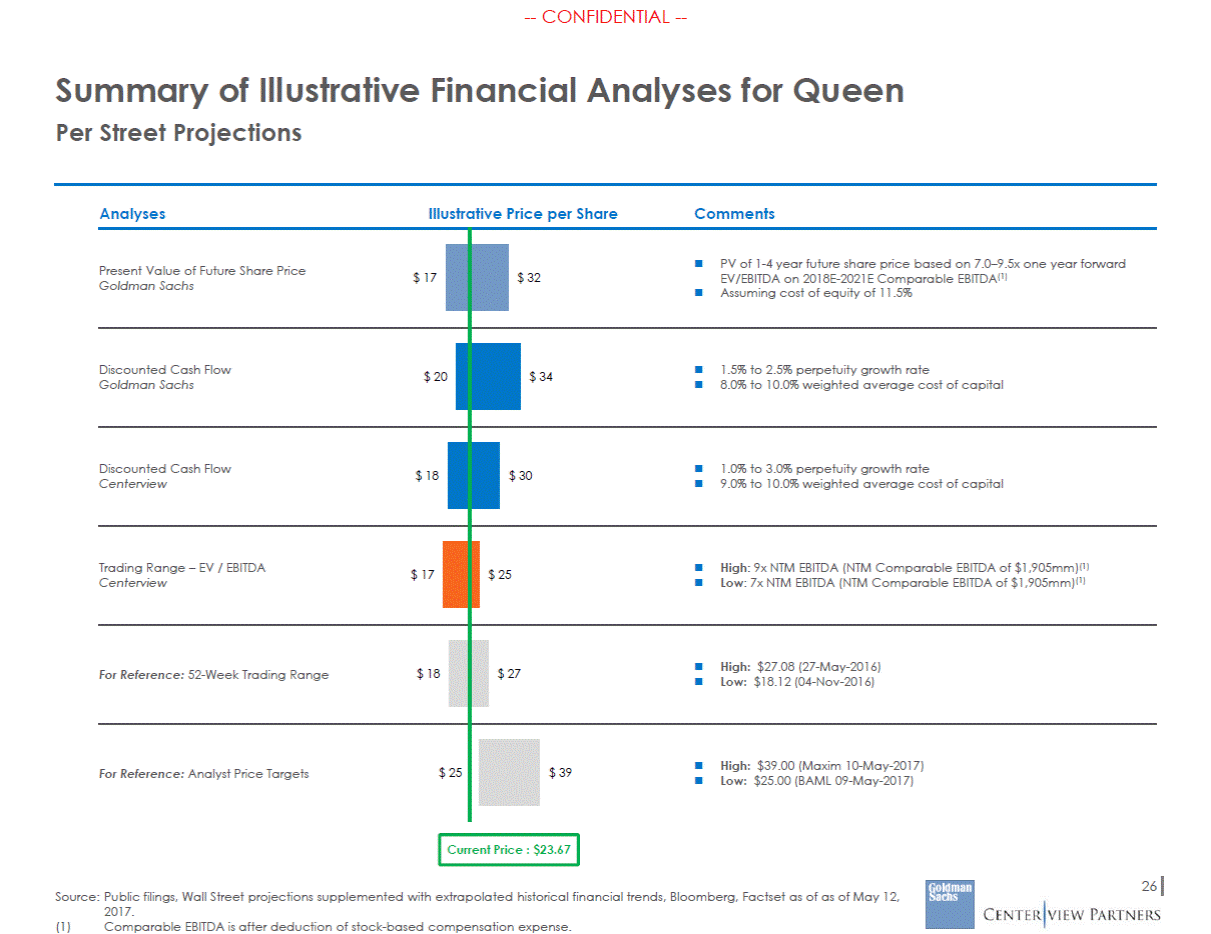
--CONFIDENTIAL --Queen Street Expectations Summary Queen projections based on Wall Street research for revenue and EBITDA through 2020 and extrapolated thereafter EPS assumes $800mm annual share repurchases through projection period, consistent with Queen’s historical repurchase activity Estimates have decreased across all metrics since February Committee meeting Revenue Adjusted EBITDA(1) EPS(2) $12,065 $2,413 $3.39 $1,887 2015A 2016E 2017E 2018E 2019E 2020E 2021E 2015A 2016E 2017E 2018E 2019E 2020E 2021E 2015A 2016E 2017E 2018E 2019E 2020E 2021E YoY Growth % Margin YoY Growth (8.6%) 11.5% 0.8% 3.6% 4.2% 3.8% 4.5% 20.6% 18.9% 18.8% 19.1% 19.4% 19.8% 20.0% 13.0% (7.5%) 11.0% 16.9% 20.4% 13.7% 13.0% in Estimates Since February Meeting in Estimates Since February Meeting in Estimates Since February Meeting (3.4%)(4.7%) (5.6%) (6.2%) (6.2%) (3.8%) (5.2%) (7.5%) (6.1%) (6.2%) (4.7%) (7.8%) (10.4%) (9.1%) (9.7%) – – – – – – 27 Source: FactSet as of May 12, 2017. (1) (2) Adjusted EBITDA is before the deduction of stock-based compensation expense. Does not account for potential effects of reattribution of exchangeable debentures associated with GCI-Lion transaction. $3.00 $2.64 $2.19 $1.83 $1.87 $1.69 $2,284 $2,158 $2,035 $1,936 $1,938 $11,545 $11,119 $10,666 $10,219 $10,299 $9,169
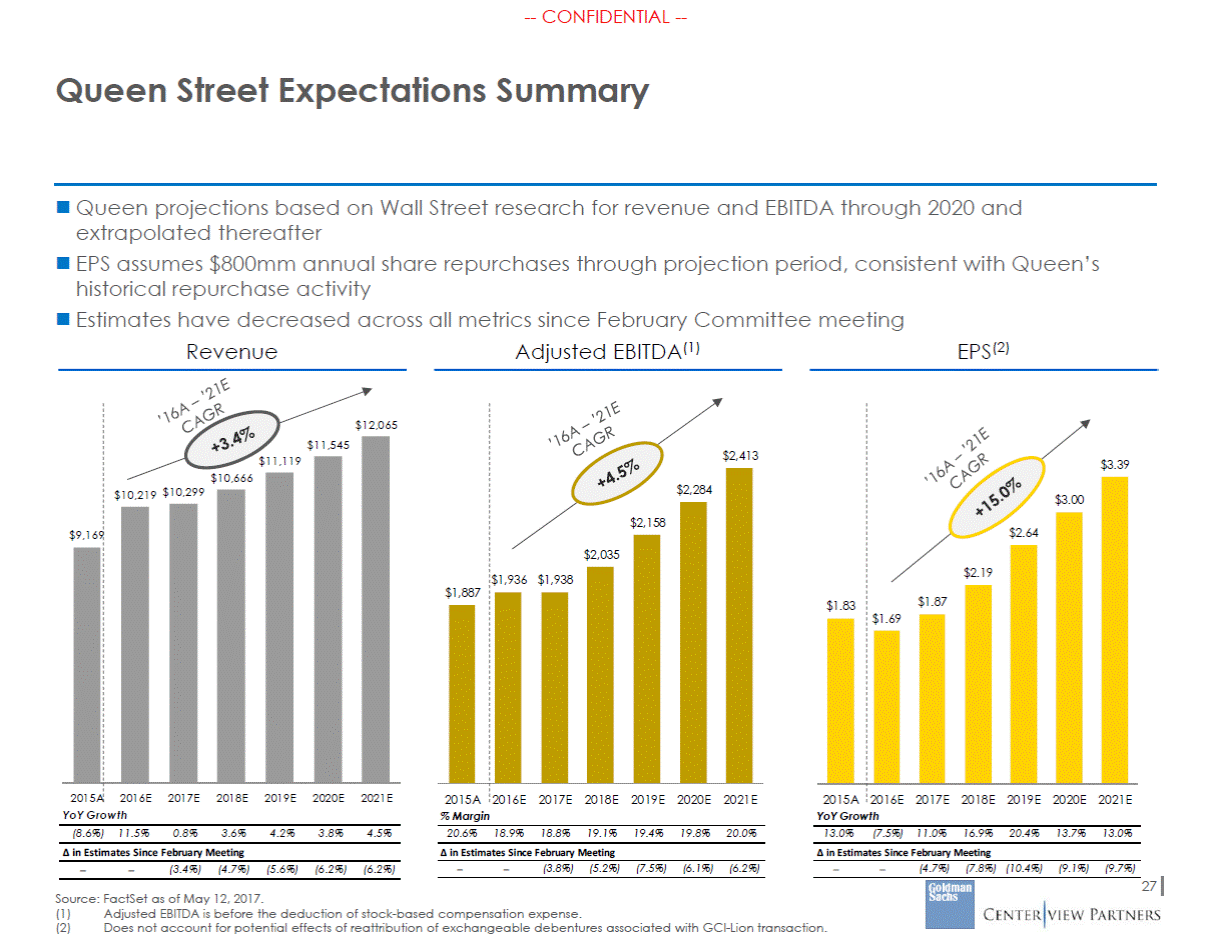
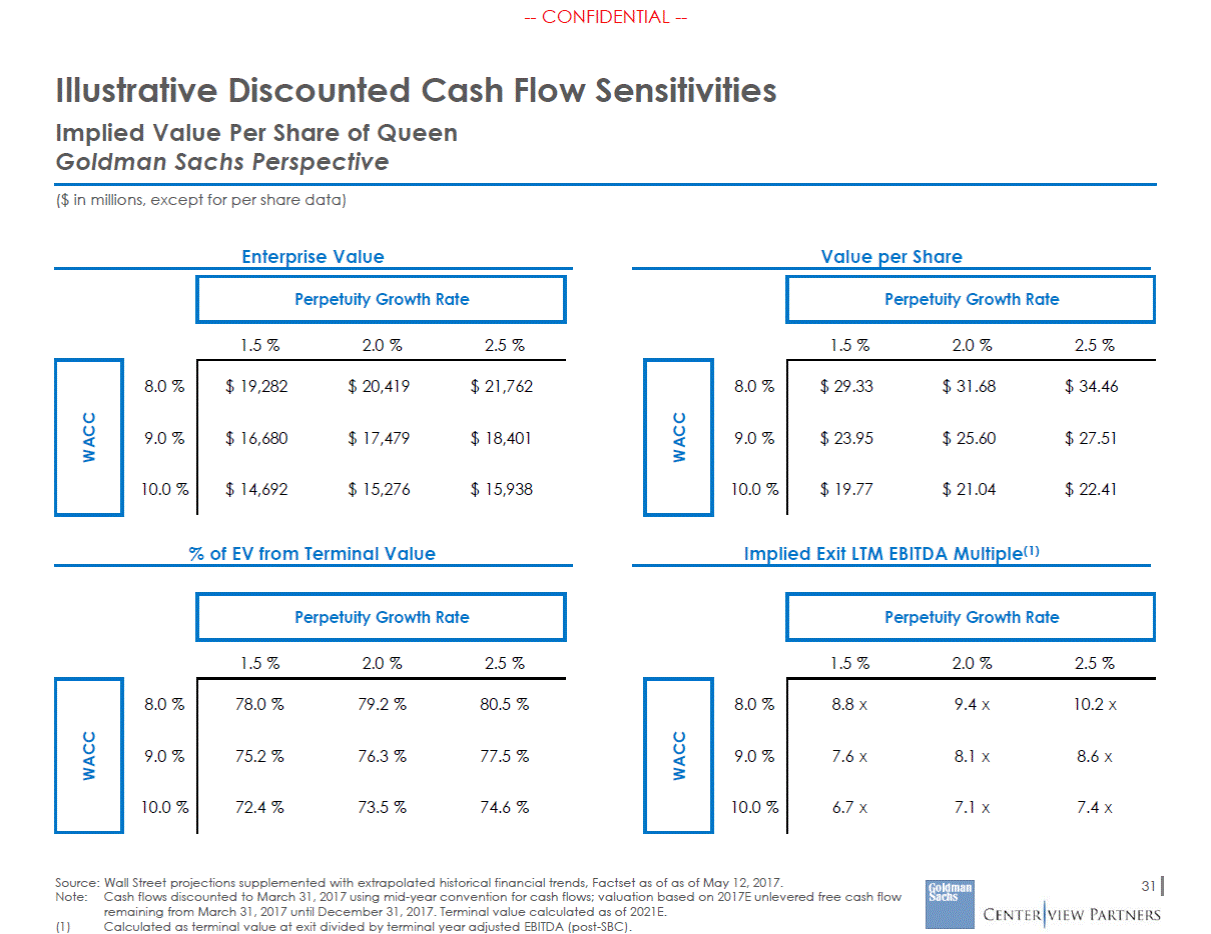
--CONFIDENTIAL --Queen Standalone Street Financials Historical Street Projections CAGR 2014A 2015A 2016A 2017E 2018E 2019E 2020E 2021E '14-16A '16-21E Gross Profit $3,650 $3,322 $3,577 $3,459 $3,591 $3,665 $3,817 $3,981 (1.0%) 2.2% (Less): Operating Expenses ($1,711) ($1,435) ($1,641) ($1,521) ($1,555) ($1,507) ($1,532) ($1,568) (Less): Stock-Based Comp. (Less): D&A (Less): Other Reported EBIT Plus: Equity Earnings / Other (Less): Net Interest Expense Pre-Tax Income (Less): Taxes Net Income (Less): NCI & Other Net Income to Queen Plus: Adjustments Adjusted Net Income to Queen (83) (587) (7) $1,262 (14) (312) $936 (306) $630 (54) $576 219 $795 (60) (657) – $1,170 91 (283) $978 (304) $674 (34) $640 238 $878 (75) (850) – $1,011 86 (289) $808 (297) $511 (38) $473 339 $812 (67) (694) – $1,176 49 (284) $941 (329) $612 (35) $577 254 $830 (69) (434) – $1,532 57 (291) $1,298 (454) $844 (48) $796 114 $910 (72) (311) – $1,775 64 (290) $1,549 (542) $1,007 (57) $949 79 $1,029 (75) (258) – $1,951 70 (284) $1,737 (608) $1,129 (64) $1,065 41 $1,105 (78) (222) – $2,113 77 (273) $1,916 (671) $1,245 (71) $1,174 12 $1,187 (10.5%) 15.9% 1.1% 7.9% Memo: Comparable EBITDA(2) $1,856 $1,827 $1,861 $1,871 $1,966 $2,086 $2,209 $2,335 0.1% 4.6% 28 Source: Wall Street research. (1) (2) Adjusted EBITDA is before deduction of stock based compensation expense. Comparable EBITDA is after deduction of stock-based compensation expense. Adjusted Diluted EPS $1.62 $1.83 $1.69 $1.87 $2.19 $2.64 $3.00 $3.39 2.2% 15.0% YoY Growth 13.0% (7.5%) 11.0% 16.9% 20.4% 13.7% 13.0% Adjusted EBITDA(1) $1,939 $1,887 $1,936 $1,938 $2,035 $2,158 $2,284 $2,413 (0.1%) 4.5% % Margin 19.3% 20.6% 18.9% 18.8% 19.1% 19.4% 19.8% 20.0% % of Sales 17.1% 15.7% 16.1% 14.8% 14.6% 13.6% 13.3% 13.0% % Margin 36.4% 36.2% 35.0% 33.6% 33.7% 33.0% 33.1% 33.0% Revenue $10,028 $9,169 $10,219 $10,299 $10,666 $11,119 $11,545 $12,065 0.9% 3.4% YoY Growth (8.6%) 11.5% 0.8% 3.6% 4.2% 3.8% 4.5%
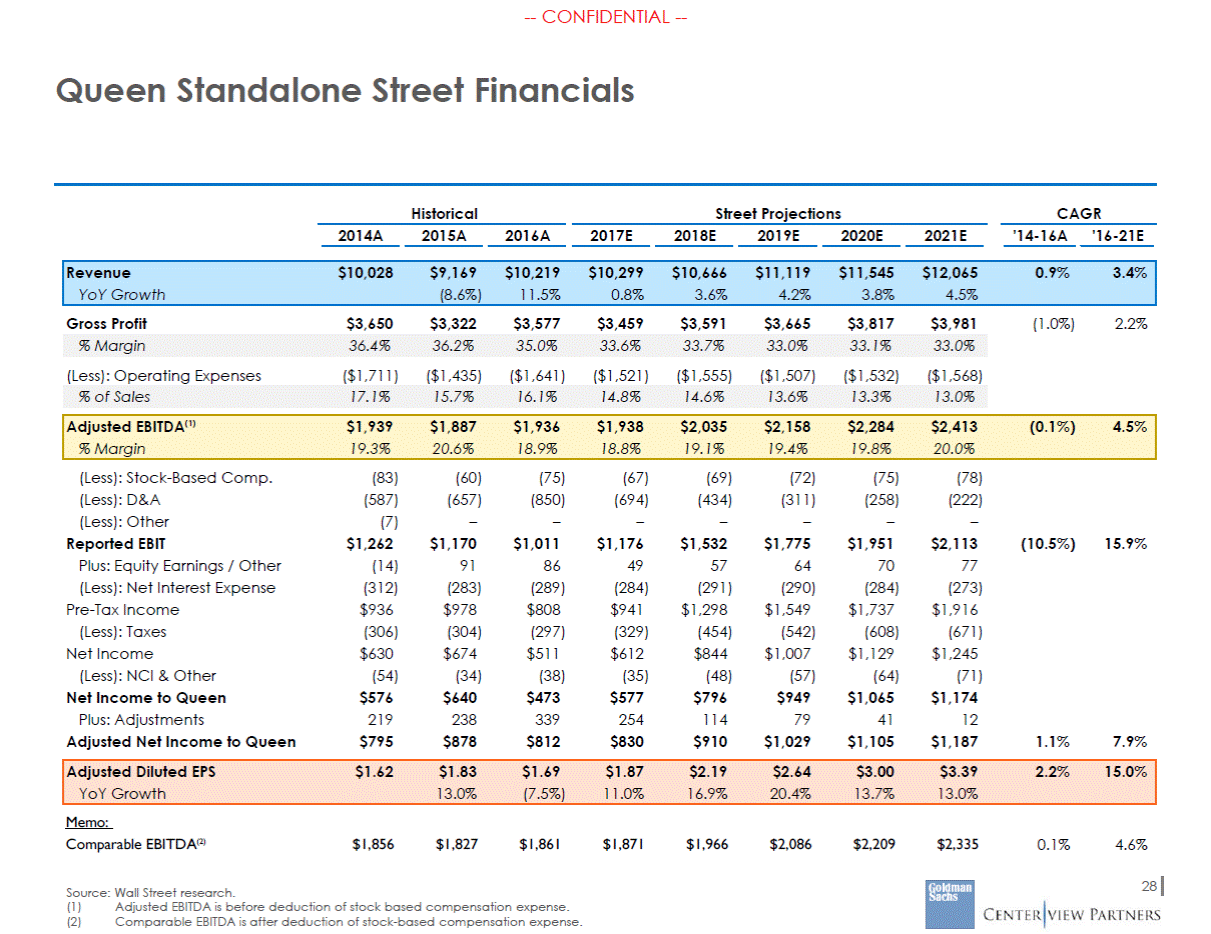
--CONFIDENTIAL --Illustrative Public Market Present Value of Future Share Price Analysis Based on Queen Projections Based on 1 Year Forward EV/EBITDA Multiples | Goldman Sachs Perspective Present Value of Future Stock Price + Dividends at 11.5% Cost of Equity Future Value of Share Price $ 47.60 $ 41.10 $ 43.68 $ 40.13 $ 35.25 $ 37.31 $ 33.85 $ 31.65 $ 30.47 $ 29.88 $ 35.25 $ 29.14 $ 31.62 $ 28.29 $ 27.54 $ 29.04 $ 26.68 $ 27.66 $ 25.09 $ 26.43 $ 23.26 $ 29.04 $ 26.13 $ 23.38 $ 24.36 $ 21.43 $ 23.67 $ 23.67 $ 23.44 $ 23.62 $ 21.53 $ 19.53 $ 18.81 $ 17.33 Current 1/1/2018 1/1/2019 1/1/2020 1/1/2021 Current 1/1/2018 1/1/2019 1/1/2020 1/1/2021 7.0x Forward EV/EBITDA 8.0x Forward EV/EBITDA 8.7x Forward EV/EBITDA 9.5x Forward EV/EBITDA Balance Sheet at 8.7x EV / EBITDA Jan-2018E Jan-2019E Jan-2020E Jan-2021E 1-Yr Forward EBITDA $ 1,966 $ 2,086 $ 2,209 $ 2,335 Net Debt $ 5,789 $ 5,480 $ 5,131 $ 4,678 Diluted Shares Outstanding (mm) 423.8 386.1 355.7 330.9 - - - - Dividends Per Share Source: Queen historical financials and Wall Street projections supplemented with extrapolated historical financial trends, Factset as of as of May 12, 2017. Note:Present Value of Future Stock Price includes dividends discounted based on mid-year convention. Future share prices and dividends discounted to March 31, 2017. 29
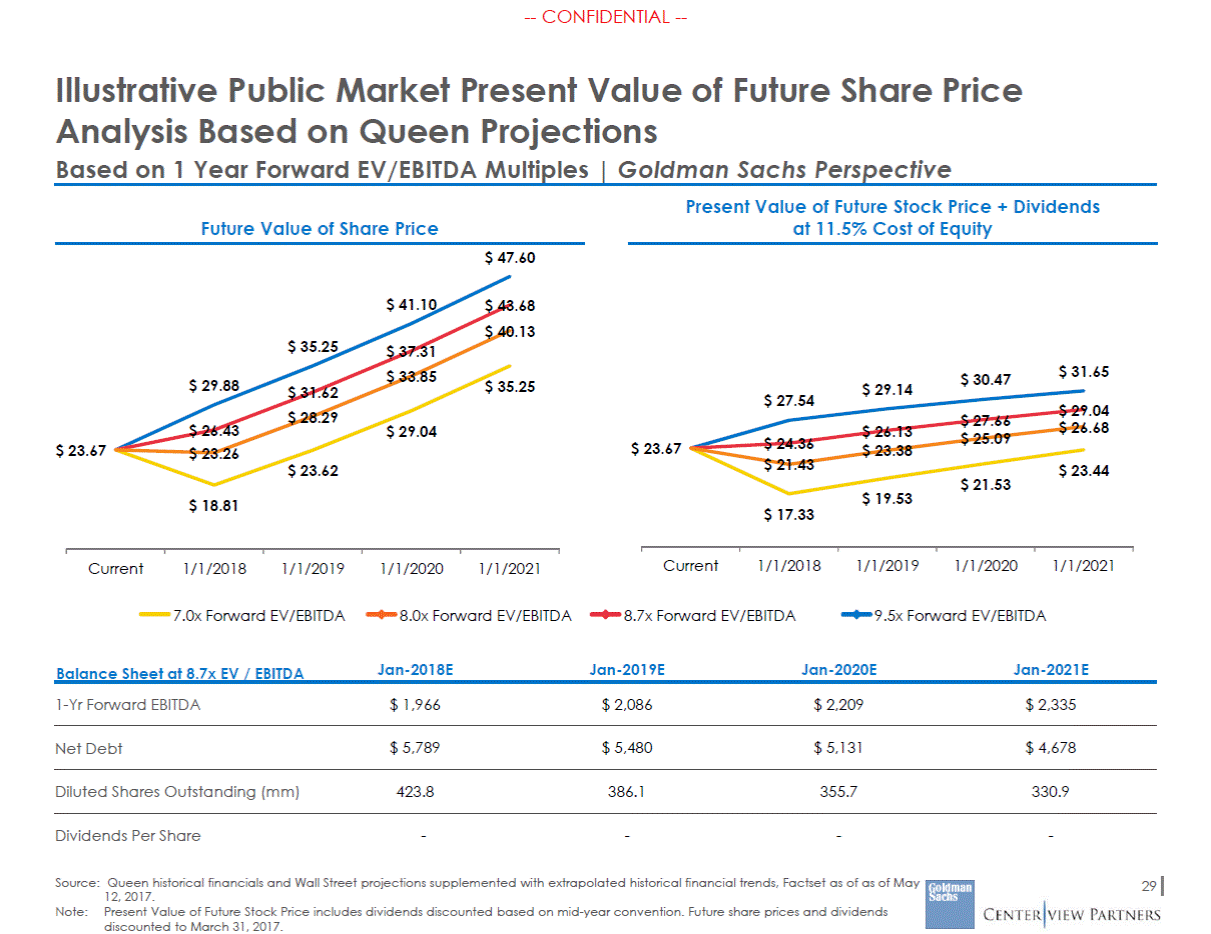
--CONFIDENTIAL --Illustrative Queen Discounted Cash Flow Projected Unlevered Free Cash Flow & Terminal Value Goldman Sachs Perspective Analysis ($ in millions, except for per share data) Historical Management Projections Terminal Year $ 12,306 2.0 % 2014A $ 10,028 - 2015A $ 9,169 (8.6)% 2016A $ 10,219 11.5 % 2017E $ 10,299 0.8 % 2018E $ 10,666 3.6 % 2019E $ 11,119 4.2 % 2020E $ 11,545 3.8 % 2021E $ 12,065 4.5 % Revenue % Growth % Margin Less: Stock-Based Compensation 19.3 % $(83) 20.6 % $(60) 18.9 % $(75) 18.8 % $(67) 19.1 % $(69) 19.4 % $(72) 19.8 % $(75) 20.0 % $(78) 20.0 % $(80) % Margin Less: Depreciation Less: Amortization (excl. Trans. Amort.) 20.2 % $(135) $(129) 21.2 % $(138) $(138) 19.7 % $(164) $(148) 19.5 % $(176) $(128) 19.7 % $(182) $(76) 20.1 % $(189) - 20.4 % $(195) - 20.7 % $(203) - 20.7 % $(207) - % Margin Less: Adjusted Tax Expense (35%) Plus: Depreciaton Plus: Amortization (excl. Trans. Amort.) Less: Capital Expenditures Less: Increase in NWC 15.8 % 16.9 % 15.2 % 15.2 % $(548) 176 128 (206) (168) 16.0 % $(598) 182 76 (213) (57) 17.1 % $(664) 189 - (222) (73) 17.4 % $(705) 195 - (231) (62) 17.7 % $(746) 203 - (241) (87) 17.7 % $(761) 207 - (232) (42) % of Adjusted EBITDA 53.9 % 52.2 % 53.0 % 52.2 % 54.7 % Illustrative Terminal Value Assumed Perpetuity Growth Rate Illustrative WACC Terminal FCF 2.0 % 9.0 % $ 1,347 Terminal Value at Exit Implied Terminal Value LTM EBITDA Multiple $ 19,237 7.6 x Present Value of Terminval Value $ 13,337 Terminal Value % of Total Value (-) Net Debt (-) Noncontrolling Interest (+) Queen Chinese Joint Venture (+) Queen Stake in Hero Equity Value Shares Outstanding (mm) 76.3 % $ 5,842 $ 836 $ 240 $ 714 $ 11,755 459.11 Source: Queen historical financials and Wall Street projections supplemented with extrapolated historical financial trends, Factset as of as of May 12, 2017. Implied EBITDA multiples based on adjusted EBITDA (post-SBC). Note:Cash flows discounted to March 31, 2017 using mid-year convention for cash flows; valuation based on 2017E unlevered free cash flow remaining from March 31, 2017 until December 31, 2017. 30 (1) Includes adjustments for equity associates and noncontrolling interest. (2) Does burden EBIT with stock-based compensation expense. Illustrative Implied Equity Value per Share¹ $ 25.60 Total DCF Value $ 17,479 $ 1,347 Unlevered Free Cash Flow $ 949 $ 1,097 $ 1,126 $ 1,212 $ 1,260 $ 2,174 EBIT² $ 1,585 $ 1,551 $ 1,549 $ 1,566 $ 1,708 $ 1,897 $ 2,014 $ 2,132 $ 2,541 Adj. EBITDA (post-SBC) $ 2,022 $ 1,947 $ 2,011 $ 2,005 $ 2,104 $ 2,230 $ 2,359 $ 2,491 $ 2,461 Adj. EBITDA (pre-SBC) $ 1,939 $ 1,887 $ 1,936 $ 1,938 $ 2,035 $ 2,158 $ 2,284 $ 2,413
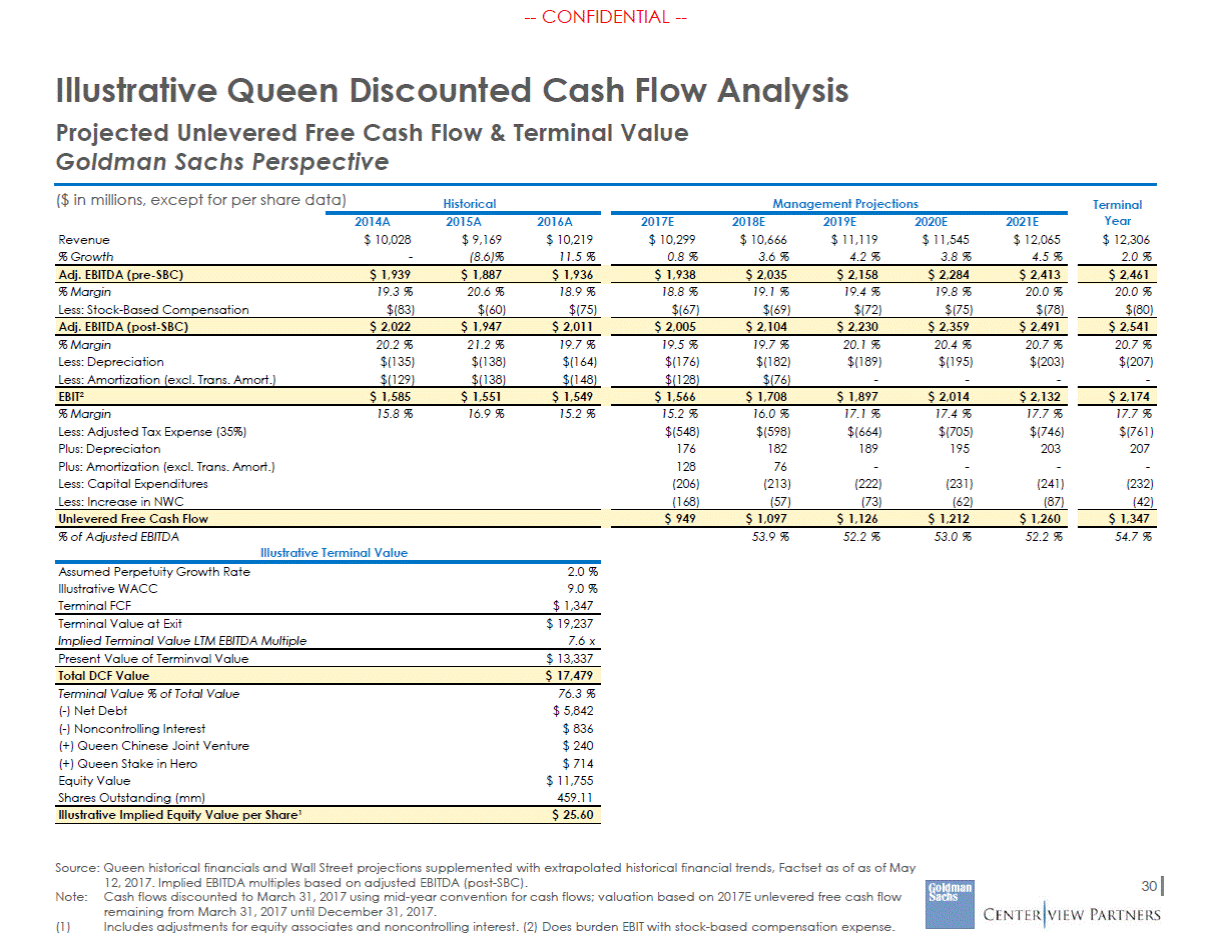
--CONFIDENTIAL --Illustrative Discounted Cash Flow Implied Value Per Share of Queen Goldman Sachs Perspective Sensitivities ($ in millions, except for per share data) Enterprise Value Value per Share 1.5 % 2.0 % 2.5 % 1.5 % 2.0 % 2.5 % 8.0 % 8.0 % 9.0 % 9.0 % 10.0 % 10.0 % Implied Exit LTM EBITDA Multiple(1) % of EV from Terminal Value 1.5 % 2.0 % 2.5 % 1.5 % 2.0 % 2.5 % 8.0 % 8.0 % 9.0 % 9.0 % 10.0 % 10.0 % Source: Wall Street projections supplemented with extrapolated historical financial trends, Factset as of as of May 12, 2017. Note:Cash flows discounted to March 31, 2017 using mid-year convention for cash flows; valuation based on 2017E unlevered free cash flow remaining from March 31, 2017 until December 31, 2017. Terminal value calculated as of 2021E. 31 (1) Calculated as terminal value at exit divided by terminal year adjusted EBITDA (post-SBC). 8.8 x 9.4 x 10.2 x 7.6 x 8.1 x 8.6 x 6.7 x 7.1 x 7.4 x WACC 78.0 % 79.2 % 80.5 % 75.2 % 76.3 % 77.5 % 72.4 % 73.5 % 74.6 % WACC Perpetuity Growth Rate Perpetuity Growth Rate $ 29.33 $ 31.68 $ 34.46 $ 23.95 $ 25.60 $ 27.51 $ 19.77 $ 21.04 $ 22.41 WACC $ 19,282 $ 20,419 $ 21,762 $ 16,680 $ 17,479 $ 18,401 $ 14,692 $ 15,276 $ 15,938 WACC Perpetuity Growth Rate Perpetuity Growth Rate
--CONFIDENTIAL --Illustrative Queen Discounted Cash Flow Analysis Based on Expectations Centerview Perspective Street Queen Standalone Unlevered Free Cash Flows Fiscal Year Ending December 31, 2016A 2017E 2018E 2019E 2020E 2021E Adjusted EBITDA (Less): Stock-Based Compensation Comparable EBITDA(1) (Less): D&A (Excluding Trans. Amort.) Adjusted EBIT (Less): Taxes Plus: D&A (Exluding Trans. Amort.) (Less): in Net Working Capital (Less): Capital Expenditures Unlevered Free Cash Flow YoY Growth $1,936 (75) $1,861 (312) $1,549 $1,938 (67) $1,871 (304) $1,566 (548) 304 (168) (206) $949 $2,035 (69) $1,966 (258) $1,708 (598) 258 (57) (213) $1,097 15.7% $2,158 (72) $2,086 (189) $1,897 (664) 189 (73) (222) $1,126 2.6% $2,284 (75) $2,209 (195) $2,014 (705) 195 (62) (231) $1,212 7.6% $2,413 (78) $2,335 (203) $2,132 (746) 203 (87) (241) $1,260 4.0% Enterprise Value ($bn) Perpetuity Growth Rate Implied LTM Exit Multiple Perpetuity Growth Rate Value per Share ($) Perpetuity Growth Rate Discount Rate 1.0% 2.0% 3.0% 1.0% 2.0% 3.0% 1.0% 2.0% 3.0% 9.0% 9.5% 10.0% $15.4 14.5 13.7 $17.2 16.0 15.0 $19.5 18.0 16.7 7.4x 7.0x 6.7x 8.6x 8.0x 7.6x 10.1x 9.4x 8.7x $21.45 19.49 17.72 $25.05 22.69 20.61 $29.84 26.76 24.12 32 Source: Wall Street research and Factset as of May 12, 2017. Note:Dollars in millions, unless otherwise noted. Assumes mid-year discounting convention. Balance sheet information as of September 30, 2016. (1) Comparable EBITDA is calculated after deduction of stock-based compensation expense .
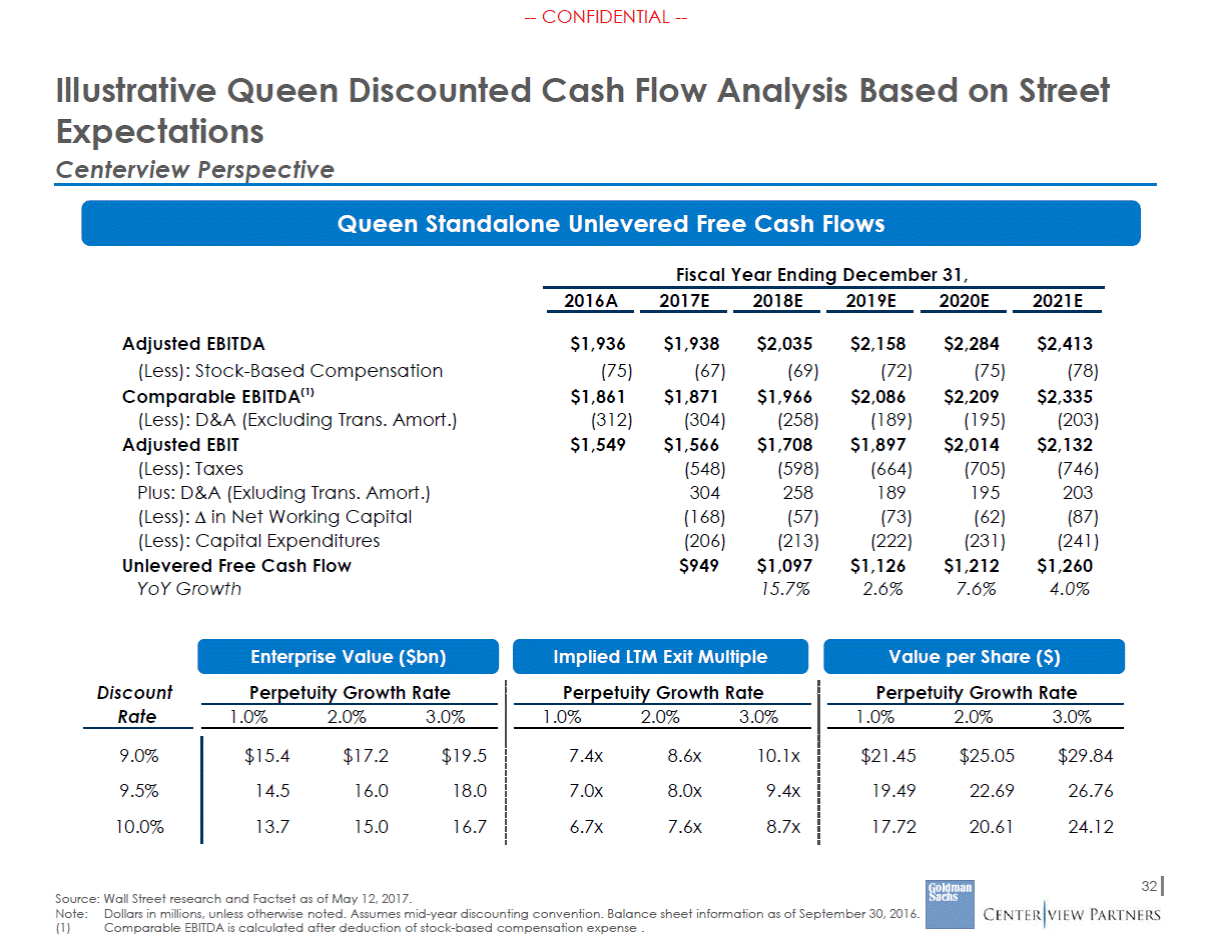
--CONFIDENTIAL --Pro Forma Financial Profile Assumes illustrative $125mm of run-rate synergies ’16A-’21E Revenue CAGR 2021E Adj. EBITDA Margin(1) 20.0% Pro Forma Revenue Mix Based on 2016A Cornerstone 18.2% 8% 3.6% 3.4% 3.4% Hero 18% 44% Queen U.S. 11% zulily 19% Hero Standalone Queen Pro Forma Hero Standalone Queen Pro Forma Queen Intl '16A-'21E CAGR Fiscal Year Ending December 31, 2016A 2017E 2018E 2019E 2020E 2021E Queen Revenue Hero Revenue Revenue Synergies $10,219 3,567 – $10,299 3,637 – $10,666 3,786 – $11,119 3,946 – $11,545 4,100 – $12,065 4,257 – 3.4% 3.6% Memo: Hero S/A Growth 1.9% 4.1% 4.2% 3.9% 3.8% Queen Adjusted EBITDA Hero Adjusted EBITDA Net Synergies (Including Cost to Achieve) $1,936 299 – $1,938 307 – $2,035 346 16 $2,158 377 109 $2,284 408 125 $2,413 441 125 4.5% 8.1% Memo: Hero Standalone Margin 8.4% 8.4% 9.1% 9.5% 9.9% 10.4% Source: Hero Management, Wall Street research, and Factset as of May 12, 2017. Note:For illustrative purposes, assumes $125mm of run-rate synergies phased in 50% in 2018E and 100% in 2019E. Cost to achieve synergies equal to 50% of run-rate synergies and incurred 75% in 2018E and 25% in 2019E. 33 (1) Adjusted EBITDA is before deduction of stock based compensation expense. Pro Forma Adjusted EBITDA(1)$2,235$2,245$2,397$2,644$2,817$2,9795.9% % Margin16.2%16.1%16.6%17.6%18.0%18.2% Pro Forma Revenue$13,786$13,936$14,453$15,065$15,645$16,3223.4% % YoY Growth1.1%3.7%4.2%3.9%4.3% 10.4%
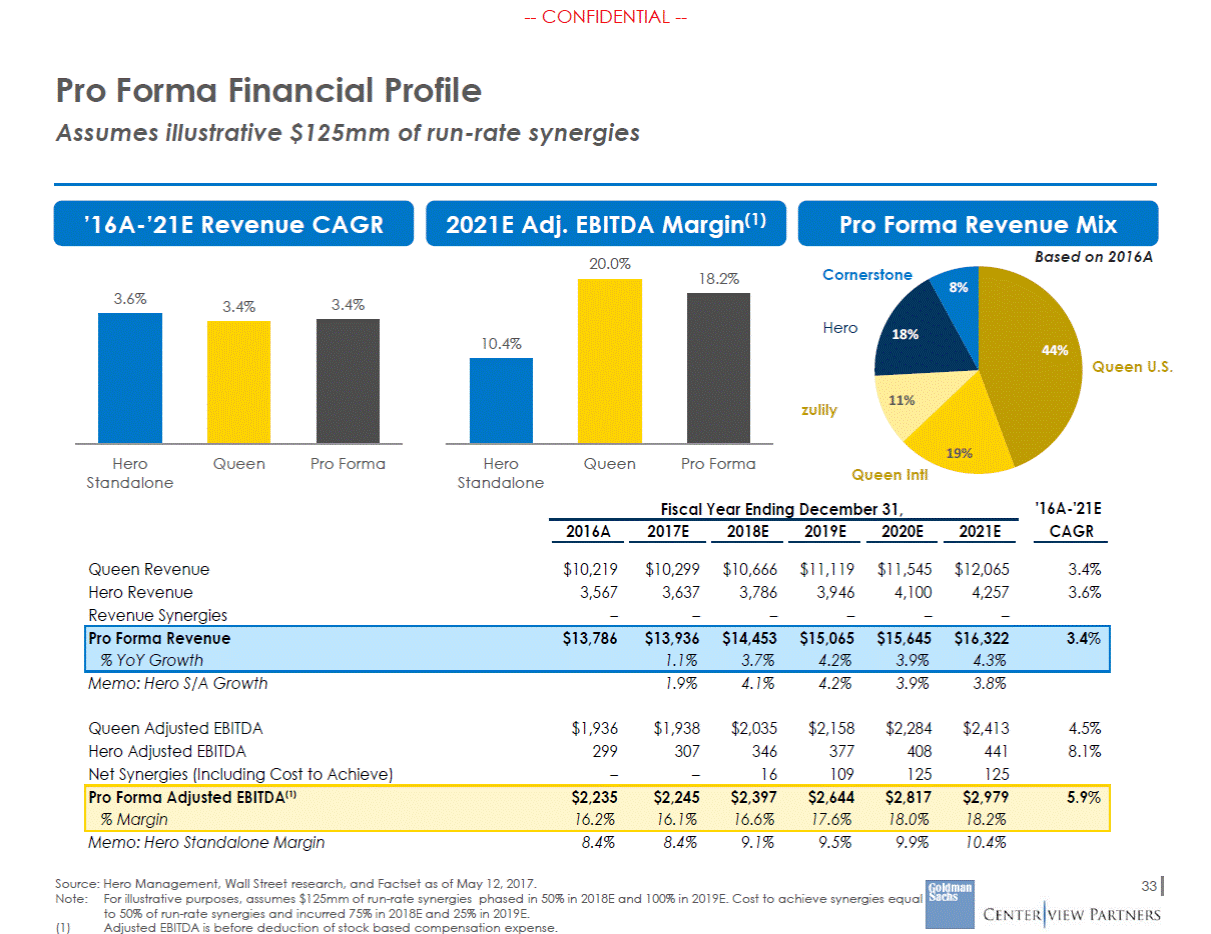
--CONFIDENTIAL --Illustrative Offer Price Required for Hero Shareholders to Receive 50% of Capitalized Synergy Value Overview Hero shareholders will receive potential value from several sources in a combination with Queen: Illustrative Math Current Queen Market Cap (Less): Hero Stake Current Hero Market Cap Equity Value Before Synergies Synergies Fees Synergized Equity Value $10,820 (714) 1,909 — A. Current market value implies 15.9% ownership of synergies $12,015 750 (50) — B. Premium provides increased ownership in pro forma company — C. Premium provides incremental ownership in synergies $12,715 In order for Hero shareholders to achieve 50% of the $700mm net synergy value cited by Queen(1), total value creation to Hero shareholders would need to equal $350mm Current Hero Market Cap Half Net Synergies Total Value Required to Hero Implied Pro Forma Ownership Required $1,909 350 $2,259 17.8% — Implies that all Hero shareholders’ pro forma stake must equal $2,259mm (current $1,909mm Hero market value plus $350mm) Offer Price Headline Premium Implied DSO Headline Equity Value Hero Share of Synergy Value — $2,259mm is 17.8% of $12,715mm pro forma company value at current market prices, including synergies 13.2% 53.6 $2,164 124 (28) In order for Hero to own 17.8% of the pro forma company, the headline offer price per share would need to be $40.37(2) based on current trading levels, or a 13.2% headline premium (3) Reversion to Market Value Total Value to Hero $2,259 — Implies headline equity value of $2,164mm, which doesn’t account for Hero’s share of synergies Decomposition of Value A. Share of Synergies @ Current Mkt. Value B. Incremental Ownership of PF Queen C. Incremental Ownership of Synergies Total Value Creation to Hero SH $111 226 13 Source: Hero Management, company filings and Factset as of May 12, 2017. $350 Note: Analysis based on offer value and current Hero share price; if Hero intrinsic value is higher than market, implies Hero is receiving lower share of synergies than what’s implied by share price (1) (2) (3) Based on conversations with Lion Interactive CEO. Indicated synergy value of $750mm based on ~8.0x multiple. Adjustment to reflect that value of pro forma Queen will not reflect value of premium to Hero (i.e., Hero valued at current market value). $40.37 is calculated as (i) 17.8% * current Queen market value ex-Hero stake; divided by (ii) (a) Hero diluted shares outstanding times (b) one minus 17.8%. 34 $40.37
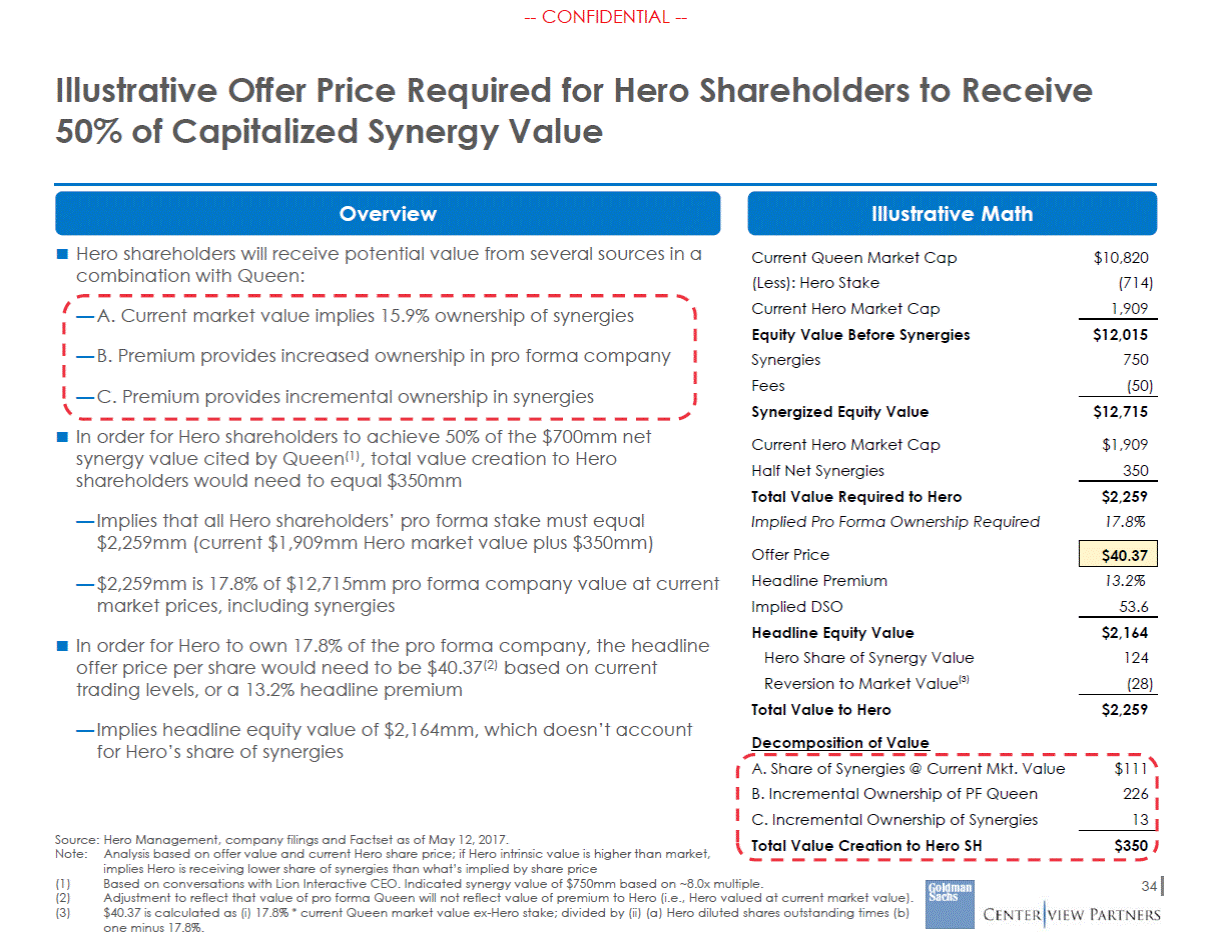
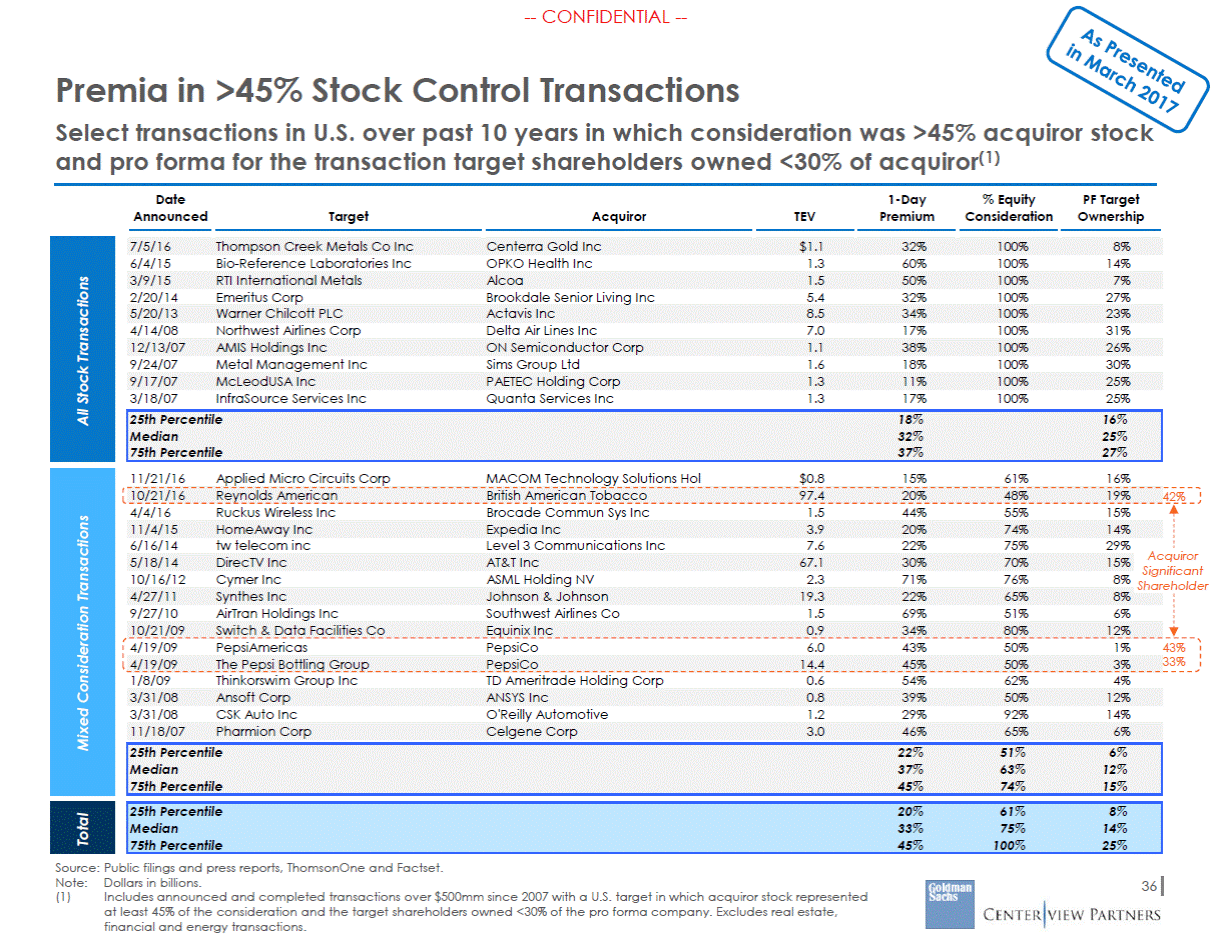
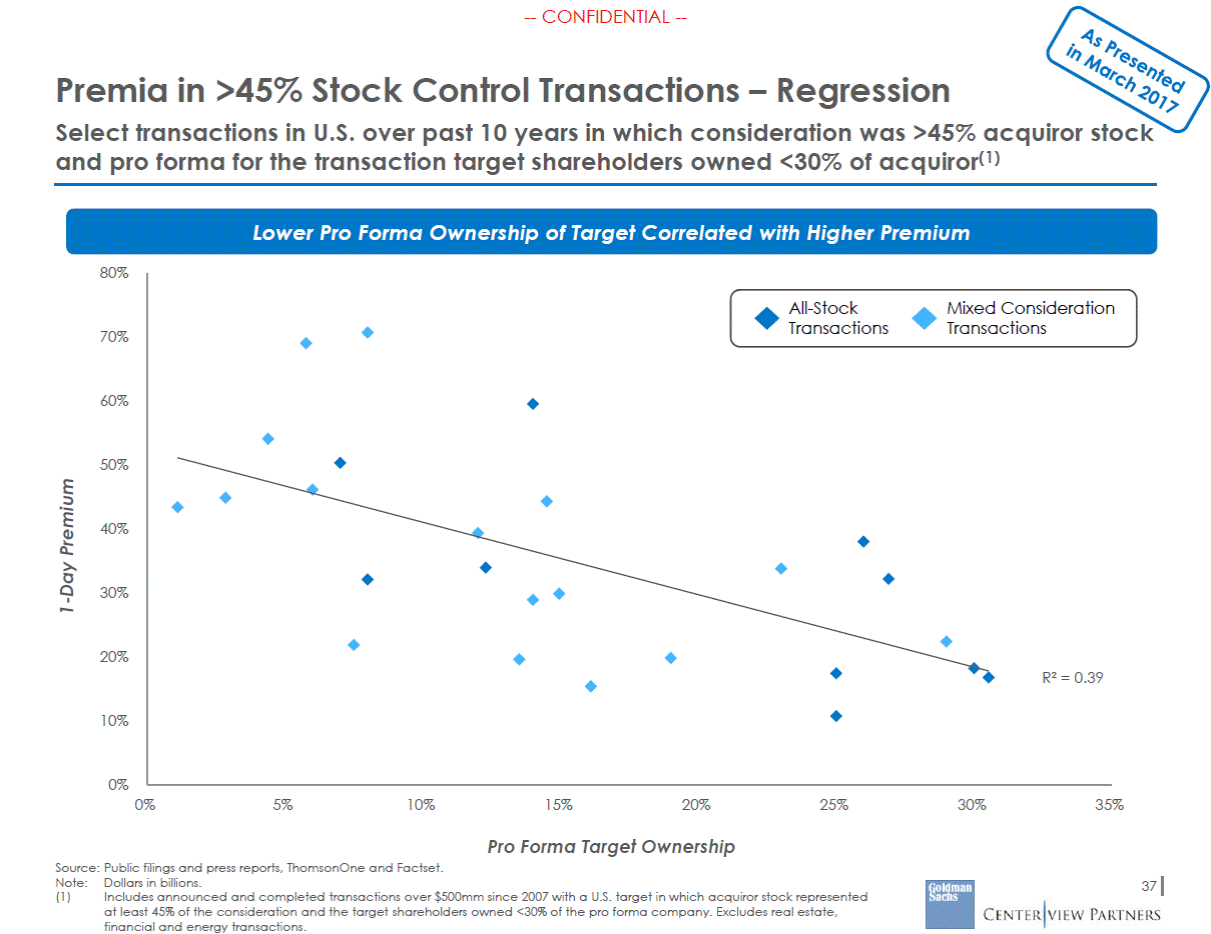
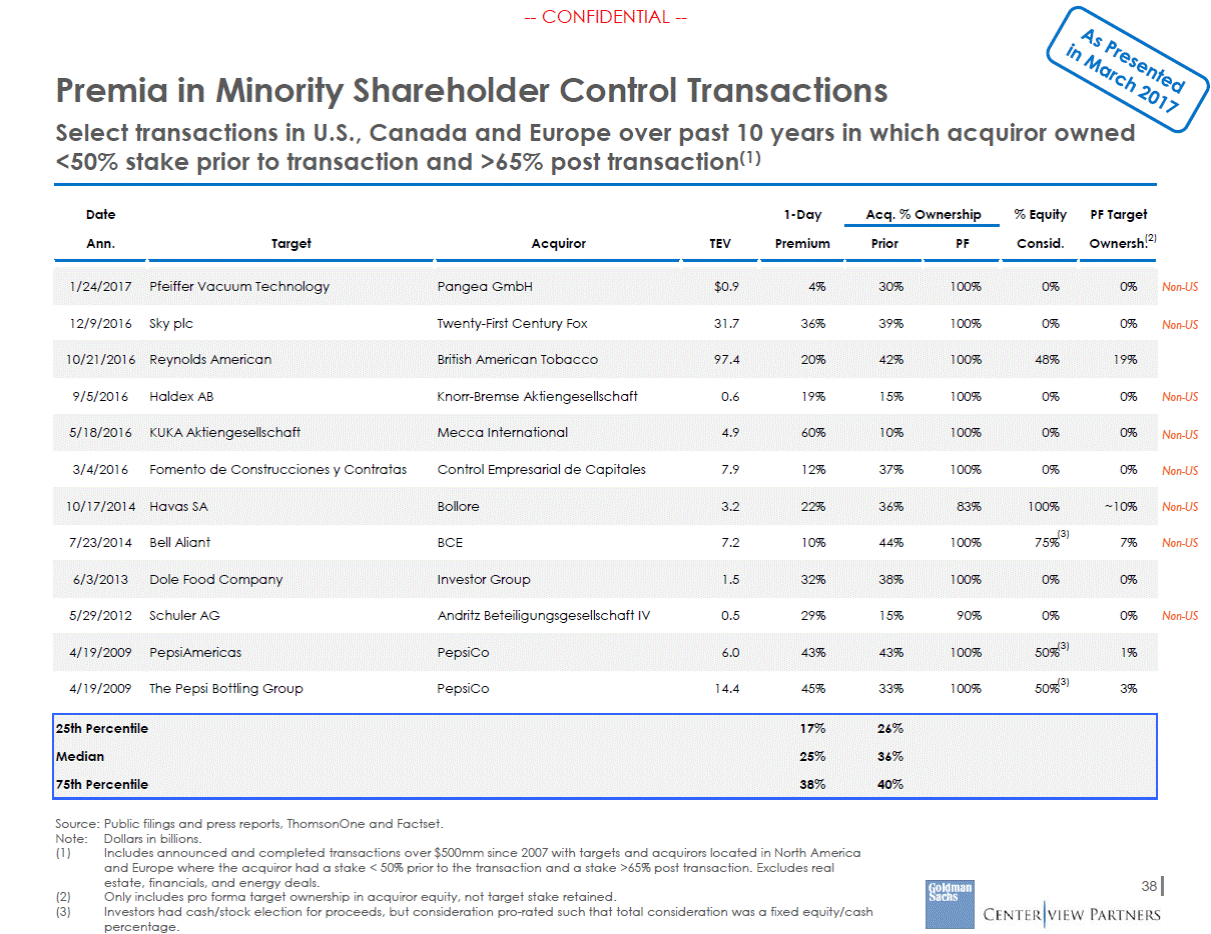
--CONFIDENTIAL --Premiums in Precedent Cash/Stock Control Transactions Premiums in precedent cash/stock control transactions have typically been in the range of ~20-40%; however, limited comparability of dataset Limited number of transactions with a truly comparable structure to that of the potential transaction between Hero and Queen (i.e., 100% stock transaction where the acquiror owns a significant stake in target prior to the transaction and the target retains a ~10-20% stake in the pro forma company) — No identified comparable minority shareholder control, all-stock transactions identified in the U.S. over past ten years >45% Stock Control Transactions: >45% of the consideration was acquiror stock and pro forma for the transaction the target shareholders owned <30% of acquiror (26 transactions)(1) — Premia have typically been in the range of ~20% - 45% (25th-75th percentile) over the past ten years, with median of 33% (lower premia on the all-stock deals) — Lower pro forma ownership associated with higher premium (R-squared of ~39%), consistent with notion that a higher premium compensates the seller for lower synergy capture and control Minority Shareholder Control Transactions: the acquiror owned <50% of the target prior to the transaction and >65% of the target post-transaction (12 transactions)(2) — Premia have typically been in the range of ~17% - 38% (25th-75th percentile) over the past ten years, with a median of 25% — Most of dataset consists of cash deals; limited number of transactions in U.S. over past ten years Source: Public filings and press reports, ThomsonOne and Factset. Note: (1) Dollars in billions. Includes announced and completed transactions over $500mm since 2007 with a U.S. target in which acquiror stock represented at least 45% of the consideration and the target shareholders owned <30% of the pro forma company. Excludes real estate, financial and energy transactions. Includes announced and completed transactions over $500mm since 2007 with targets and acquirors located in North America and Europe where the acquiror had a stake < 50% prior to the transaction and a stake >65% post transaction. Excludes real estate, financials, and energy deals. 35 (2)
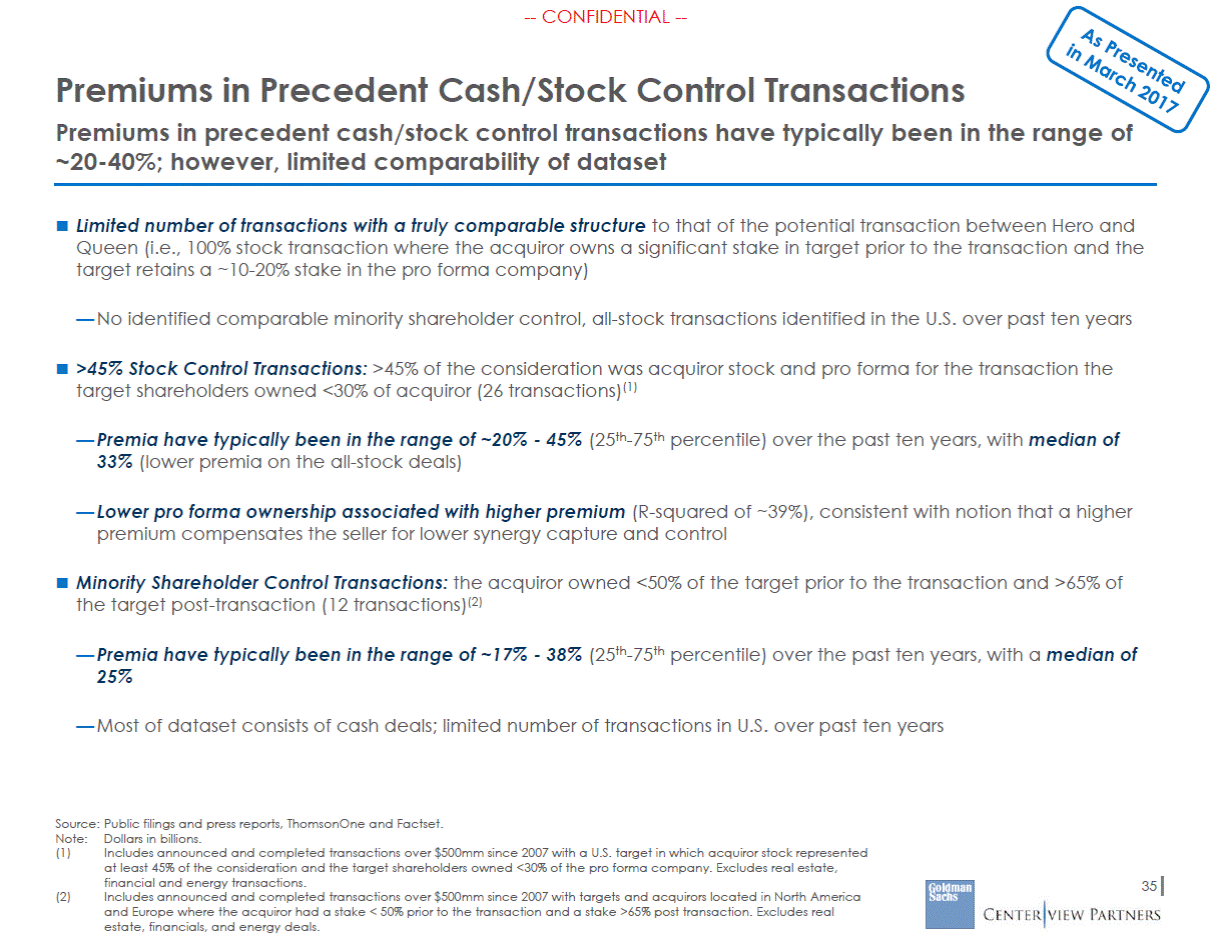
--CONFIDENTIAL --Premia in >45% Stock Control Transactions Select transactions in U.S. over past 10 years in which consideration was >45% acquiror stock and pro forma for the transaction target shareholders owned <30% of acquiror(1) Date Announced 1-Day Premium % Equity Consideration PF Target Ownership Target Acquiror TEV 6/4/15 Bio-Reference Laboratories Inc OPKO Health Inc 1.3 60% 100% 14% 2/20/14 Emeritus Corp Brookdale Senior Living Inc 5.4 32% 100% 27% 4/14/08 Northwest Airlines Corp Delta Air Lines Inc 7.0 17% 100% 31% 9/24/07 Metal Management Inc Sims Group Ltd 1.6 18% 100% 30% 3/18/07 InfraSource Services Inc Quanta Services Inc 1.3 17% 100% 25% 11/21/16 Applied Micro Circuits Corp MACOM Technology Solutions Hol $0.8 15% 61% 16% 4/4/16 Ruckus Wireless Inc Brocade Commun Sys Inc 1.5 44% 55% 15% 6/16/14 tw telecom inc Level 3 Communications Inc 7.6 22% 75% 29% Acquiror Significant 10/16/12 Cymer Inc ASML Holding NV 2.3 71% 76% 8% Shareholder 9/27/10 AirTran Holdings Inc Southwest Airlines Co 1.5 69% 51% 6% 4/19/09 PepsiAmericas PepsiCo 6.0 43% 50% 1% 43% 1/8/09 Thinkorswim Group Inc TD Ameritrade Holding Corp 0.6 54% 62% 4% 3/31/08 CSK Auto Inc O'Reilly Automotive 1.2 29% 92% 14% Source: Public filings and press reports, ThomsonOne and Factset. Note:Dollars in billions. 36 (1) Includes announced and completed transactions over $500mm since 2007 with a U.S. target in which acquiror stock represented at least 45% of the consideration and the target shareholders owned <30% of the pro forma company. Excludes real estate, financial and energy transactions. 25th Percentile20%61%8% Median33%75%14% 75th Percentile45%100%25% Total 11/18/07Pharmion CorpCelgene Corp3.046%65%6% 25th Percentile22%51%6% Median37%63%12% 75th Percentile45%74%15% 3/31/08Ansoft CorpANSYS Inc0.839%50%12% 4/19/09The Pepsi Bottling GroupPepsiCo14.445%50%3% 33% 10/21/09Switch & Data Facilities CoEquinix Inc0.934%80%12% 4/27/11Synthes IncJohnson & Johnson19.322%65%8% 5/18/14DirecTV IncAT&T Inc67.130%70%15% 11/4/15HomeAway IncExpedia Inc3.920%74%14% 10/21/16Reynolds AmericanBritish American Tobacco97.420%48%19% 42% Mixed Consideration Transactions 25th Percentile18%16% Median32%25% 75th Percentile37%27% 9/17/07McLeodUSA IncPAETEC Holding Corp1.311%100%25% 12/13/07AMIS Holdings IncON Semiconductor Corp1.138%100%26% 5/20/13Warner Chilcott PLCActavis Inc8.534%100%23% 3/9/15RTI International MetalsAlcoa1.550%100%7% All Stock Transactions 7/5/16Thompson Creek Metals Co IncCenterra Gold Inc$1.132%100%8%
--CONFIDENTIAL --Premia in >45% Stock Control Transactions – Regression Select transactions in U.S. over past 10 years in which consideration was >45% acquiror stock and pro forma for the transaction target shareholders owned <30% of acquiror(1) Lower Pro Forma Ownership of Target Correlated with Higher Premium 80% n 70% 60% 50% 40% 30% 20% 10% 0% 0% 5% 10% 15% 20% 25% 30% 35% Pro Forma Target Ownership Source: Public filings and press reports, ThomsonOne and Factset. Note:Dollars in billions. 37 (1) Includes announced and completed transactions over $500mm since 2007 with a U.S. target in which acquiror stock represented at least 45% of the consideration and the target shareholders owned <30% of the pro forma company. Excludes real estate, financial and energy transactions. 1-Day Premium All-StockMixed Consideratio TransactionsTransactions R² = 0.39
--CONFIDENTIAL --Premia in Minority Shareholder Control Transactions Select transactions in U.S., Canada and Europe over past 10 years in which acquiror owned <50% stake prior to transaction and >65% post transaction(1) Date 1-Day Acq. % Ownership % Equity PF Target Ownersh(.2) Ann. Target Acquiror TEV Premium Prior PF Consid. Non-US 12/9/2016 Sky plc Twenty-First Century Fox 31.7 36% 39% 100% 0% 0% Non-US 9/5/2016 Haldex AB Knorr-Bremse Aktiengesellschaft 0.6 19% 15% 100% 0% 0% Non-US Non-US 3/4/2016 Fomento de Construcciones y Contratas Control Empresarial de Capitales 7.9 12% 37% 100% 0% 0% Non-US Non-US (3) 75% 7/23/2014 Bell Aliant BCE 7.2 10% 44% 100% 7% Non-US 5/29/2012 Schuler AG Andritz Beteiligungsgesellschaft IV 0.5 29% 15% 90% 0% 0% Non-US 4/19/2009 PepsiAmericas PepsiCo 6.0 43% 43% 100% 50% 1% (3) 4/19/2009 The Pepsi Bottling Group PepsiCo 14.4 45% 33% 100% 50% 3% Source: Public filings and press reports, ThomsonOne and Factset. Note: (1) Dollars in billions. Includes announced and completed transactions over $500mm since 2007 with targets and acquirors located in North America and Europe where the acquiror had a stake < 50% prior to the transaction and a stake >65% post transaction. Excludes real estate, financials, and energy deals. Only includes pro forma target ownership in acquiror equity, not target stake retained. Investors had cash/stock election for proceeds, but consideration pro-rated such that total consideration was a fixed equity/cash percentage. 38 (2) (3) 25th Percentile17%26% Median25%36% 75th Percentile38%40% (3) 6/3/2013Dole Food CompanyInvestor Group1.532%38%100%0%0% 10/17/2014 Havas SABollore3.222%36%83%100%~10% 5/18/2016KUKA AktiengesellschaftMecca International4.960%10%100%0%0% 10/21/2016 Reynolds AmericanBritish American Tobacco97.420%42%100%48%19% 1/24/2017Pfeiffer Vacuum TechnologyPangea GmbH$0.94%30%100%0%0%
--CONFIDENTIAL --GCI Lion Transaction Summary On April 4, 2017 Lion Interactive announced an agreement for Lion Ventures Group to acquire GCI and split-off combined company (“GCI Lion”) from Lion Interactive/Queen Lion Interactive acquires GCI in a $2.68bn enterprise value transaction Transaction structured so that Lion Interactive contributes assets to a new entity, GCI Lion, in exchange for ~77% ownership (84% voting) — GIC shareholders receives $32.50 / share ($27.50 / share of common GCI Lion stock and $5.00 / share of new voting preferred stock) Reattribute exchangeable bonds, ILG shares, portfolio of Green Energy Investments and cash to Queen Group pre-closing Lion Interactive will pursue tax-free separation of its stake in GCI Lion by redeeming Ventures Group tracking stock for GCI Lion shares Remaining Lion Interactive Entity will be renamed Queen GCI Lion (GLIB) and Queen Group will trade as separate asset based stocks Pre-Transaction Lion Interactive (Tracking Stock) (Tracking Stock) evite Giggle Other Private Assets Charter Comm. Lion Broadband LendingTree FTD ILG Green Energy Investments Exchangeable Bonds Post-Transaction Reattributed along with ~$329mm of cash Queen Group (Asset Backed Stock) GCI Lion (Asset Backed Stock) GCI Charter Communications Lion Broadband LendingTree FTD evite Giggle Green Energy Investments Exchange-able Bonds 39 Source: Public filings and presentations.
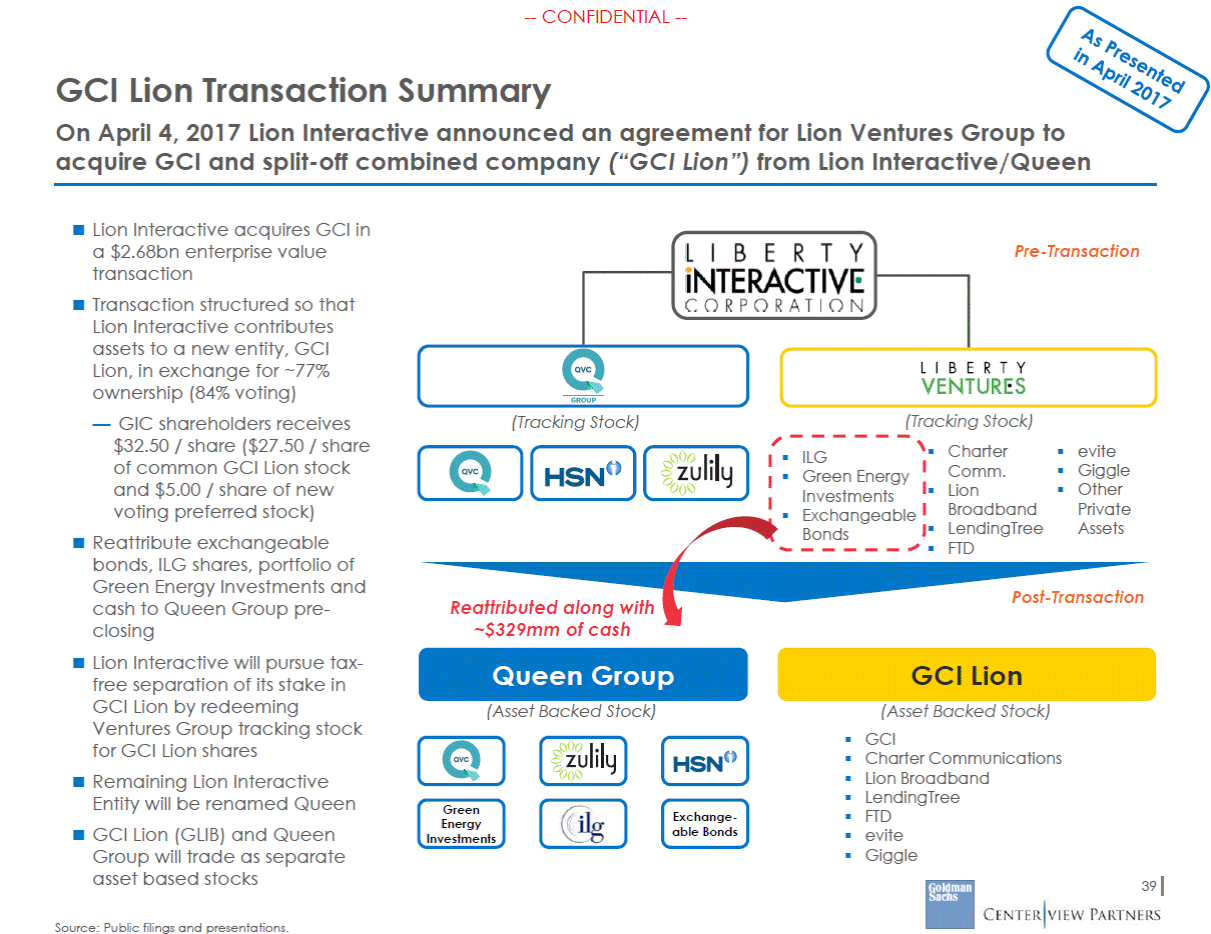
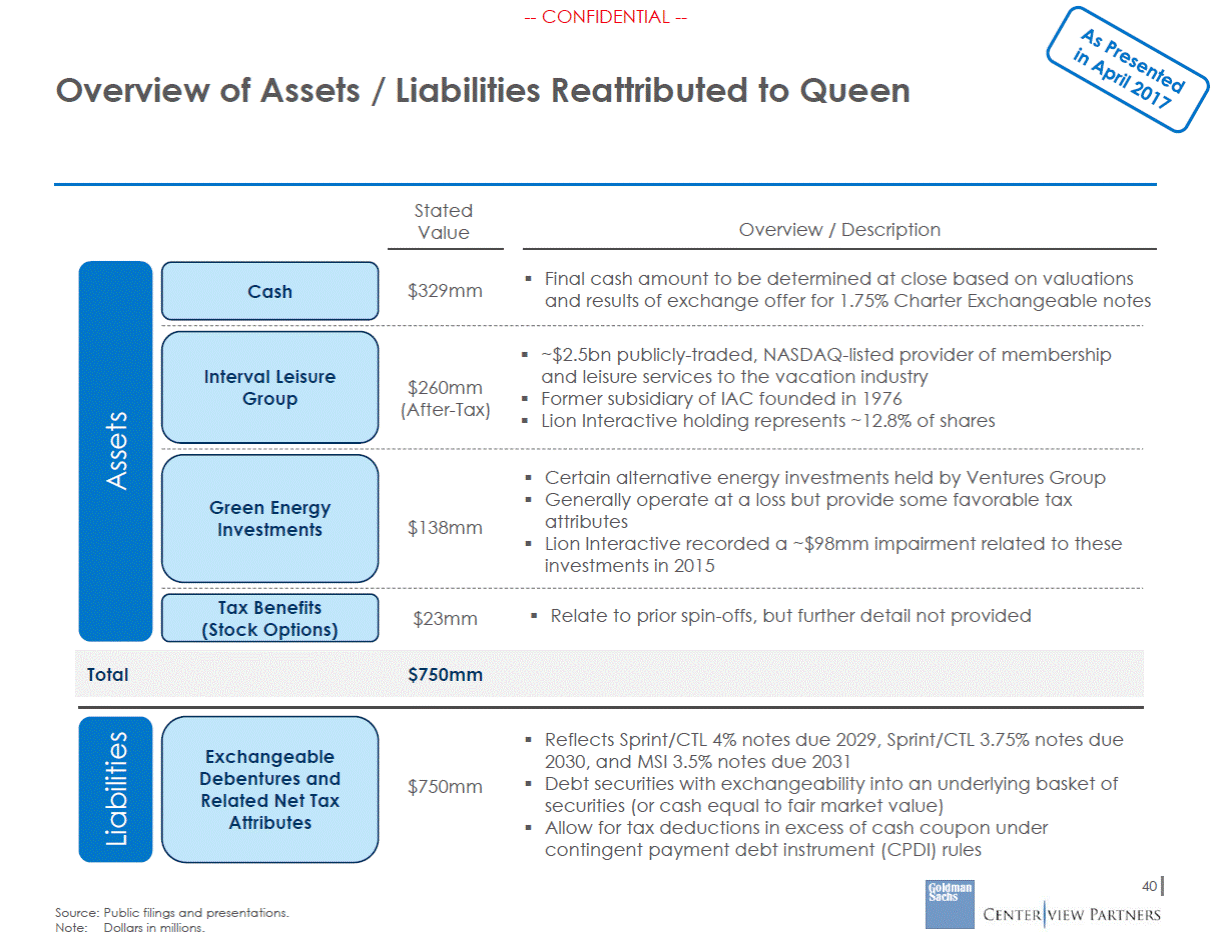
--CONFIDENTIAL --Overview of Assets / Liabilities Reattributed to Queen Stated Value Overview / Description Final cash amount to be determined at close based on valuations and results of exchange offer for 1.75% Charter Exchangeable notes $329mm Cash ~$2.5bn publicly-traded, NASDAQ-listed provider of membership and leisure services to the vacation industry Former subsidiary of IAC founded in 1976 Lion Interactive holding represents ~12.8% of shares Interval Leisure Group $260mm (After-Tax) Certain alternative energy investments held by Ventures Group Generally operate at a loss but provide some favorable tax attributes Lion Interactive recorded a ~$98mm impairment related to these investments in 2015 Green Energy Investments $138mm Tax Benefits (Stock Options) Relate to prior spin-offs, but further detail not provided $23mm Reflects Sprint/CTL 4% notes due 2029, Sprint/CTL 3.75% notes due 2030, and MSI 3.5% notes due 2031 Debt securities with exchangeability into an underlying basket of securities (or cash equal to fair market value) Allow for tax deductions in excess of cash coupon under contingent payment debt instrument (CPDI) rules Exchangeable Debentures and Related Net Tax Attributes $750mm 40 Source: Public filings and presentations. Note:Dollars in millions. Liabilities Assets Total$750mm
